2764
Application of Multi-echo Dixon Technique and IVIM-DWI in Patients with Primary Osteoporosis : A Preliminary Study with 3.0 T MRI
Fan Qiuju1, Tan Hui1, Yang Zhen1, Yu Nan1, Yu Yong1, Wang Shaoyu2, Xue Yu3, and Li Yue3
1Affiliated Hospital of Shaanxi University of Chinese Medicine, Shaanxi, China, 2MR senior scientific marketing specialist, Shaanxi, China, 3Shaanxi University of Chinese Medicine, Shaanxi, China
1Affiliated Hospital of Shaanxi University of Chinese Medicine, Shaanxi, China, 2MR senior scientific marketing specialist, Shaanxi, China, 3Shaanxi University of Chinese Medicine, Shaanxi, China
Synopsis
This study aimed to investigate the role of multi-echo Dixon technique and IVIM-DWI in assessing vertebral marrow changes among subjects with osteoporosis, osteopenia and normals. The multi-echo Dixon technique and IVIM-DWI were used to evaluate 26 healthy volunteers, 26 osteopenia patients and 24 osteoporosis patients. The FF, D and D* among osteoporosis, osteopenia and normals were significantly different.Furthermore, we found that there was a statistically significant positive correlation between D value and T-score,while the D* value and FF were negatively correlated to the T-score.
Introduction:
Osteoporosis (OP) has become a global public health problem and cutting-edge research problem. Microvessel reduction and microcirculatory disturbance are important factors of the genesis and progression of OP. Quantitative MRI is now taking critically importat role in identifying individuals at risk about OP and also in monitoring response to treatment. The aim of this study was to investigate the role of multi-echo Dixon technique and IVIM-DWI in assessing vertebral marrow changes among subjects with osteoporosis, osteopenia and normals at 3 T MRI.Methods:
From September 2018 until February 2019, 76 patients, who underwent QCT of the lumbar, were divided into three groups based on T-score, including 26 healthy volunteers (12 male, age= 45.9 ± 10.7 years, T-score = 0.15 ± 0.83), 26 osteopenia patients (11 males, age= 54.2 ± 10.3 years, T-score = -1.84 ± 0.29) and 24 osteoporosis patients (9 males, age= 61.0 ± 9.5 years, T-score = -3.32 ± 0.68 ) were enrolled. Data were collected on a MAGNETOM Skyra 3T MR scanner (Siemens Healthcare, Erlangen, Germany) with an 18-channel table-mounted spine matrix coil. The parameters about IVIM-DWI were: TE/TR 72.4/1600ms, 8 b values (0, 50, 100, 150, 200, 250, 300, 400, 600 and 800 sec/mm2) on 3 gradient directions. The parameters about Multi-echo Dixon were: TR 9.0 ms, TE 1.23 ms, 2.46 ms, 3.69 ms 4.92 ms, 6.15 ms and 7.38 ms, flip angle 4.0°, readout echo bandwidth 1080 Hz/pixel, slice thickness 2.5 mm, FOV 400 × 400 mm, matrix 256 × 256. The regions of interest (ROIs) were delineated in lumbar 2-4 (areas 1.0 cm2 ) on IVIM parameter images and fat_fraction maps. One-way ANOVA were performed to evaluate the significance of the inter-group difference in FF and IVIM parameters (f value, D value and D* value).Results:
The FF, D and D* of normal group were 43.63±7.88, 0.393±0.105, 78.19±16.06, osteopenia group were 49.58±5.02, 0.356±0.097, 87.36±21.39; and osteoporosis group were 57.88±10.01, 0.303±0.069, 97.27±29.65. Furthermore, the FF, D and D* among osteoporosis, osteopenia and normals were significantly different (p < 0.05). We found that there was a statistically significant positive correlation between D value and T-score (r=0.854, P <0.001). The D* value (r=–0.785, P < 0.001) and FF (r= -0.882, P < 0.001) were negatively correlated to the T-score.Conclusion:
The multi-echo Dixon technique combined with IVIM-DWI can quantitatively reflect the change of lumbar microcirculatory and fat contant, which can be used as biomarkers for disease progression in osteoporosis.Acknowledgements
None.References
None.Figures
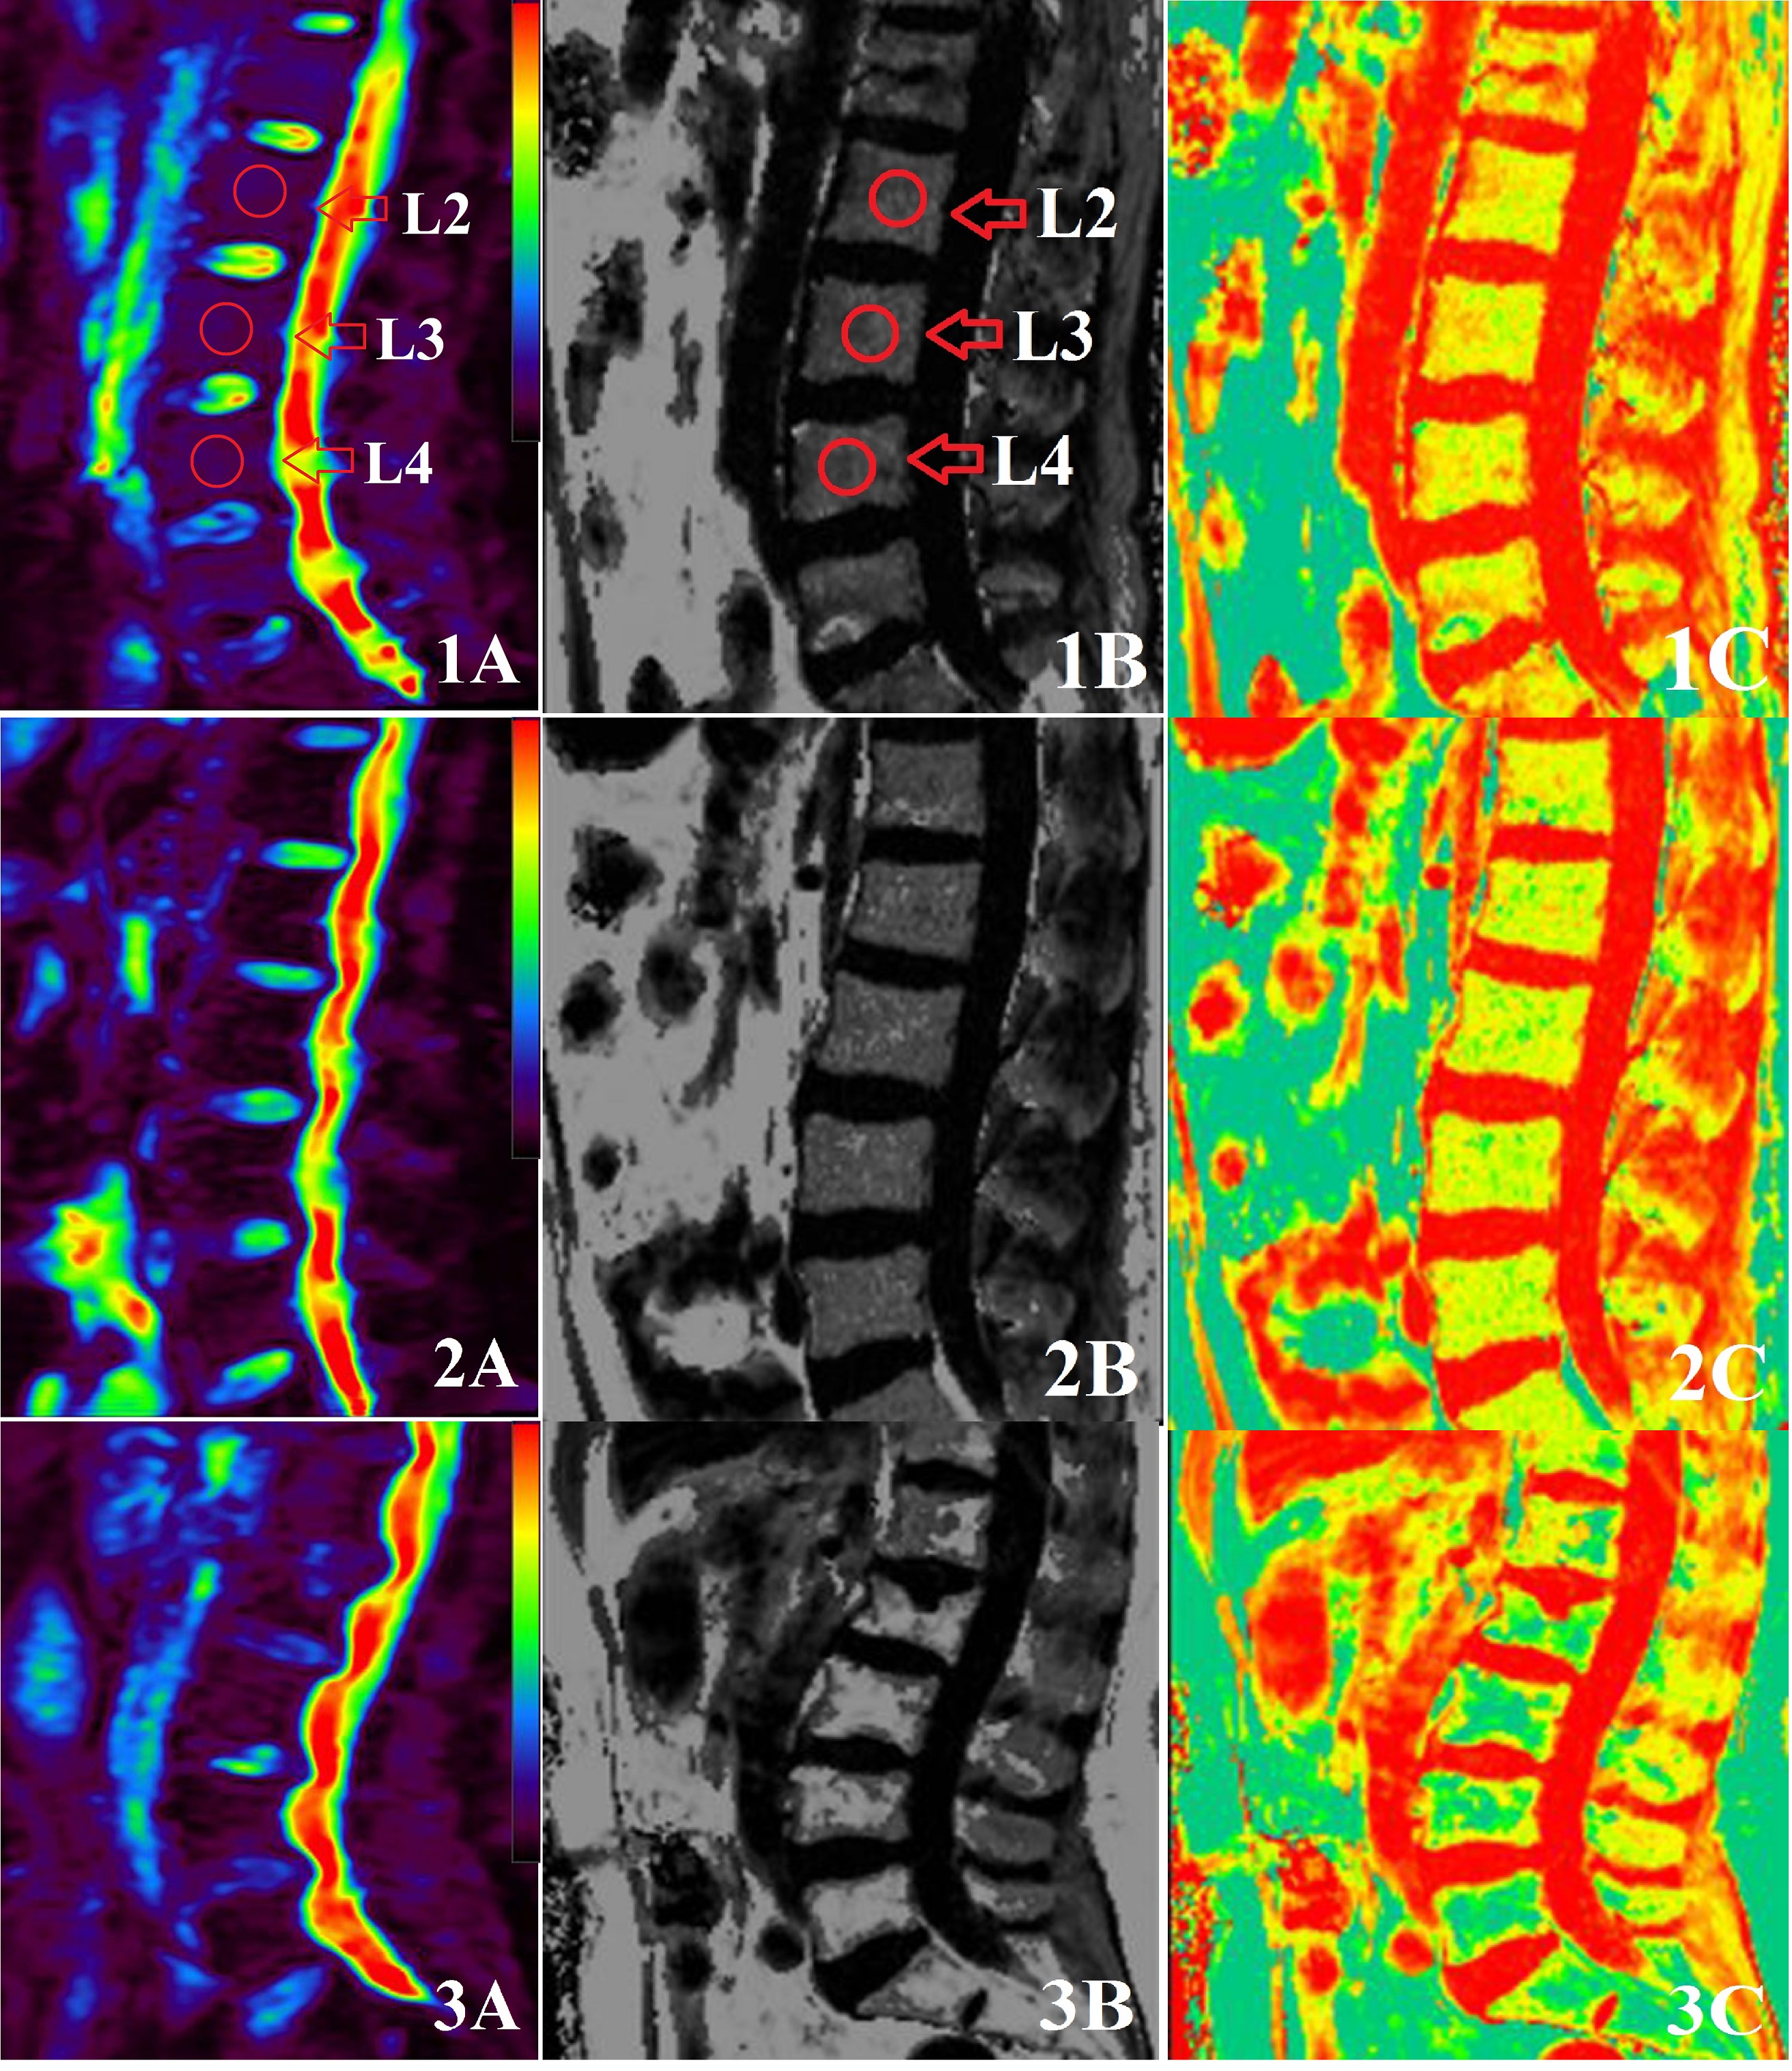
Figure.
IVIM-DWI and FF of the
L2-4 vertebral body.
1A-1C)
A 46 years old female patient with normal BMD (T-score = 1.23). 2A-2C) A 54
years old male patient with osteopenia (T-score = -1.51). 3A-3C) A 78 years old
female patient with osteoporosis (T-score =-4.79). Representative midsagittal
images IVIM-DWI (left), Fat_Fraction maps (middle) and pseudocolor maps of the
Fat_Fraction (right) with region of interests (ROIs) drawn in the center of
lumbar 2-4. Both Fat-signal fraction and D* value changes increase with
decreasing T-score, while D value is decreaed (top to bottom).