2762
Angular dependence of UTE signal of mouse femur– a pilot study of assessing structure of collagen matrix using MRI1Hokkaido University, Sapporo, Japan, 2Teine Keijinkai Hospital, Sapporo, Japan, 3Osaka University, Osaka, Japan
Synopsis
Collagen fibers in the healty cortical bone tends to align to the bone axis, and the degree of this orientation is one of dominant factors to determine bone strength. Because microscopic R2* around a collagen fiber is anisotropic, we investigated how the UTE signal from mice femurs (normal and osteopetrotic) varies by changing the angle between the bone axis and B0 for future MRI evaluation of bone strength. The angular dependence of UTE signal of a knockout osteopetrotic mouse decreased 1/5 of a normal mouse. This decrease reflects deterioration of collagen fiber orientation that is a pathological evidence of osteopetrosis.
Introduction
Collagen fibers, which mostly compose the bone matrix, tend to align to the bone axis in the healthy bone, and the properties of the bone matrix determine bone strength that predicts a risk of bone fracture.1 Although both orientation and density of collagen fibers are the major properties of the matrix, the bone mineral density which is proportional to collagen density has normally been measured by using dual-energy X-ray absorptiometry or X-ray CT in clinical practice. The value of bone mineral density measured by these current methods often fails to predict risks of bone fracture.2 Recently, an MR research reported an R2* anisotropy of collagen fiber in knee cartilage.3 Focusing on this anisotropy of collagen fiber, we investigated how UTE (ultrashort echo time) signal from a mouse femur varies by changing the angle between the bone axis and B0. To observe the difference of this angular dependence of femur UTE signal between healthy and diseased bone matrices, femurs of a normal and a knockout osteopetrotic mouse were used.Materials and Methods
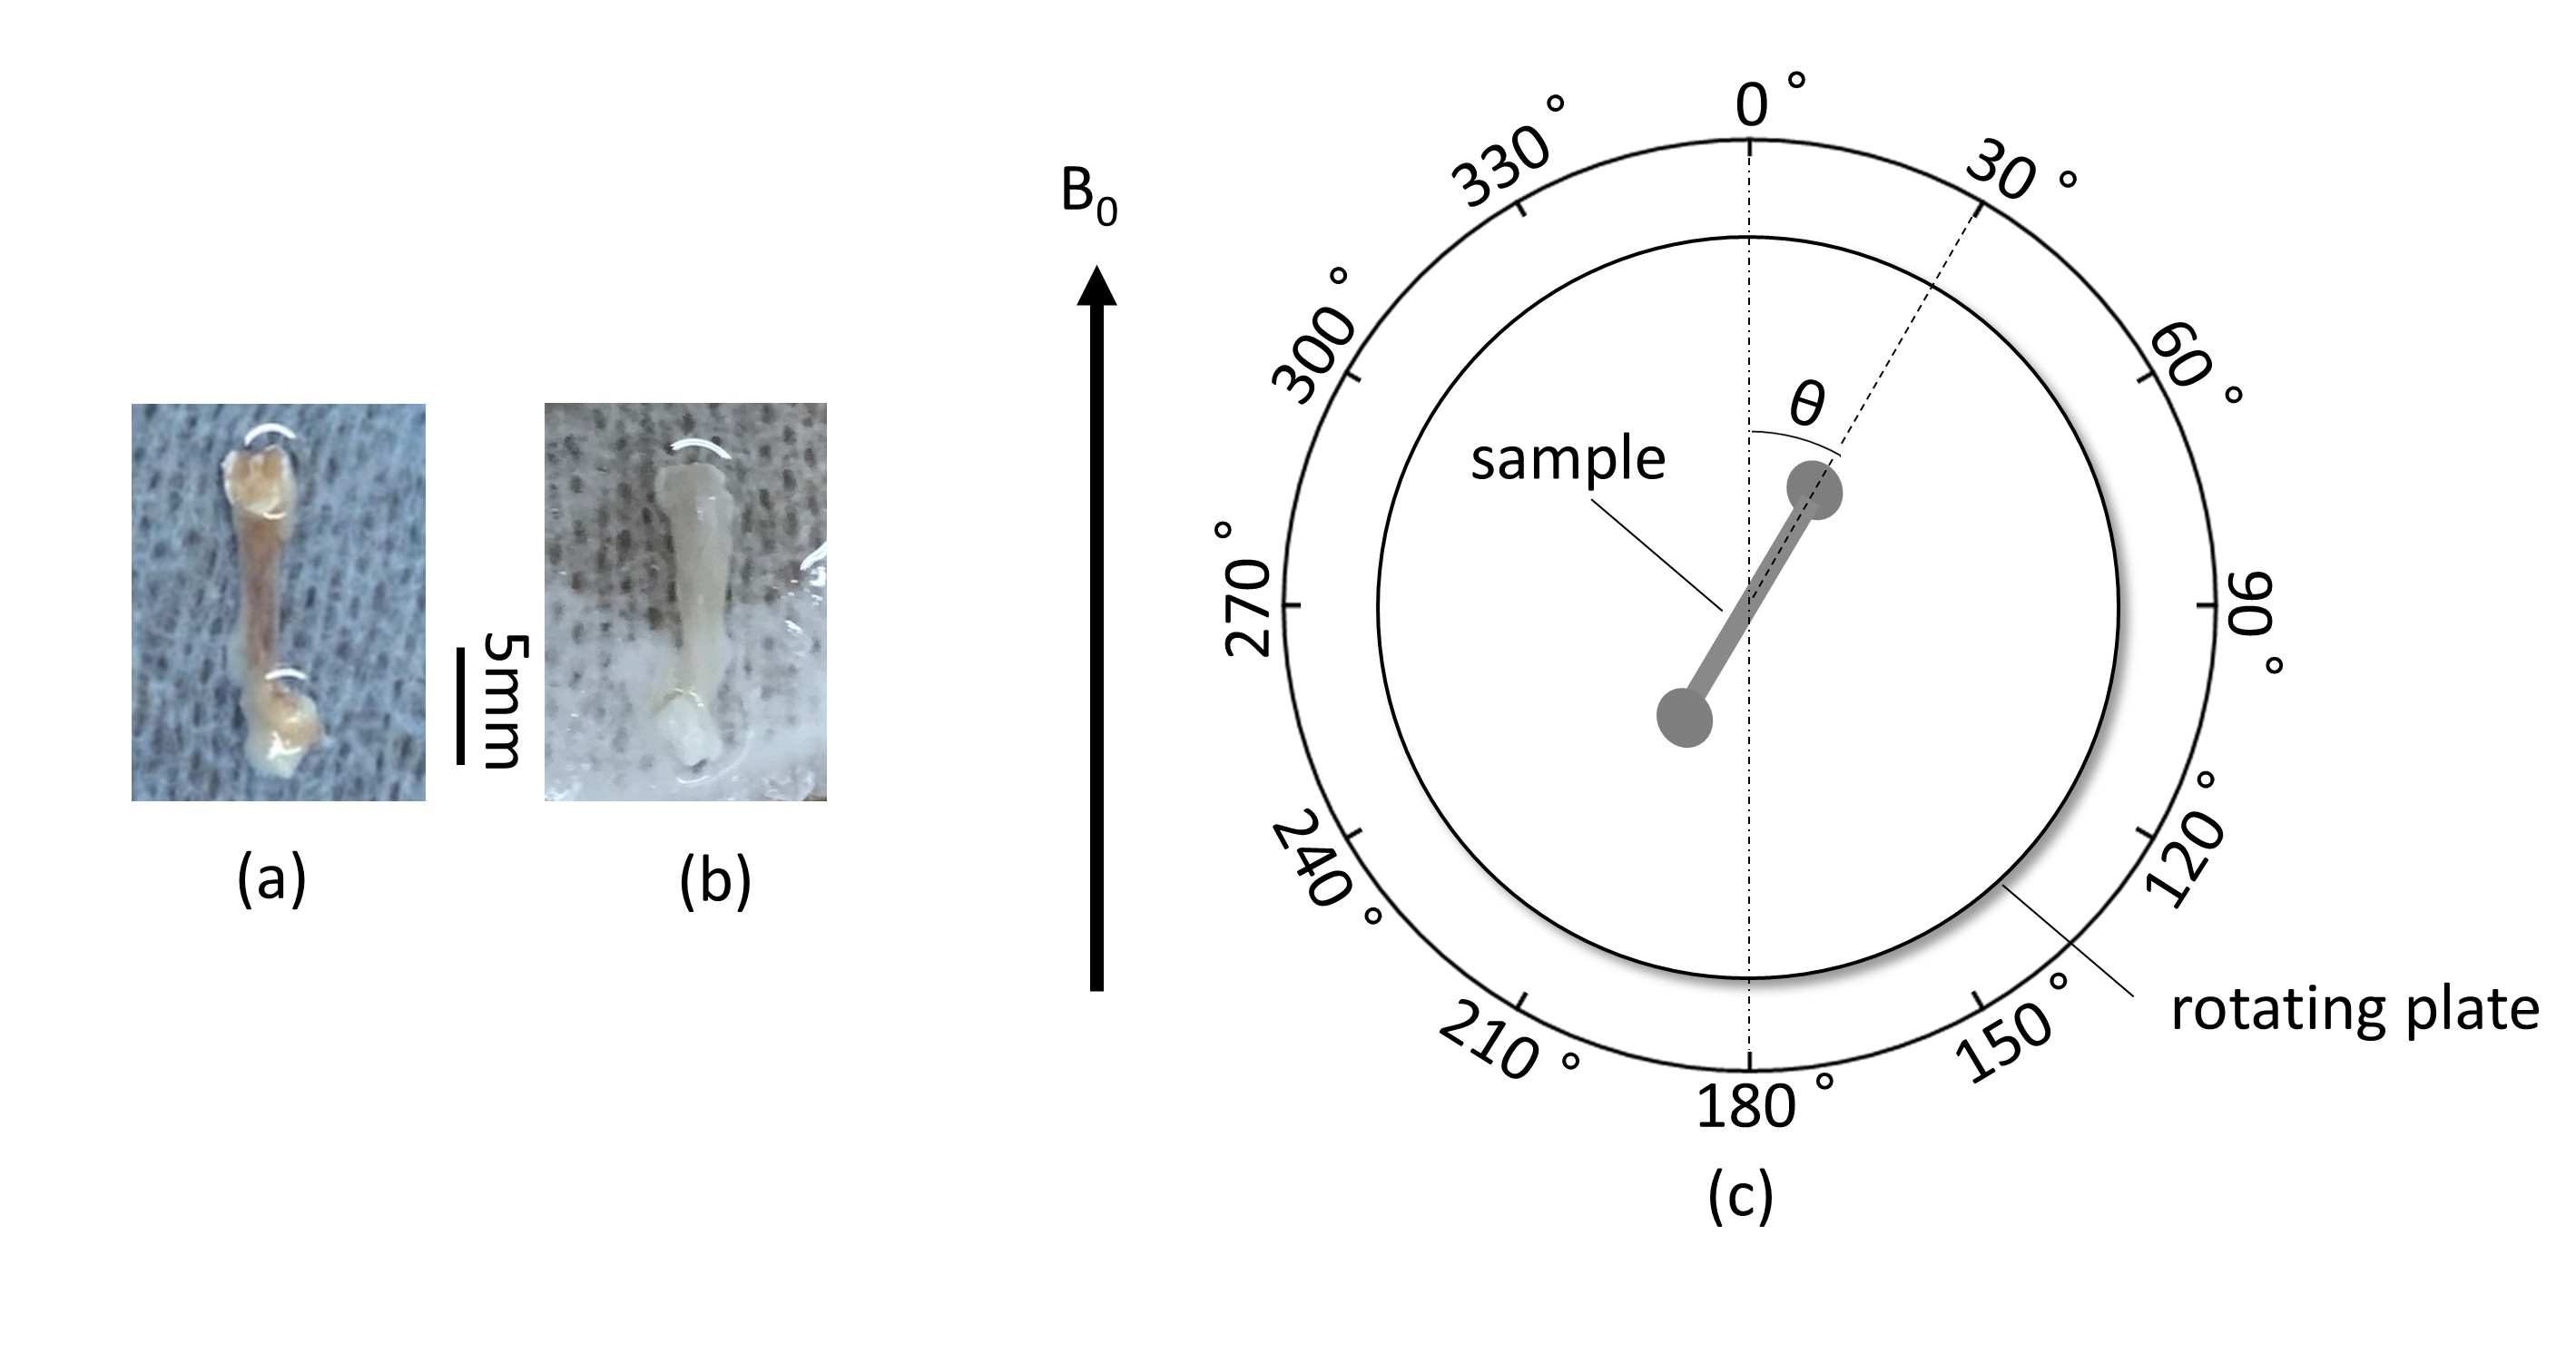
A femur sample of a normal mouse (14-week-old, male) (Fig. 1a) was fixed on the center of a rotating plate (Fig.1c) and this plate was placed in the center of a 3-T MRI scanner (Prisma, Siemens). When the bone axis was parallel to B0, the angle between the bone axis of the sample (θ in Fig.1c) was set as 0°. A single slice (thickness, 3.6 mm) which included the femur thickness was imaged by PETRA (TE = 0.07ms): an UTE pulse sequence to enhance MR signal form bound waters around collagens. This imaging was repeated by rotating the plate every 30°. The signal of the femur on each image was measured. This protocol was also applied to a femur sample of a knockout mouse (14-week-old, male) which presented an osteopetrotic phenotype (Fig.1b). The MR signal (S) of bone is written by$$ S=S_{0}\cdot e^{{-R_2^*}\cdot TE} \qquad\qquad\qquad\qquad\qquad\qquad [1], $$
where the S0 represents a constant proportional to the proton density. This equation is transformed to
$$\frac{lnS}{TE}=\frac{lnS_{0}}{TE} -R_2^* \qquad\qquad\qquad\qquad\qquad\qquad [2]. $$
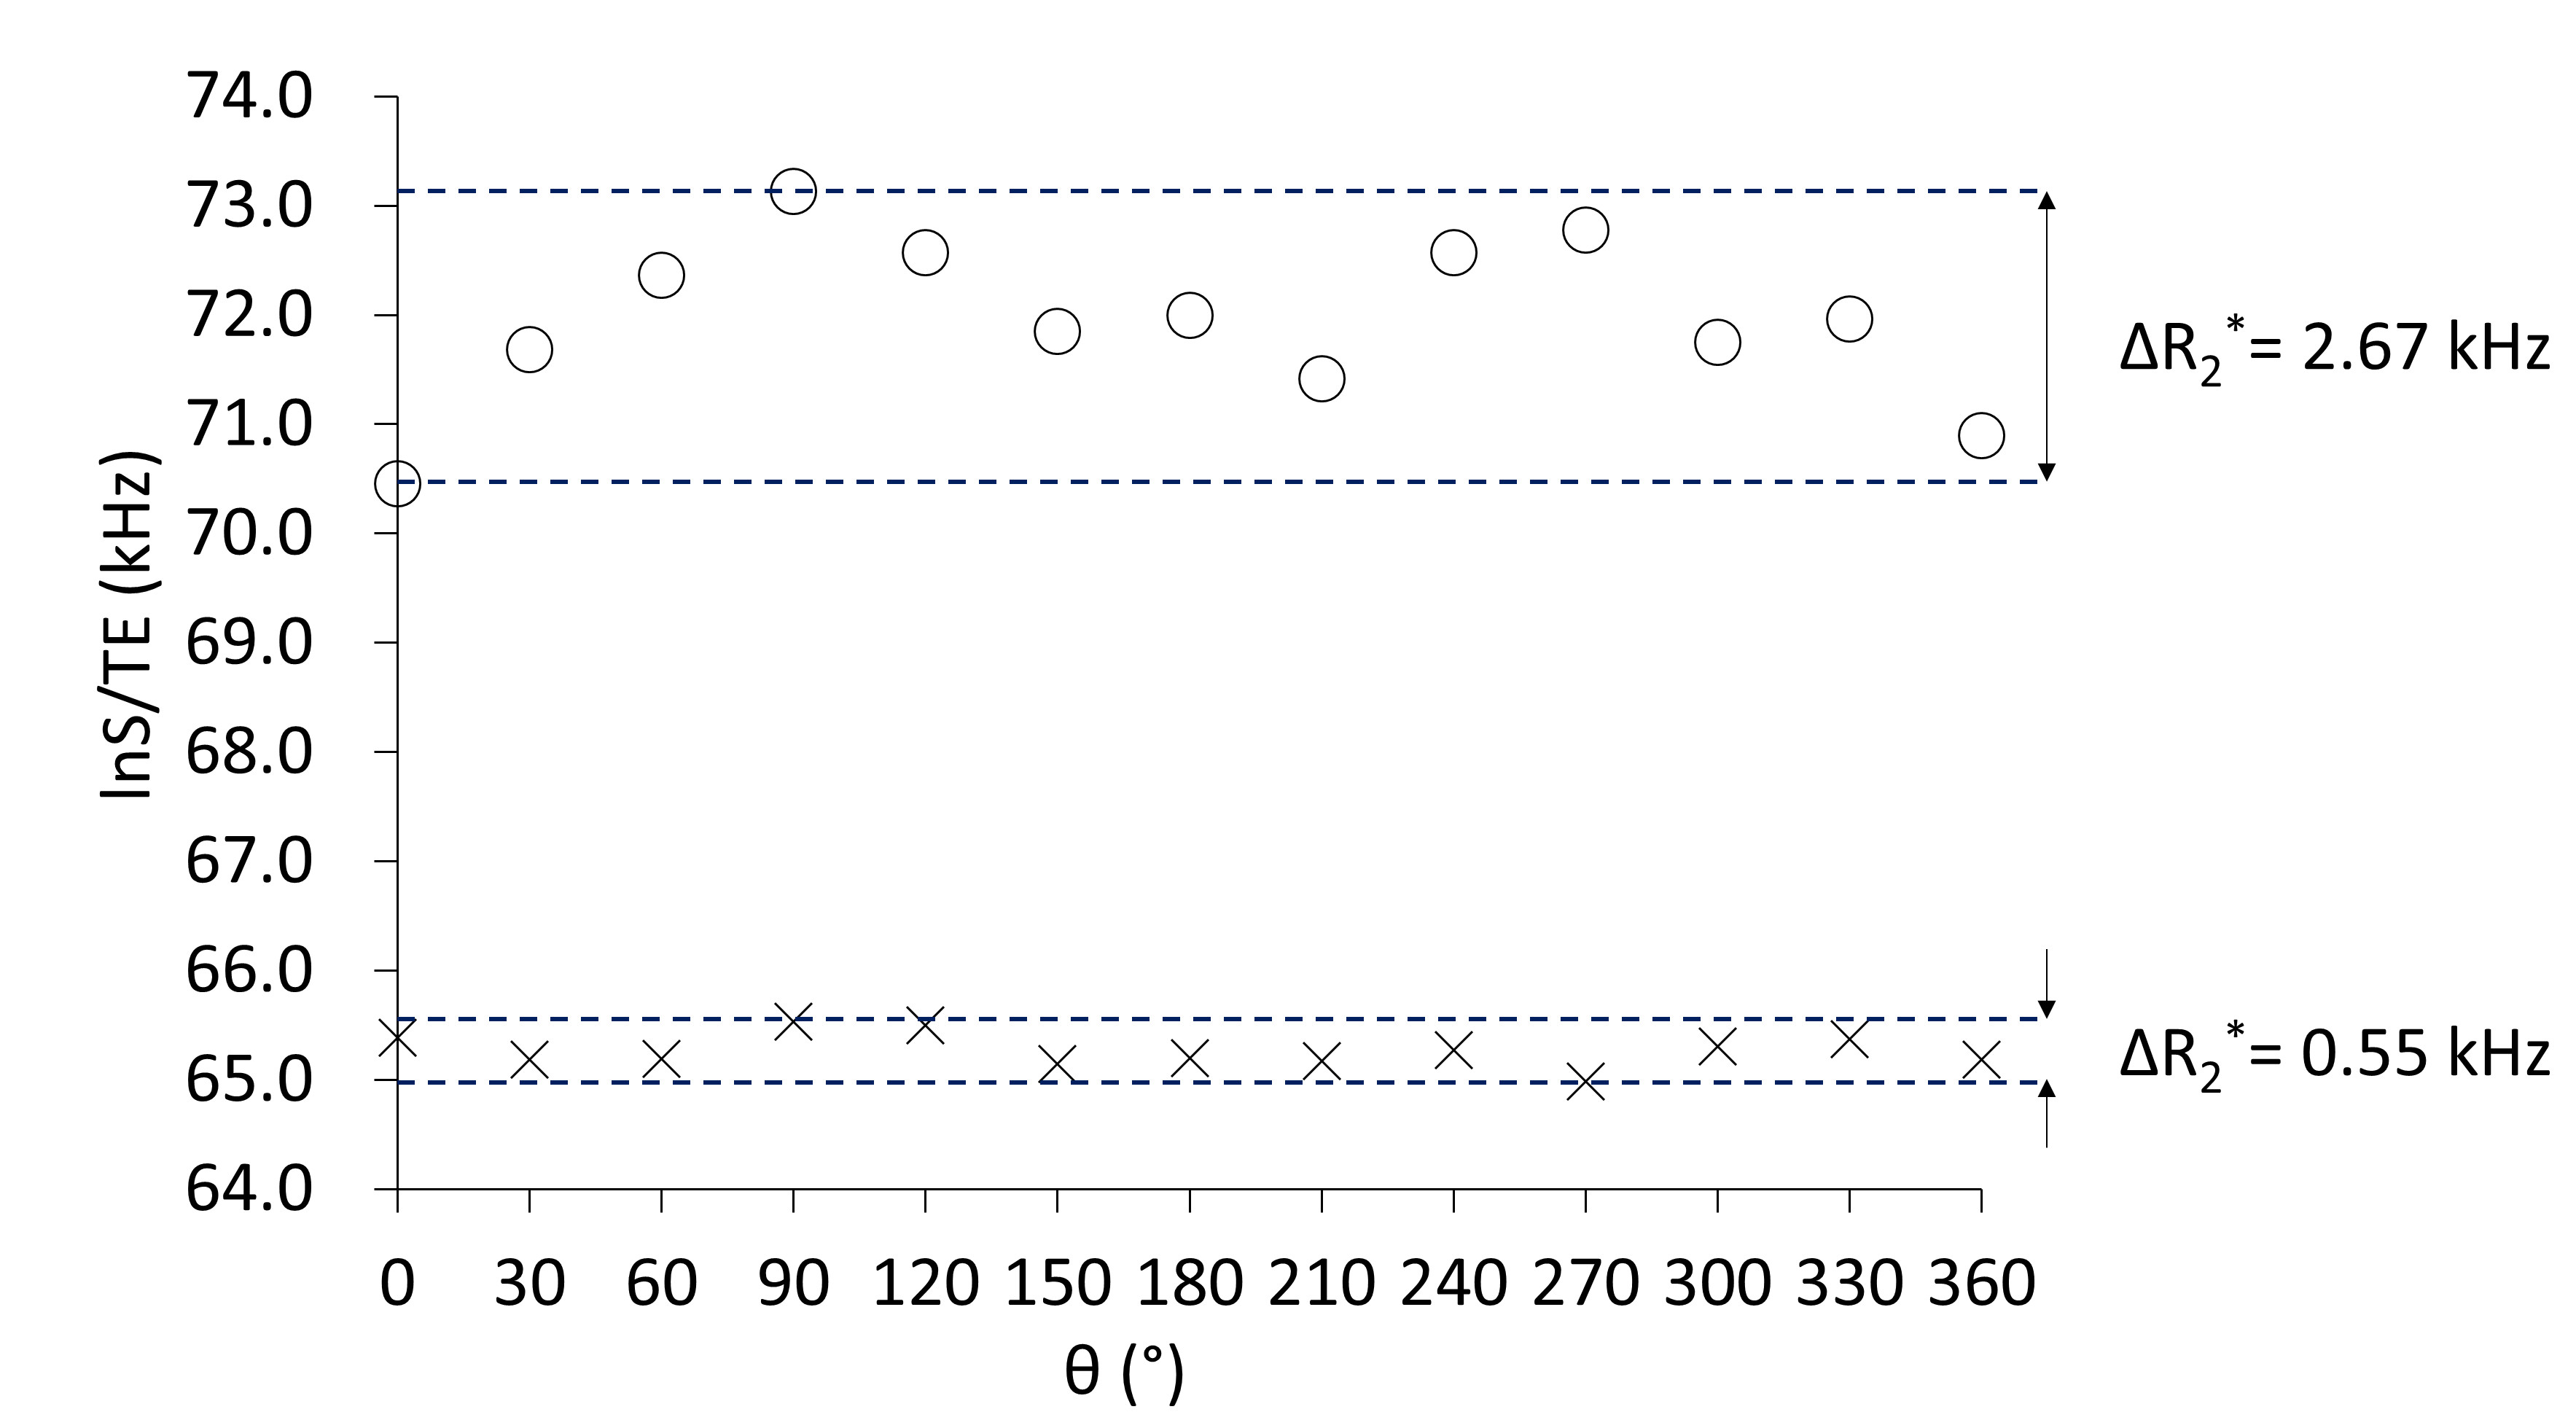
The values of this equation (lnS/TE) of the obtained UTE MR signals at all θs were plotted to observe angular dependence of R2*. The peak-to-peak changes of R2* ( ΔR2*) in the plot was measured for normal and diseased samples.
Results and Discussion
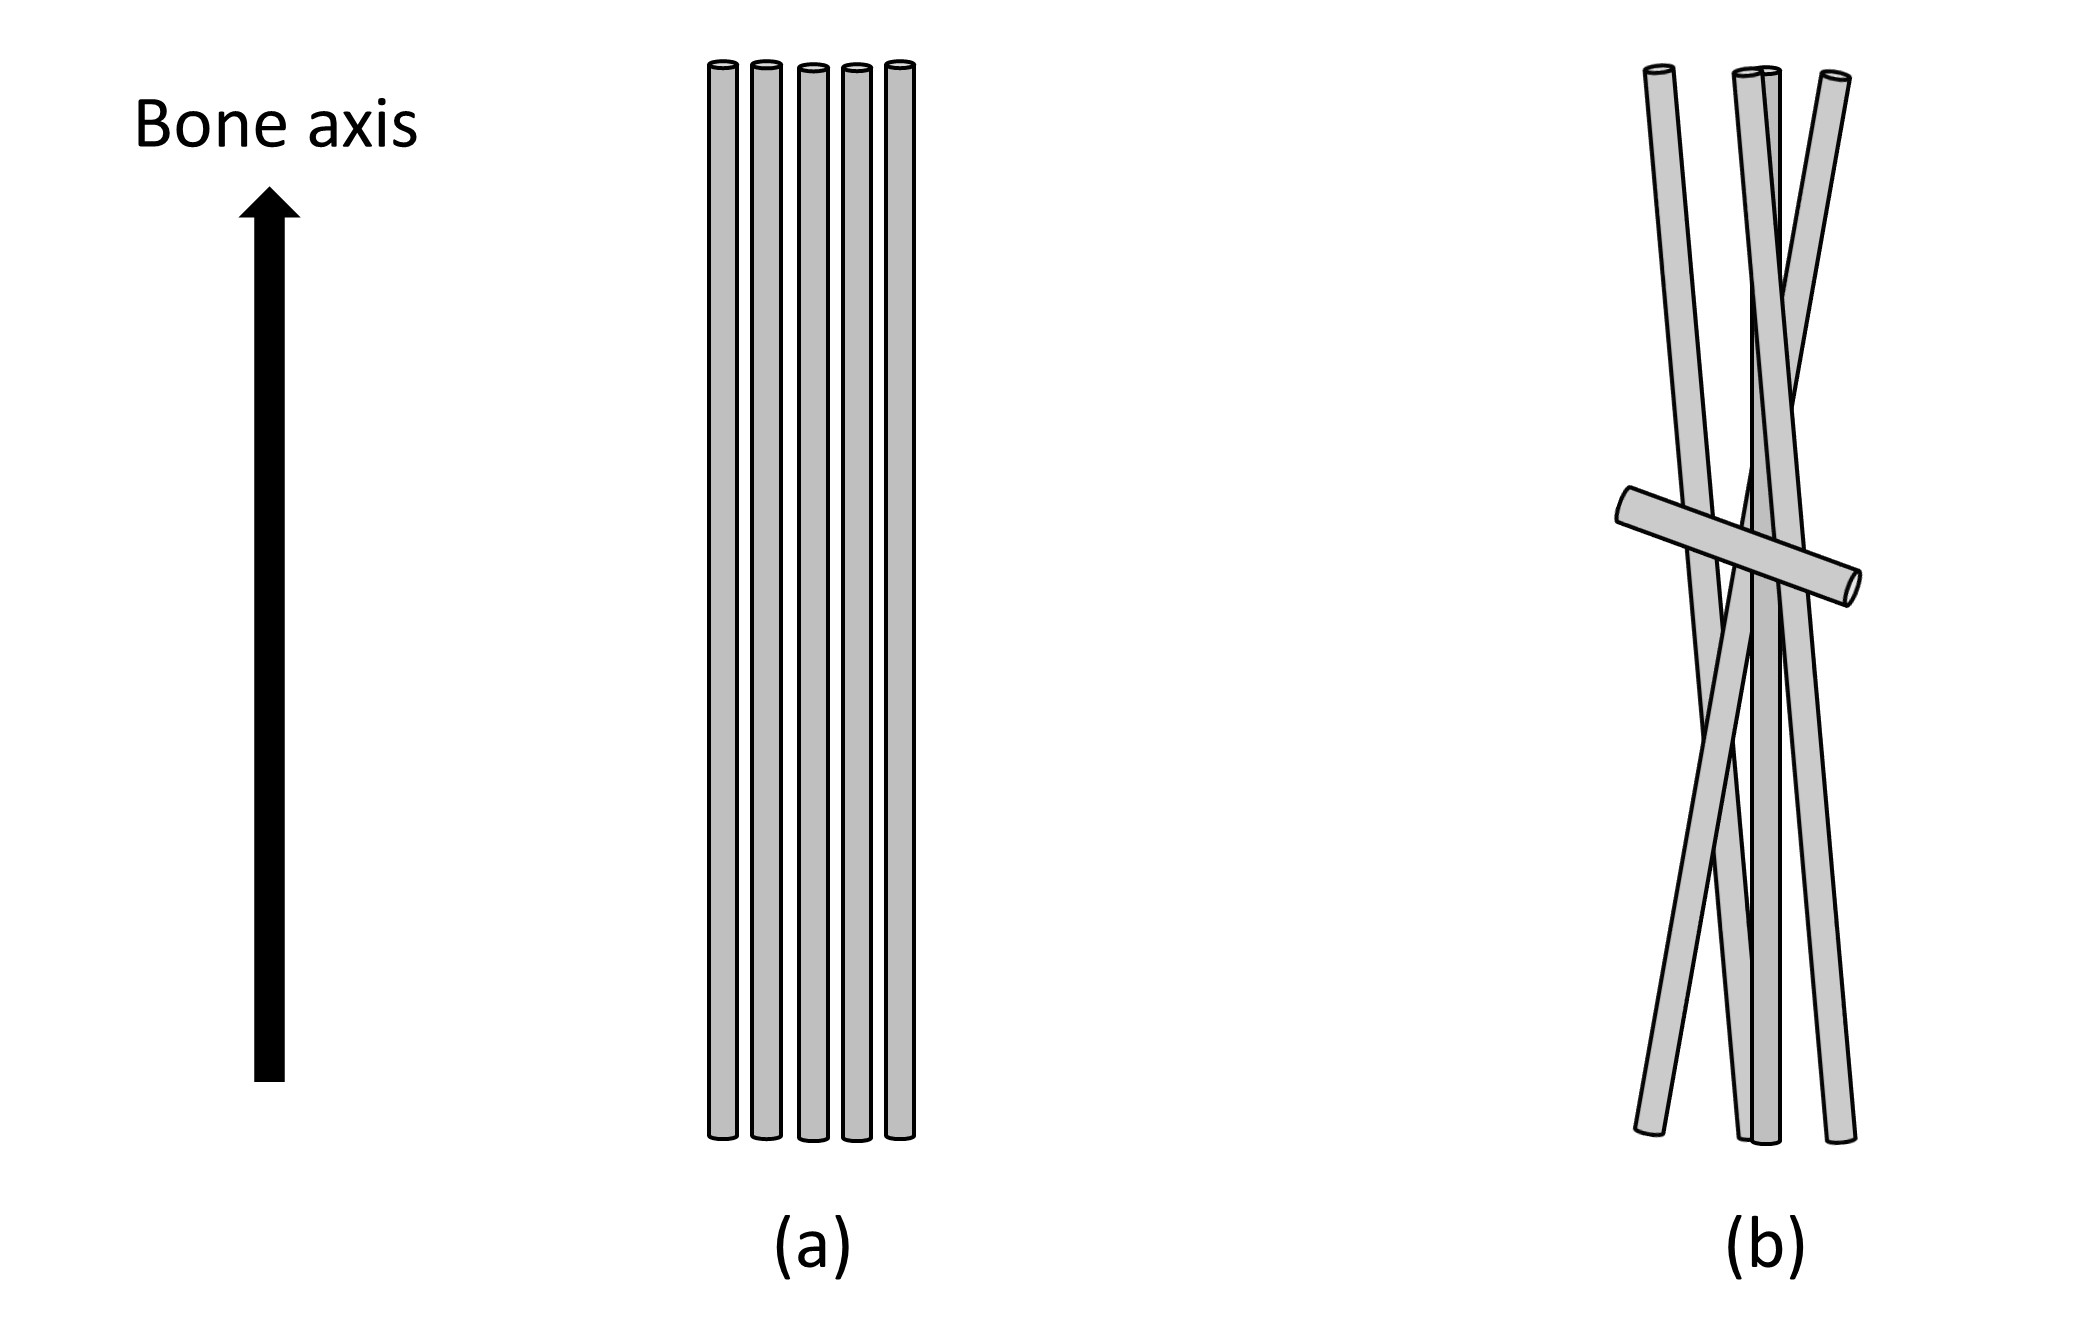
The lnS/TE (Eq. 2) value of the femur of a normal mouse showed 180°-periodic angular dependence with a relatively large ΔR2* as 2.67 kHz (Fig.2); the signal was highest/lowest when the bone axis aligned perpendicular/parallel to B0. From Eq. 2, the results of this angular dependence lead that the maximum R2*when the bone axis aligned parallel to B0 and the minimum R2*when the bone is perpendicular to B0. This angular dependence of lnS/TE reflects the R2*anisotropy of collagen fiber and agrees with the reported result of collagen fiber in knee cartilage.3 Contrarily in the lnS/TE plot of the osteopetrotic mouse femur any periodicity was not observed and the ΔR2* (0.55 kHz) decreased to 1/5 of the value of normal mouse (Fig.2). A recent research reported that the collagen matrix orientation deteriorated in the femur of the knockout osteopetrotic mouse indicating the orientation of collagen fiber along the bone axis is not prominent comparing to the homogenous collagen orientation along the bone axis within the normal femur (Fig.3).4 The microscopic R2* anisotropy for a collagen fiber tends to be cancelled due to the various orientation of collagen fibers, hence leading to the decrease in the R2* for knockout osteopetrotic mouse. Although the shape anisotropy of a femur would induce the angular dependence of MR signal due to the macroscopic R2* caused by a bulky susceptibility of a specimen, it should be less than the observed smaller ΔR2* (0.55 kHz) because the shape and susceptibility of both bone specimens is almost the same. Therefore, the influence of the shape anisotropy does not jeopardize the tendency of the decrease in ΔR2*. Our results indicate that UTE signal reflects the properties of matrix of collagen fibers in bone, and future MRI evaluation of bone strength would be expected.Conclusions
The angular dependence of UTE signal from a normal mouse femur was firstly observed. A decrease of this angular dependence for the femur from a knockout osteopetrotic mouse due to the deterioration of collagen fiber orientation was indicated. The orientation of collagen fibers in bone would be assessed by MRI.Acknowledgements
No acknowledgement found.References
1. Compston J. Bone Quality : What is it and how is it. Arq Bras Endocrinol Metab. 2006; 50(4):579–585.
2. Schuit SCE, Van Der Klift M, Weel AEAM, et al. Fracture incidence and association with bone mineral density in elderly men and women: The Rotterdam Study. Bone. 2004; 34(1):195–202.
3. Wei H, Dibb R, Decker K, et al. Investigating magnetic susceptibility of human knee joint at 7 Tesla. Magn Reson Med. 2017;78(5):1933–1943.
4. Ishimoto T, Sato B, Lee J, et al. Co-deteriorations of
anisotropic extracellular matrix arrangement and intrinsic mechanical property
in c-src deficient osteopetrotic mouse femur. Bone. 2017;103: 216–223.
Figures