2761
Vertebral Marrow Microenvironment Indexes in Middle-aged and Elderly People with Varying Bone Mineral Density: Functional MRI Evaluation1Department of Radiology, Shanghai Tenth People’s Hospital, Tongji University School of Medicine, Shanghai, China, 2Clinical Science, Philips Healthcare, Shanghai, China
Synopsis
Our study found that the differences of the parameters of mDIXON-Quant and IVIM-DWI [T2*, fat fraction (FF) and f values] among three groups with varying bone mineral density (normal, osteopenic and osteoporotic) were statistically significant. The correlations of the T2* and FF values with T-score were negative and the correlations of the D* and f values with T-score were positive. Our study implies that mDIXON-Quant and IVIM-DWI techniques were helpful to reflect the changes of vertebral marrow microenvironment of osteoporosis, which may provide valuable information for the assessment of the bone quality.
Objectives
To prospectively study the relationship among marrow iron deposition, marrow fat content, marrow diffusion and marrow perfusion in middle-aged and elderly people with varying bone mineral density (BMD) [1-3].Methods
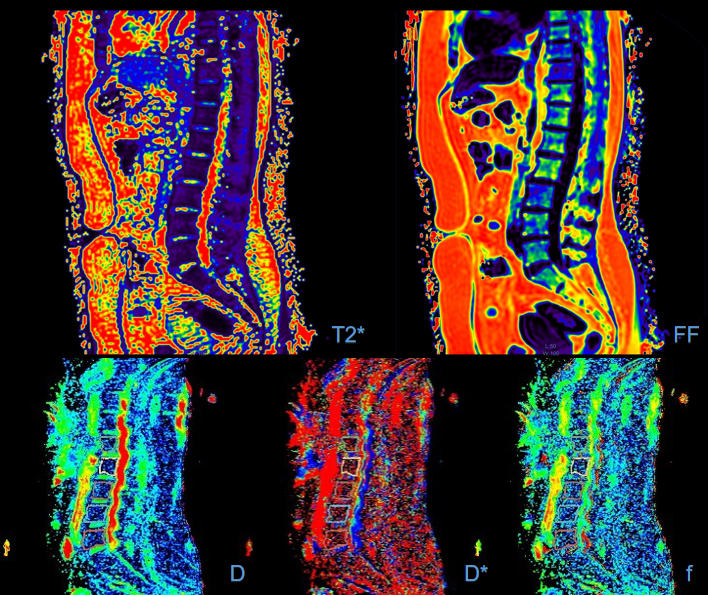
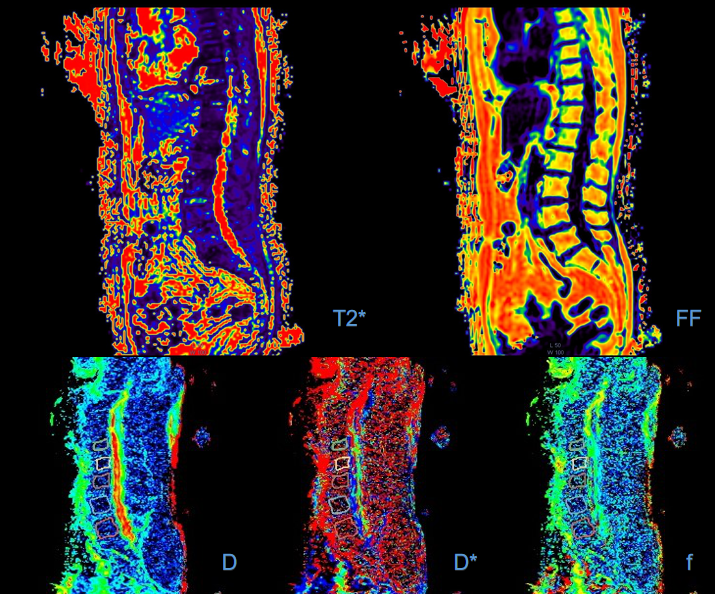
Institutional study approval and informed consent were obtained. Dual X-ray absorptiometry (DXA), mDIXON-Quant, and intravoxel incoherent motion diffusion weighted imaging (IVIM-DWI) of the lumbar spine were performed in 127 patients (52 men and 75 women; mean age, 57 years; range, 40–81 years). Iron deposition (T2*), fat content (fat fraction, FF), diffusion coefficient (D and D*), and perfusion fraction (f) of vertebral marrow were compared among three bone mineral density groups [normal (n = 52, Fig 1), osteopenic (n = 36) and osteoporotic (n = 39, Fig 2)] according to the T-score measured by DXA. The differences of the T2*, FF, D, D* and f values among three groups were analyzed by one-way analysis of variance test and their correlations with T-score were analyzed by Pearson correlations.Results
The differences of the T2*, FF and f values among three groups were statistically significant (P < 0.05). The correlations of the T2* and FF values with T-score were negative (r = -0.435, P < 0.05 and r = -0.411, P < 0.05, respectively) and the correlations of the D* and f values with T-score were positive (r = 0.177, P < 0.05 and r = 0.186, P < 0.05, respectively).Conclusions
mDIXON-Quant and IVIM-DWI can accurately quantify the vertebral marrow iron deposition, fat content, diffusion and perfusion. Their parameters including T2*, FF and f values were helpful to reflect the changes of vertebral marrow microenvironment of osteoporosis, which may provide valuable information for the assessment of the bone quality.Acknowledgements
No acknowledgement found.References
[1] Tan H, Xu H, Luo F, et al. Combined intravoxel incoherent motion diffusion-weighted MR imaging and magnetic resonance spectroscopy in differentiation between osteoporotic and metastatic vertebral compression fractures.J Orthop Surg Res, 2019, 14: 299.
[2] Guo Y, Chen Y, Zhang X, et al. Magnetic Susceptibility and Fat Content in the Lumbar Spine of Postmenopausal Women With Varying Bone Mineral Density.J Magn Reson Imaging, 2019, 49: 1020-1028.
[3] Zhao Y, Huang M, Ding J, et al. Prediction of Abnormal Bone Density and Osteoporosis From Lumbar Spine MR Using Modified Dixon Quant in 257 Subjects With Quantitative Computed Tomography as Reference.J Magn Reson Imaging, 2019, 49: 390-399.
Figures