2759
Variable flip angle T1 Relaxometry of cortical bone free water; correlation with the mechanical compression test1Quantitative MR Imaging and Spectroscopy Group, Research Center for Cellular and Molecular Imaging, Tehran University of Medical Sciences, Tehran, Iran, Tehran, Iran (Islamic Republic of), 2Medical Physics and Biomedical Engineering Department, Tehran University of Medical Sciences, Tehran, Iran, Tehran, Iran (Islamic Republic of), 3Quantitative MR Imaging and Spectroscopy Group, Research Center for Cellular and Molecular Imaging, Tehran University of Medical Sciences, Tehran, Iran, Brisbane, Australia, 43Medical Physics Department, School of Medicine, Iran University of Medical Sciences, Tehran, Iran, Tehran, Iran (Islamic Republic of), 5Department of Mechanical Engineering, Najafabad Branch, Islamic Azad University, Najafabad, Iran, Najaf Abad, Iran (Islamic Republic of)
Synopsis
Cortical bone porosity contributes to bone quality but is under the limit of the current clinical imaging modalities’ resolution. T1 value of water molecules residing in cortical bone pores is linked with their mobility. Since the changes in surface-to-volume ratio of the pores affect cortical bone mechanical properties, we assumed that free water T1 (T1,free) would model the mechanical properties of cortical bone. Variable flip angle, variable TR, and inversion recovery methods were used to quantify T1,free and their correlation with bone toughness was assessed. The results showed VFA T1,free could predict the cortical bone toughness (r = -0.63, p<0.01).
Introduction
Bone is a complicated structure that has to be strong enough to bear the body load and yet light enough to ease mobility of the skeleton1. As cortical bone is more susceptible to fracture, proper assessment of cortical strength is necessary2. Bone fracture risk increases by age in both genders and due to some pathologies3. The bone resorption process in endosteal and intracortical surfaces weakens the cortical bone and compromises its strength. Previous studies have shown that discriminated cortical bone water pools’ NMR properties have a significant relationship with bone mechanical competence4-6. We assumed that cortical bone free water T1 could provide us with information regarding the mobility of the molecules in the pores and hence information about pore size. We have shown previously that cortical bone pore water T1, quantified by dual-TR technique (VTR), reflects microstructural information (S/V related to the mobility of the water molecules residing in cortical pores, and strongly correlates with age7. In this study, we aim to investigate a more accurate method for pore water T1 quantification. To this end, we compare three different methods as variable flip angle (VFA), variable TR (VTR), and Inversion recovery (IR) and investigate their ability to predict bone mechanical competence.methods
Sample preparation: twenty cross-section cylindrical cortical bone specimens (length = 36 mm) were cut from the mid-shaft of freshly slaughtered bovine tibiae and stored in saline prior to experiment in. Bone water relaxometry: T1 quantification was done at 3T Prisma MR Scanner (Siemens Healthcare, Erlangen, Germany) using 64 channel receive head coil with methods bellow: Inversion recovery (IR): Four different inversion times were used with turboFLASH pulse sequence to acquire four TI images and the signal intensities calculated from images were fit to equation 1 to quantify free water T1 value8.$$S(TI)=S0(1+(k-1)exp(-TI/T1))$$ Eq1.
Where S0 is signal measured for the recovery time and k represents residual fraction of the longitudinal magnetization after RF pulse. Variable flip angles (VFA): three different flip angles were used with VIBE pulse sequence to acquire three FA images and fit the signal intensity to equation 2 to compute T1 value9. $$S(α)/sin(α)=exp(-TR/T1).(S(α)/tan(α))+k$$ Eq2.
Where k is intercept and is a function of TR, T1 and S0. Variable TR (VTR): Two TR values were used with the VIBE pulse sequence to acquire two TR images. By solving equation 3 using “trust-region-dogleg’ algorithm” in MATLAB, T1 values were quantified7.
$$r=((1-exp(-TR1/T1)/1-fz.exp(-TR1/T1))/((1-exp(-TR1/T1)/1-fz.exp(-TR1/T1)).$$ Eq3.
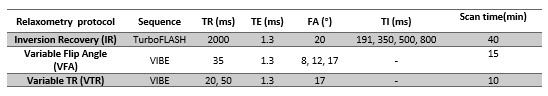
Where fz is a correction parameter for relaxation during RF duration r is signal ratio of short TR to long TR . Table1 shows the relaxometry protocol parameters. Given that the T2* for bound water is 0.27ms10, by choosing the TE value of 1.3 ms, we assumed that the signal from bound water is mostly decayed at the time of acquisition and the quantified T1 values were associated with free water of the cortical bone. SNR was calculated for all images. For each sample, whole cortical bone mean signal intensity was measured with manual segmentation using ImageJ (National Institute of Health, US). All data fitting was done in MATLAB (MathWorks, USA).
Compression mechanical test: Samples were subjected to compression test (SANTAM STM-150, Iran) and mechanical properties (toughness, ultimate stress, yield stress, Young modulus) were calculated.
Results
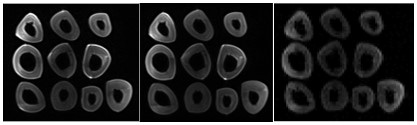
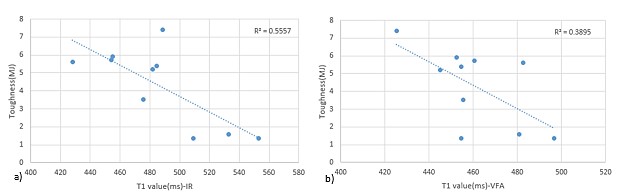
SNR is reported as 37±7, 39±4 and 13 in VFA (FA=17), VTR (TR=50ms) and IR (TI=800ms), respectively (figure1). Inversion recovery is the accurate method for T1 measurement, but due to the long scan time, it is not the optimum method for clinical usage. We measured pore water T1 value of 10 samples with IR as a ground truth method. Mean T1 values calculated by IR, VFA, and VTR were 486±37ms, 471±24ms, and 503±33ms, respectively. Using paired t-test, no significant difference was found between the mean T1 value of each of the other two methods of T1 measurement (VFA and VTR) and IR results (p<0.05).Figure 2 shows a significant Pearson correlation between the T1 value of IR and VFA method and toughness (r=-0.74, p<0.05 and r=-0.63, p<0.01, respectively). The other mentioned mechanical parameters didn’t show significant correlation with T1.Discussion
Bone microstructure is one of the properties that affect its mechanical strength. Since cortical pores dimension is below the in vivo scanners resolution, water molecules residing in these pores could potentially act as a surrogate measure of porosity without the need for high resolution. Relaxometry of cortical pore Water, due to the relaxation rate changes adjacent to pores’ surfaces11, can be informative about porosity. As we expected, the increase in T1 value reflects a decrease in the surface-to-volume ratio of the pores and consequently the reduction of bone resistance to fracture (toughness). Our study showed that in comparison to the gold standard method (IR) and according to the validation of the T1 results with mechanical properties, VFA could be a reliable method of pore water T1 quantification in cortical bone. Although VTR T1 didn’t have a significant difference with VFA T1, it was only VFA T1 that correlated with the mechanical property of cortical bone.conclusion
Cortical bone free water T1correlates with cortical bone toughness. The VFA method is more accurate than VTR method for quantification of cortical bone free water T1.Acknowledgements
No acknowledgement found.References
1.Ramchand SK, Seeman E. The influence of cortical porosity on the strength of bone during growth and advancing age. Current osteoporosis reports. 2018 Oct 1;16(5):561-72.
2.Du J. Imaging bone water compartments. InInternational Society of Magnetic Resonance in Medicine 2013 (Vol. 21).
3.Manhard MK, Nyman JS, Does MD. Advances in imaging approaches to fracture risk evaluation. Translational Research. 2017 Mar 1;181:1-4.
4.Nyman JS, Ni Q, Nicolella DP, et al. Measurements of mobile and bound water by nuclear magnetic resonance correlate with mechanical properties of bone. Bone. 2008;42(1):193-9.
5.Manhard MK, Uppuganti S, Granke M, et al. MRI-derived bound and pore water concentrations as predictors of fracture resistance. Bone. 2016;87:1-10.
6.Horch RA, Gochberg DF, Nyman JS, et al. Non-invasive predictors of human cortical bone mechanical properties: T 2-discriminated 1 H NMR compared with high resolution X-ray. PloS one. 2011;6(1):e16359.
7.Akbari A, Abbasi-Rad S, Rad HS. T1 correlates age: A short-TE MR relaxometry study in vivo on human cortical bone free water at 1.5T. Bone. 2016;83:17-22.
8.Techawiboonwong A, Song HK, Leonard MB, et al. Cortical bone water: in vivo quantification with ultrashort echo-time MR imaging. Radiology. 2008;248(3):824-33.
9. Fram EK, Herfkens RJ, Johnson GA, et al. Rapid calculation of T1 using variable flip angle gradient refocused imaging. Magnetic resonance imaging. 1987;5(3):201-8.
10.Li S, Chang EY, Bae WC, et al. Ultrashort echo time bi‐component analysis of cortical bone—a field dependence study. Magnetic resonance in medicine. 2014 Mar;71(3):1075-81
11.Fantazzini P, Brown RJ,
Borgia GC. Bone tissue and porous media: common features and differences
studied by NMR relaxation. Magnetic resonance imaging. 2003 Apr
1;21(3-4):227-34.
Figures