Jessica Bugeja1,2, Ales Neubert1,2, Shekhar Chandra1, Jurgen Fripp2, Craig Engstrom1, and Stuart Crozier1
1University of Queensland, Brisbane, Australia, 2CSIRO, Brisbane, Australia
Synopsis
QMRI sequences including T2
and T2* mapping analyse biochemical changes of
cartilage including the deterioration of the ECM and changes in water content
for early diagnosis of hip OA prior to serious cartilage degradation.
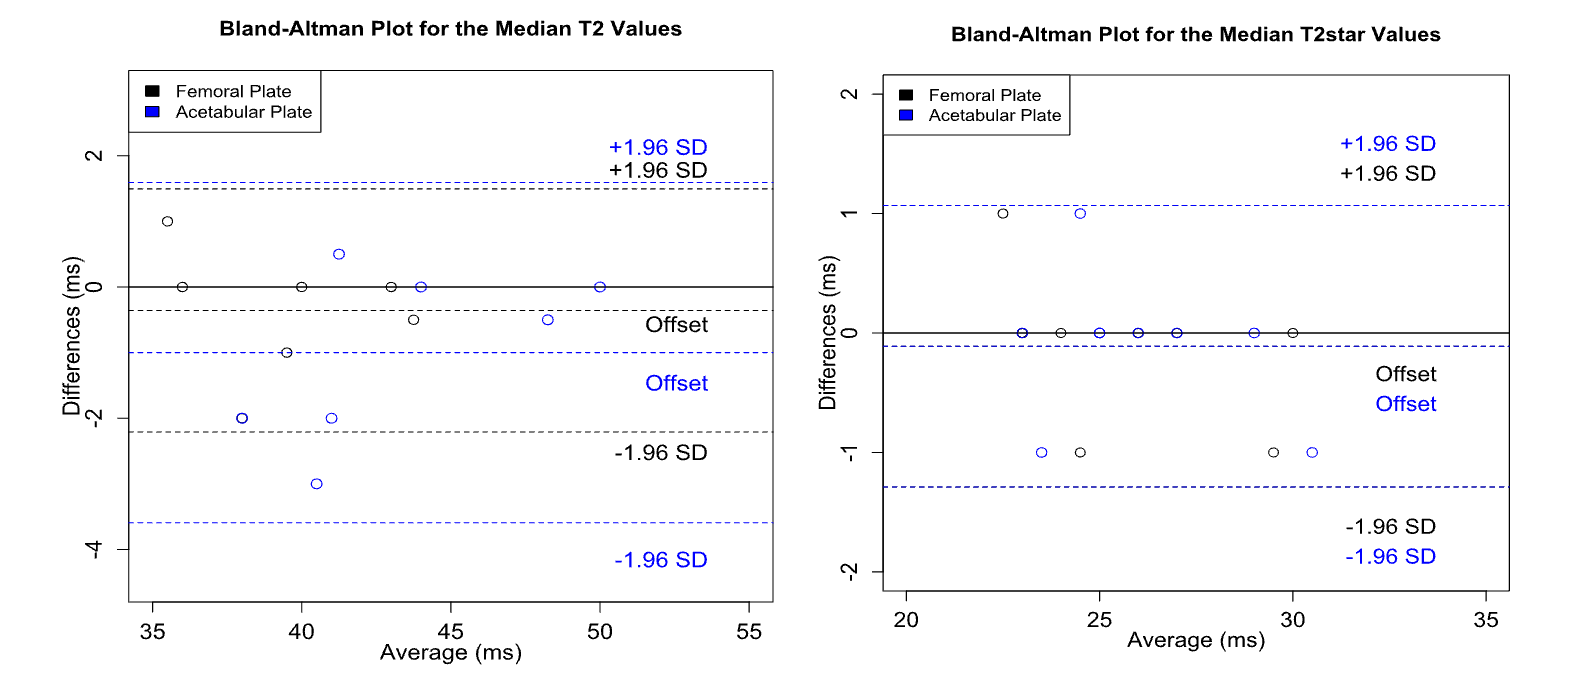
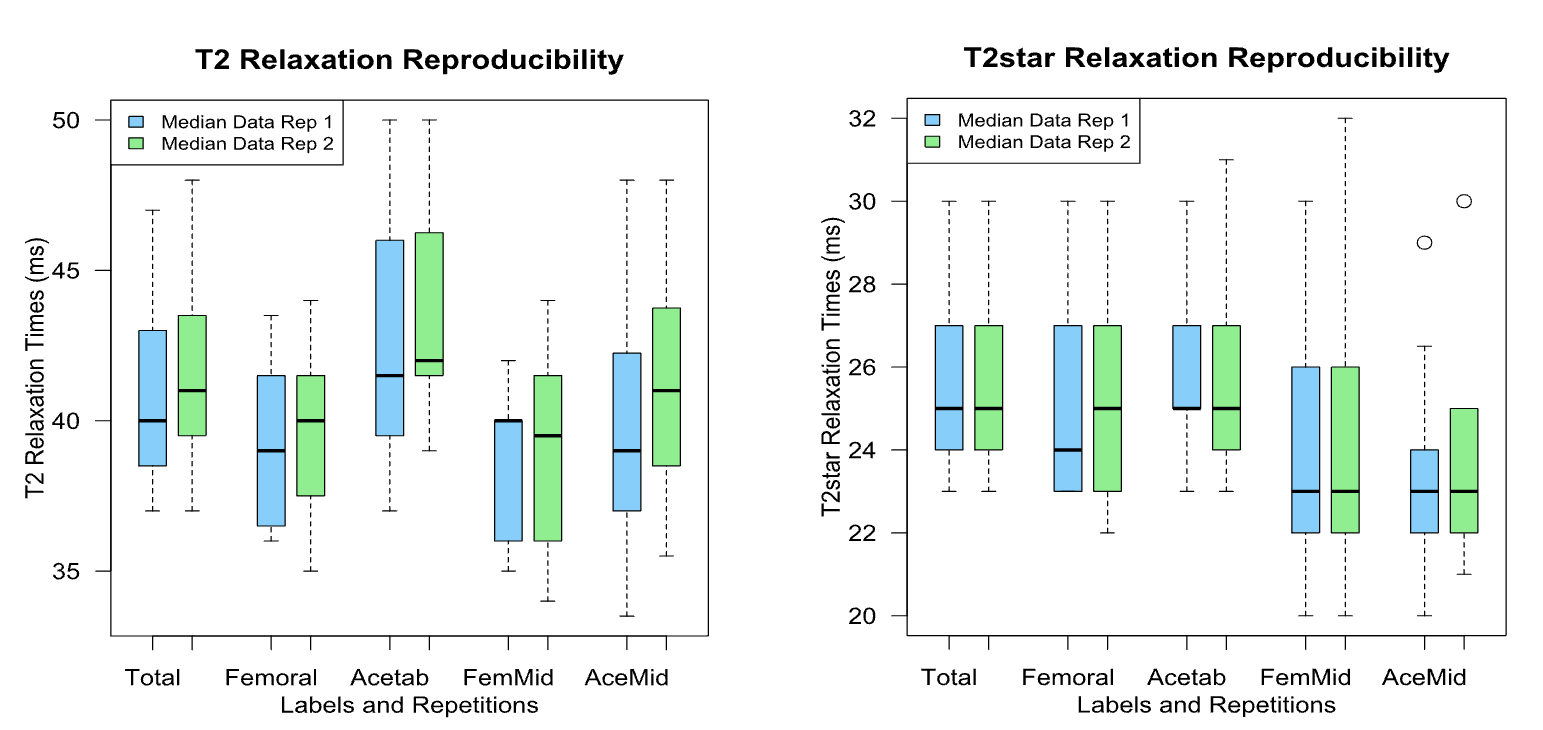
Longitudinal studies and clinical assessments with T2 and T2* mapping rely on a high reproducibility of the
tissue relaxation times for accurate diagnosis. We present a statistical
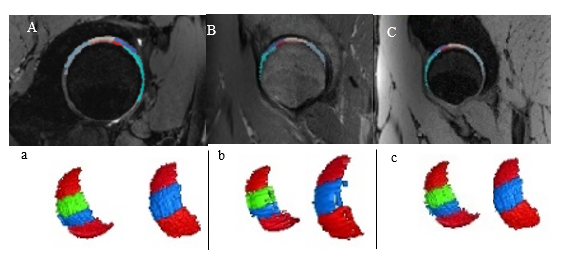
analysis of the reproducibility of T2 and T2* mapping of hip MR images. An automated
cartilage segmentation method is used for the segmentation of FISP MR hip
images and biochemical information is obtained from the T2 and T2* images.
Acknowledgements
References
[1] S. S.
Chandra, Y. Xia, C. Engstrom, S. Crozier, R. Schwarz, and J. Fripp,
"Focused shape models for hip joint segmentation in 3D magnetic resonance
images," Medical Image Analysis, Journal Article vol. 18, no. 3, p.
12, 2014.
[2] R. K. Surowiec, E. P. Lucas, K. J. Wilson, A. J. Saroki, and C. P.
Ho, "Clinically Relevant Subregions of Articular Cartilage of the Hip for
Analysis and Reporting Quantitative Magnetic Resonance Imaging: A Technical
Note," Cartilage, vol. 5, no. 1, pp. 11-15, 2014.