2756
Feasibility of UTE T2* cartilage mapping in the sacroiliac joints1Columbia University Medical Center, New York, NY, United States
Synopsis
Ultrashort echo time (UTE) T2* images of 20 sacroiliac joints were acquired in 10 asymptomatic volunteers. Each sacroiliac (SI) joint was segmented manually and divided into thirds (superior, middle, and inferior). Differences in mean UTE T2* values were assessed. Results demonstrated a mean UTE T2* value of 10.38 ± 0.62 ms in the SI joints. There was no statistical significance between right and left sides (p = 0.89), superior, middle, and inferior third regions (p = 0.86), or males and females (p = 0.47). Intra-observer variability with ICC ranged from 0.89-0.98.
Introduction
Sacroiliitis is a common manifestation of inflammatory arthropathy. MR assessment has mostly been limited to evaluation of changes in the subchondral bone and entheses. Quantitative assessment of sacroiliac joint cartilage may increase sensitivity for diagnosis and facilitate early administration of therapeutic agents. It may also be helpful in assessing response to treatment in future trials. Identification of early cartilage degeneration requires use of quantitative techniques that are sensitive to biochemical changes in the cartilage matrix. Many of these techniques exist with feasibility of T2 mapping having been demonstrated previously 1,2. UTE T2* mapping has the potential advantage of being sensitive to early degeneration in the deep layer of cartilage, though its application to the sacroiliac joints has been limited so far 3.Methods
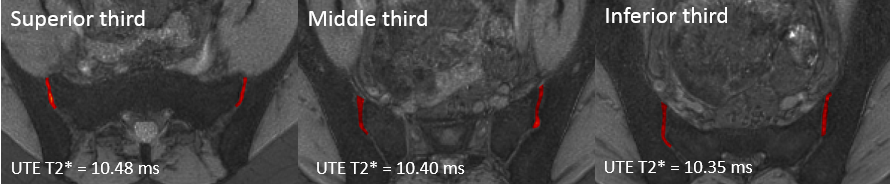
This study was performed on a 3T 70 cm bore MR scanner (Discovery MR750w, GE Healthcare, USA) using a GE Signa MRI 32 channel General Matrix Coil. Images of 20 sacroiliac joints were acquired in 10 asymptomatic volunteers who had no history of active back pain or inflammatory arthropathy (5:5 female: male, mean age 26.3 ± 0.9 years). We collected the following sequences in the axial plane: proton density (PD) with the following parameters: 22 cm FOV, 3 mm slice thickness, 3770 ms TR, 33 ms TE, 50kHz bandwidth, and a matrix of 320 x 320 with a total scan time of 2:50 per scan; T1 3D SPGR DIXON with the following parameters: 24 cm FOV, 3 mm slice thickness, 4.7 ms TR, 1.9 ms TE, 166kHz bandwidth, and a matrix of 160 x 160 with a total scan time of 1:01 per scan; UTE T2* with the following parameters: seven echo times (0.0, 1, 3.3, 4.7, 7.2, 9, and 12 ms), 22 cm FOV, 2 mm slice thickness, 22.5 ms TR, 125kHz bandwidth, 240 x 240 matrix, and flip angle of 9 degrees for a total scan time of 5:00 per acquisition. The UTE T2* fitting was performed using a non-negative least squares NNLS algorithm implemented in NiftyFit toolkit 4.UTE T2* maps were segmented on ITK-SNAP 5. The cartilage on the sacral and iliac sides were analyzed together. All slices containing cartilage were segmented into a volume. The cartilage was divided into superior, middle, and inferior thirds based on the coronal plane (Fig. 1). Anatomic PD images were assessed to ensure accurate segmentation. SPGR images were used to assess for morphologic cartilage abnormalities.
Quantitative UTE T2* values in different cartilage regions were assessed with independent measures ANOVA and t-test with significance set at p < 0.05. Intraclass correlation coefficient (ICC) was used for intra-observer reliability.
Results
All of the volunteers had morphologically normal cartilage with no defects and no subchondral abnormalities on the SPGR images. The average number of voxels included in analysis for each SI joint was 1013. The mean UTE T2* value for the SI joint was 10.38 ± 0.62 ms. There was no significant difference between right and left sides (10.36 vs. 10.40 ms) (p = 0.89). There was no significant difference between the superior (10.48 ms), middle (10.40 ms), and inferior (10.35 ms) third regions within each joint (p = 0.86). There was no significant difference between male and female volunteers (10.19 vs. 10.56 ms) (p=0.47). ICCs for intra-observer variability were (ICC, 95% CI): superior (0.89, 0.73-0.96), middle (0.98, 0.94-0.99), and lower (0.98, 0.95-0.99).Discussion
Our results demonstrate feasibility of UTE T2* cartilage mapping in the sacroiliac joints. We found no difference in the UTE T2* values based on side, region of the joint, or sex. Our UTE T2* values were lower than what has been reported for other joints elsewhere in the body such as the knee. This may reflect subclinical changes in the cartilage matrix because of a difference in biomechanical stress. Alternatively, although the volumetric analysis of ROIs may have minimized their effects, it is likely there was some volume averaging due to the thin nature of the cartilage and gas from vacuum phenomenon that was included in the analysis. As the next step, we plan to evaluate the SI joint cartilage in asymptomatic patients of different ages to see whether there are age-related changes. We will then evaluate patients with inflammatory arthropathy.Conclusion
UTE T2* cartilage mapping in the sacroiliac joints is feasible with a mean value of 10.38 ± 0.62 ms and no significant difference across sides, regions of the joint, or sex. We provide initial data with established baseline values that can be used as a reference for future studies.Acknowledgements
NoneReferences
1. Albano D, Chianca V, Cuocolo R, Bignone R, Ciccia F, Sconfienza LM, et al. T2-mapping of the sacroiliac joints at 1.5 Tesla: a feasibility and reproducibility study. Skeletal Radiol. 2018 Dec;47(12):1691–6.
2. Lefebvre G, Bergère A, Rafei ME, Duhamel A, Teixeira P, Cotten A. T2 Mapping of the Sacroiliac Joints With 3-T MRI: A Preliminary Study. AJR Am J Roentgenol. 2017 Aug;209(2):389–94.
3. Williams A, Qian Y, Bear D, Chu CR. Assessing degeneration of human articular cartilage with ultra-short echo time (UTE) T2* mapping. Osteoarthr Cartil. 2010 Apr;18(4):539–46.
4. Melbourne A, Toussaint N, Owen D, Simpson I, Anthopoulos T, De Vita E, et al. NiftyFit: a Software Package for Multi-parametric Model-Fitting of 4D Magnetic Resonance Imaging Data. Neuroinformatics. 2016;14(3):319–37.
5. Yushkevich PA, Piven J, Hazlett HC, Smith RG, Ho S, Gee JC, et al. User-guided 3D active contour segmentation of anatomical structures: significantly improved efficiency and reliability. Neuroimage. 2006 Jul 1;31(3):1116–28.
Figures