2755
Bias and correction method of UTE trajectory errors in the depiction and relaxometry of deep articular cartilage1Department of Diagnostic and Interventional Radiology, Technical University of Munich, School of Medicine, Munich, Germany, 2Philips Research Laboratory, Hamburg, Germany, 3Department of Radiology and Biomedical Imaging, University of California, San Francisco, CA, United States
Synopsis
Imaging of the morphological and biochemical composition of the deep articular cartilage has important implications in the assessment of osteoarthritis. The deep cartilage layer has intrinsically short T2* characteristics and ultra-short echo time (UTE) imaging techniques have been recently employed in the depiction of the deep cartilage layer morphology. UTE imaging is known to be affected by k-space trajectory errors. The purpose of the present work is to investigate the effect of trajectory errors in UTE imaging used for the depiction and relaxometry of deep articular knee cartilage. A GIRF-correction is applied to correct eddy-currents induced k-space trajectory errors.
Purpose
MRI is well suited for imaging both the morphological and biochemical information of the knee articular cartilage1. Deep articular cartilage remains difficult to image, however its potential implications in the pathogenesis of osteoarthritis makes it an interesting application. Due to its high mineral content, the deep cartilage layer has intrinsically short T2* characteristics with estimated T2* values of approximately 1-3.3ms at 3T2. Ultra-short echo time (UTE) imaging techniques have recently been employed in the depiction of the deep cartilage layer morphology and T2* relaxometry has been employed in the early detection of osteoarthritis and also in following longitudinal changes that accompany repair procedures3-6. However, UTE imaging is known to be affected by k-space trajectory errors7, which can become prominent especially when imaging small structures like the thin deep cartilage layer. Recent work has proposed to reduce trajectory-induced blurring effects in high-resolution musculoskeletal UTE imaging8, based on the gradient impulse response function (GIRF)9 measured using a thin slice method10,11. The purpose of the present work is to investigate the effects of trajectory errors in UTE imaging used for the depiction and relaxometry of deep articular knee cartilage and to apply the GIRF for correcting the effects of trajectory errors in deep articular knee cartilage UTE imaging.Methods
In vivo measurements3D-UTE measurements were performed with a stack-of-stars center-out radial acquisition and phase-encoding in the third cartesian dimension on a 3T system (Ingenia Elition X, Philips Healthcare, Best, The Netherlands). All scans were SENSE accelerated in the cartesian dimension with R=2. After the excitation, the FID readout started after a variable delay dTE. All TEs along one spoke were acquired in random order and before the readout of the next spoke. The sequence was evaluated in fat phantoms with varying PDFF of 0%, 5%, 15% and 100%. Accurate PDFF estimation was achieved with the proposed acquisition strategy. High-resolution sagittal knee scans of two healthy volunteers were acquired with 6 TEs=[0.538ms, 0.738ms, 0.938ms, 1.138ms, 4.138ms, 6.138ms], voxel-size 0.5x0.5x3mm3, flip-angle 15°, TR 13ms and a scan time of 22.3min. As a reference scan a cartesian fat-suppressed image with identical FOV and resolution at TE 2.26ms and TR=13ms was acquired.
Reconstruction and postprocessing
The UTE k-space trajectory was corrected by means of a gradient impulse response function using the thin-slice method8,11. The default reconstruction of the manufacturer, nominal-correction method, was based on a simple low-pass model of the gradient chain that is equal for all gradient axes. T2* values were estimated in the deep cartilage by assuming a mono-exponential T2*-decay and by only using the first four echoes.
Results
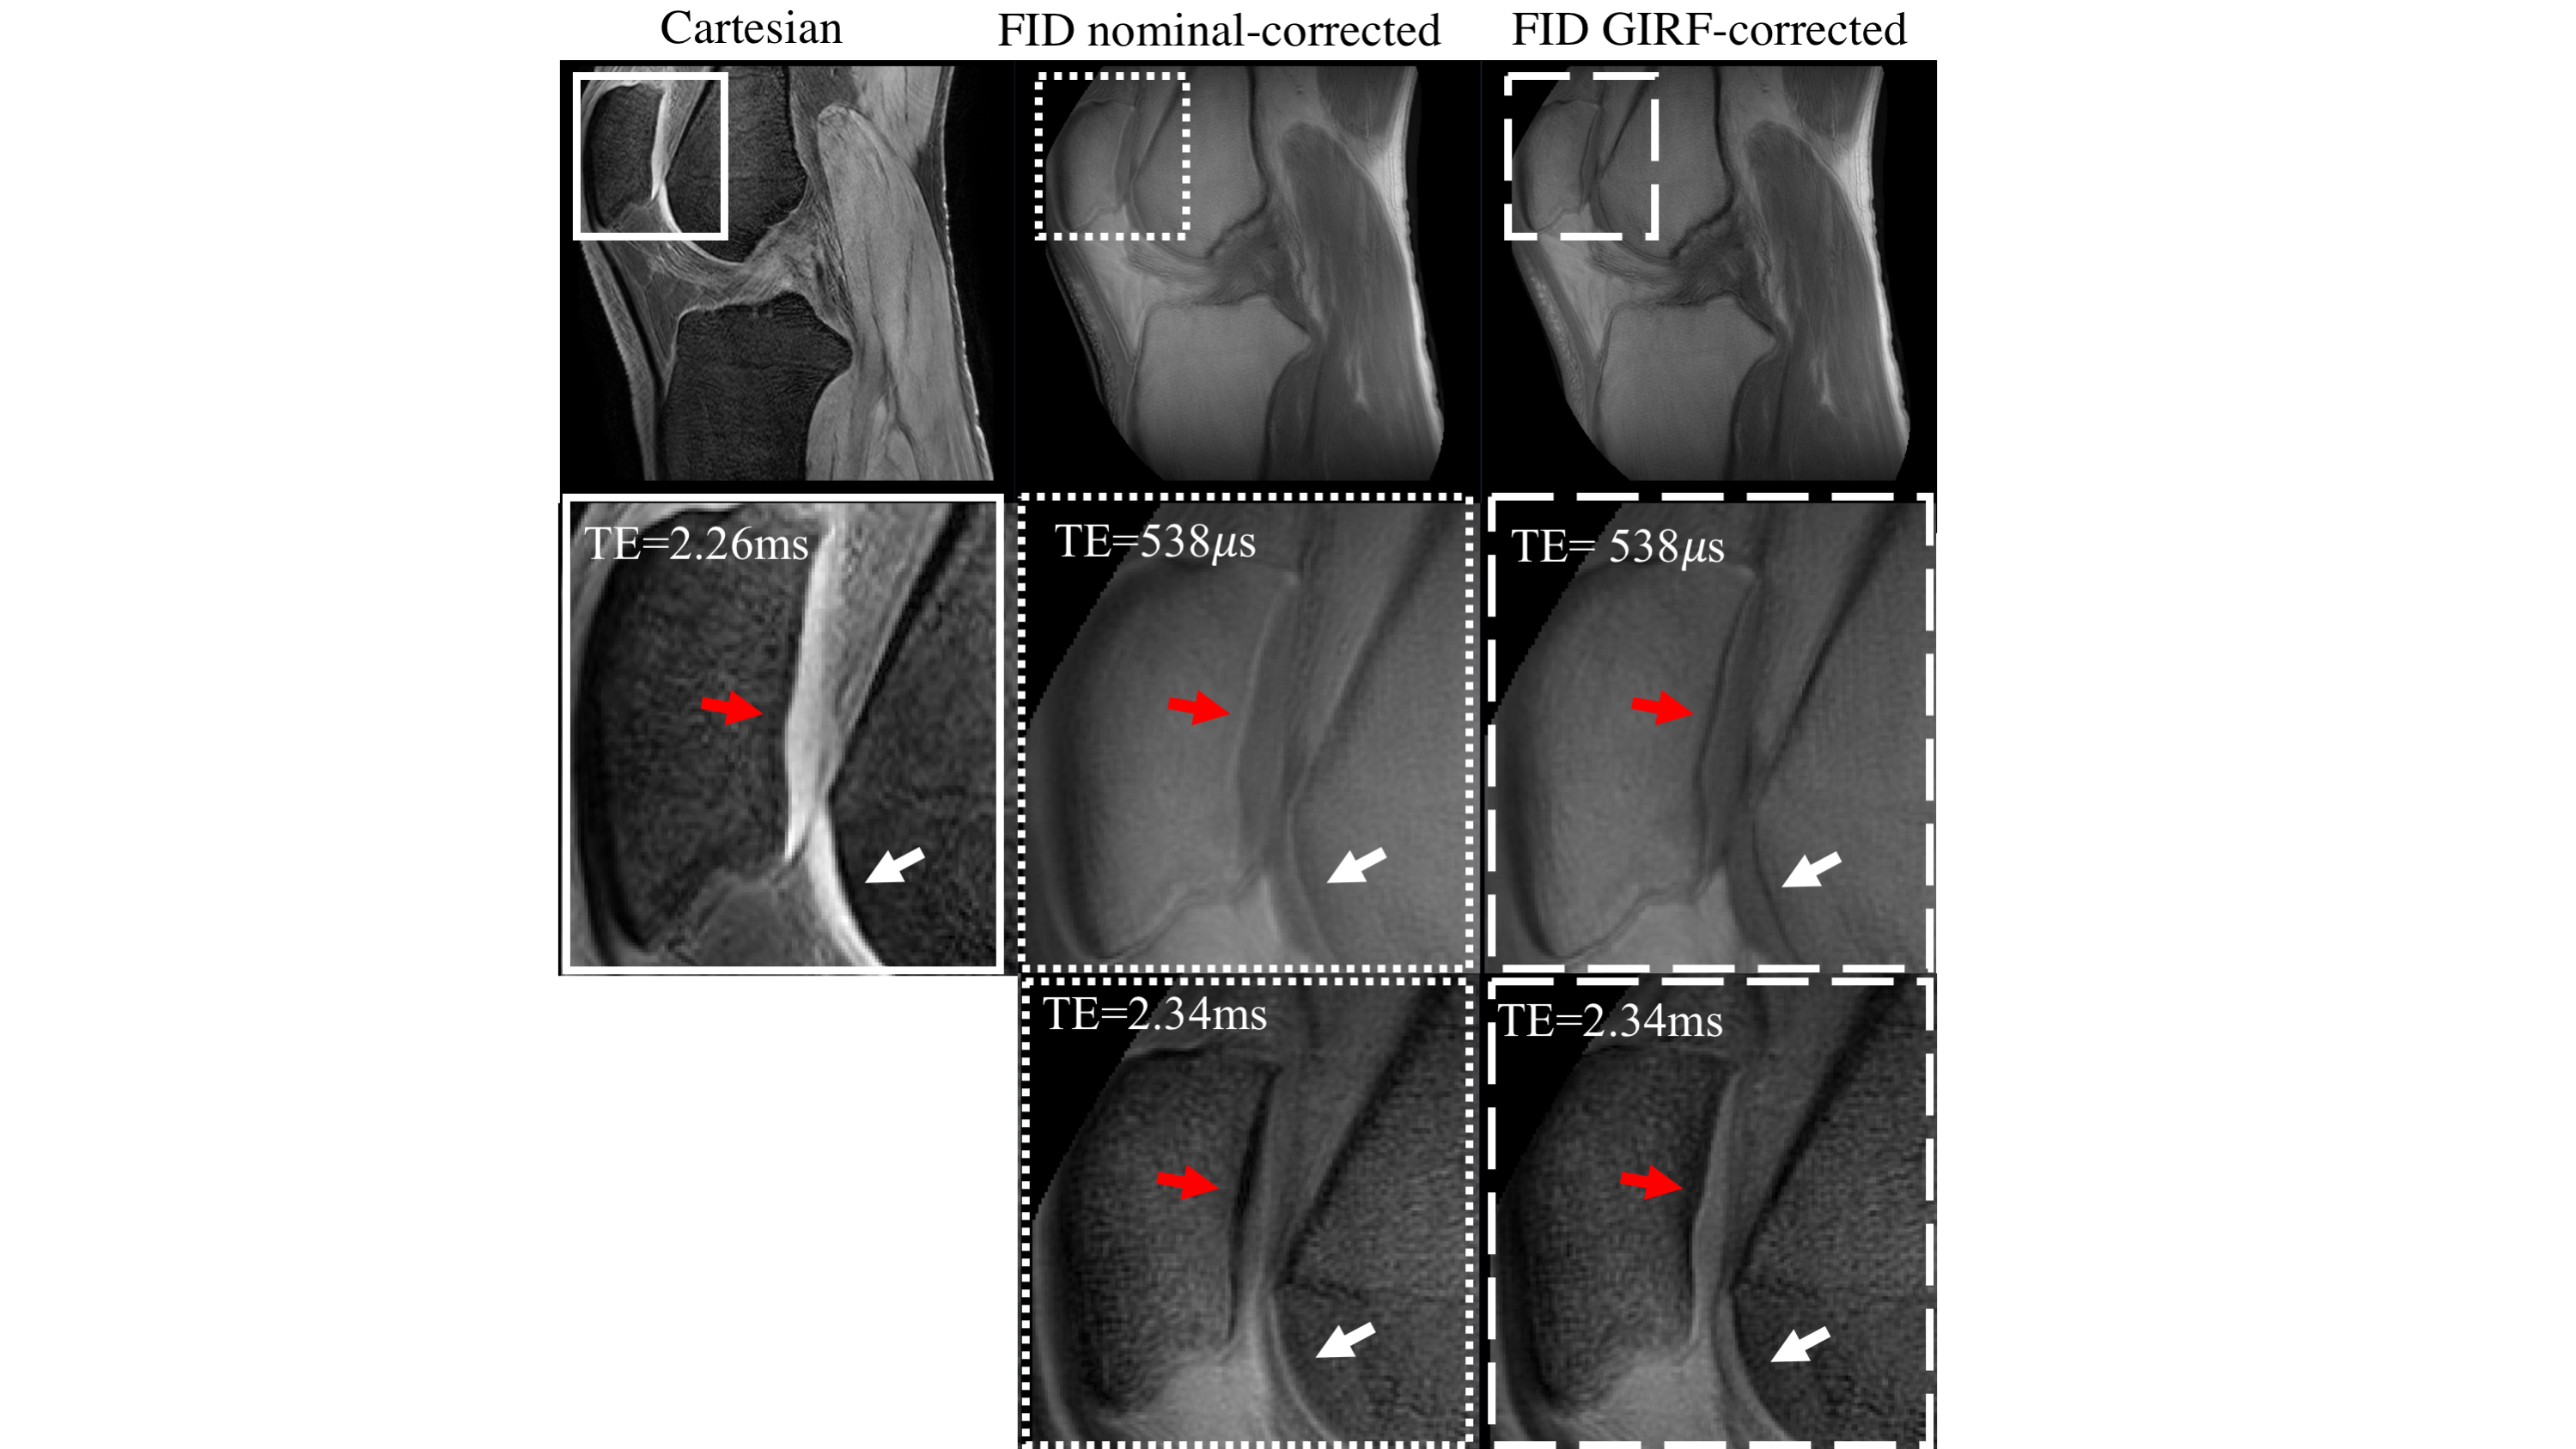
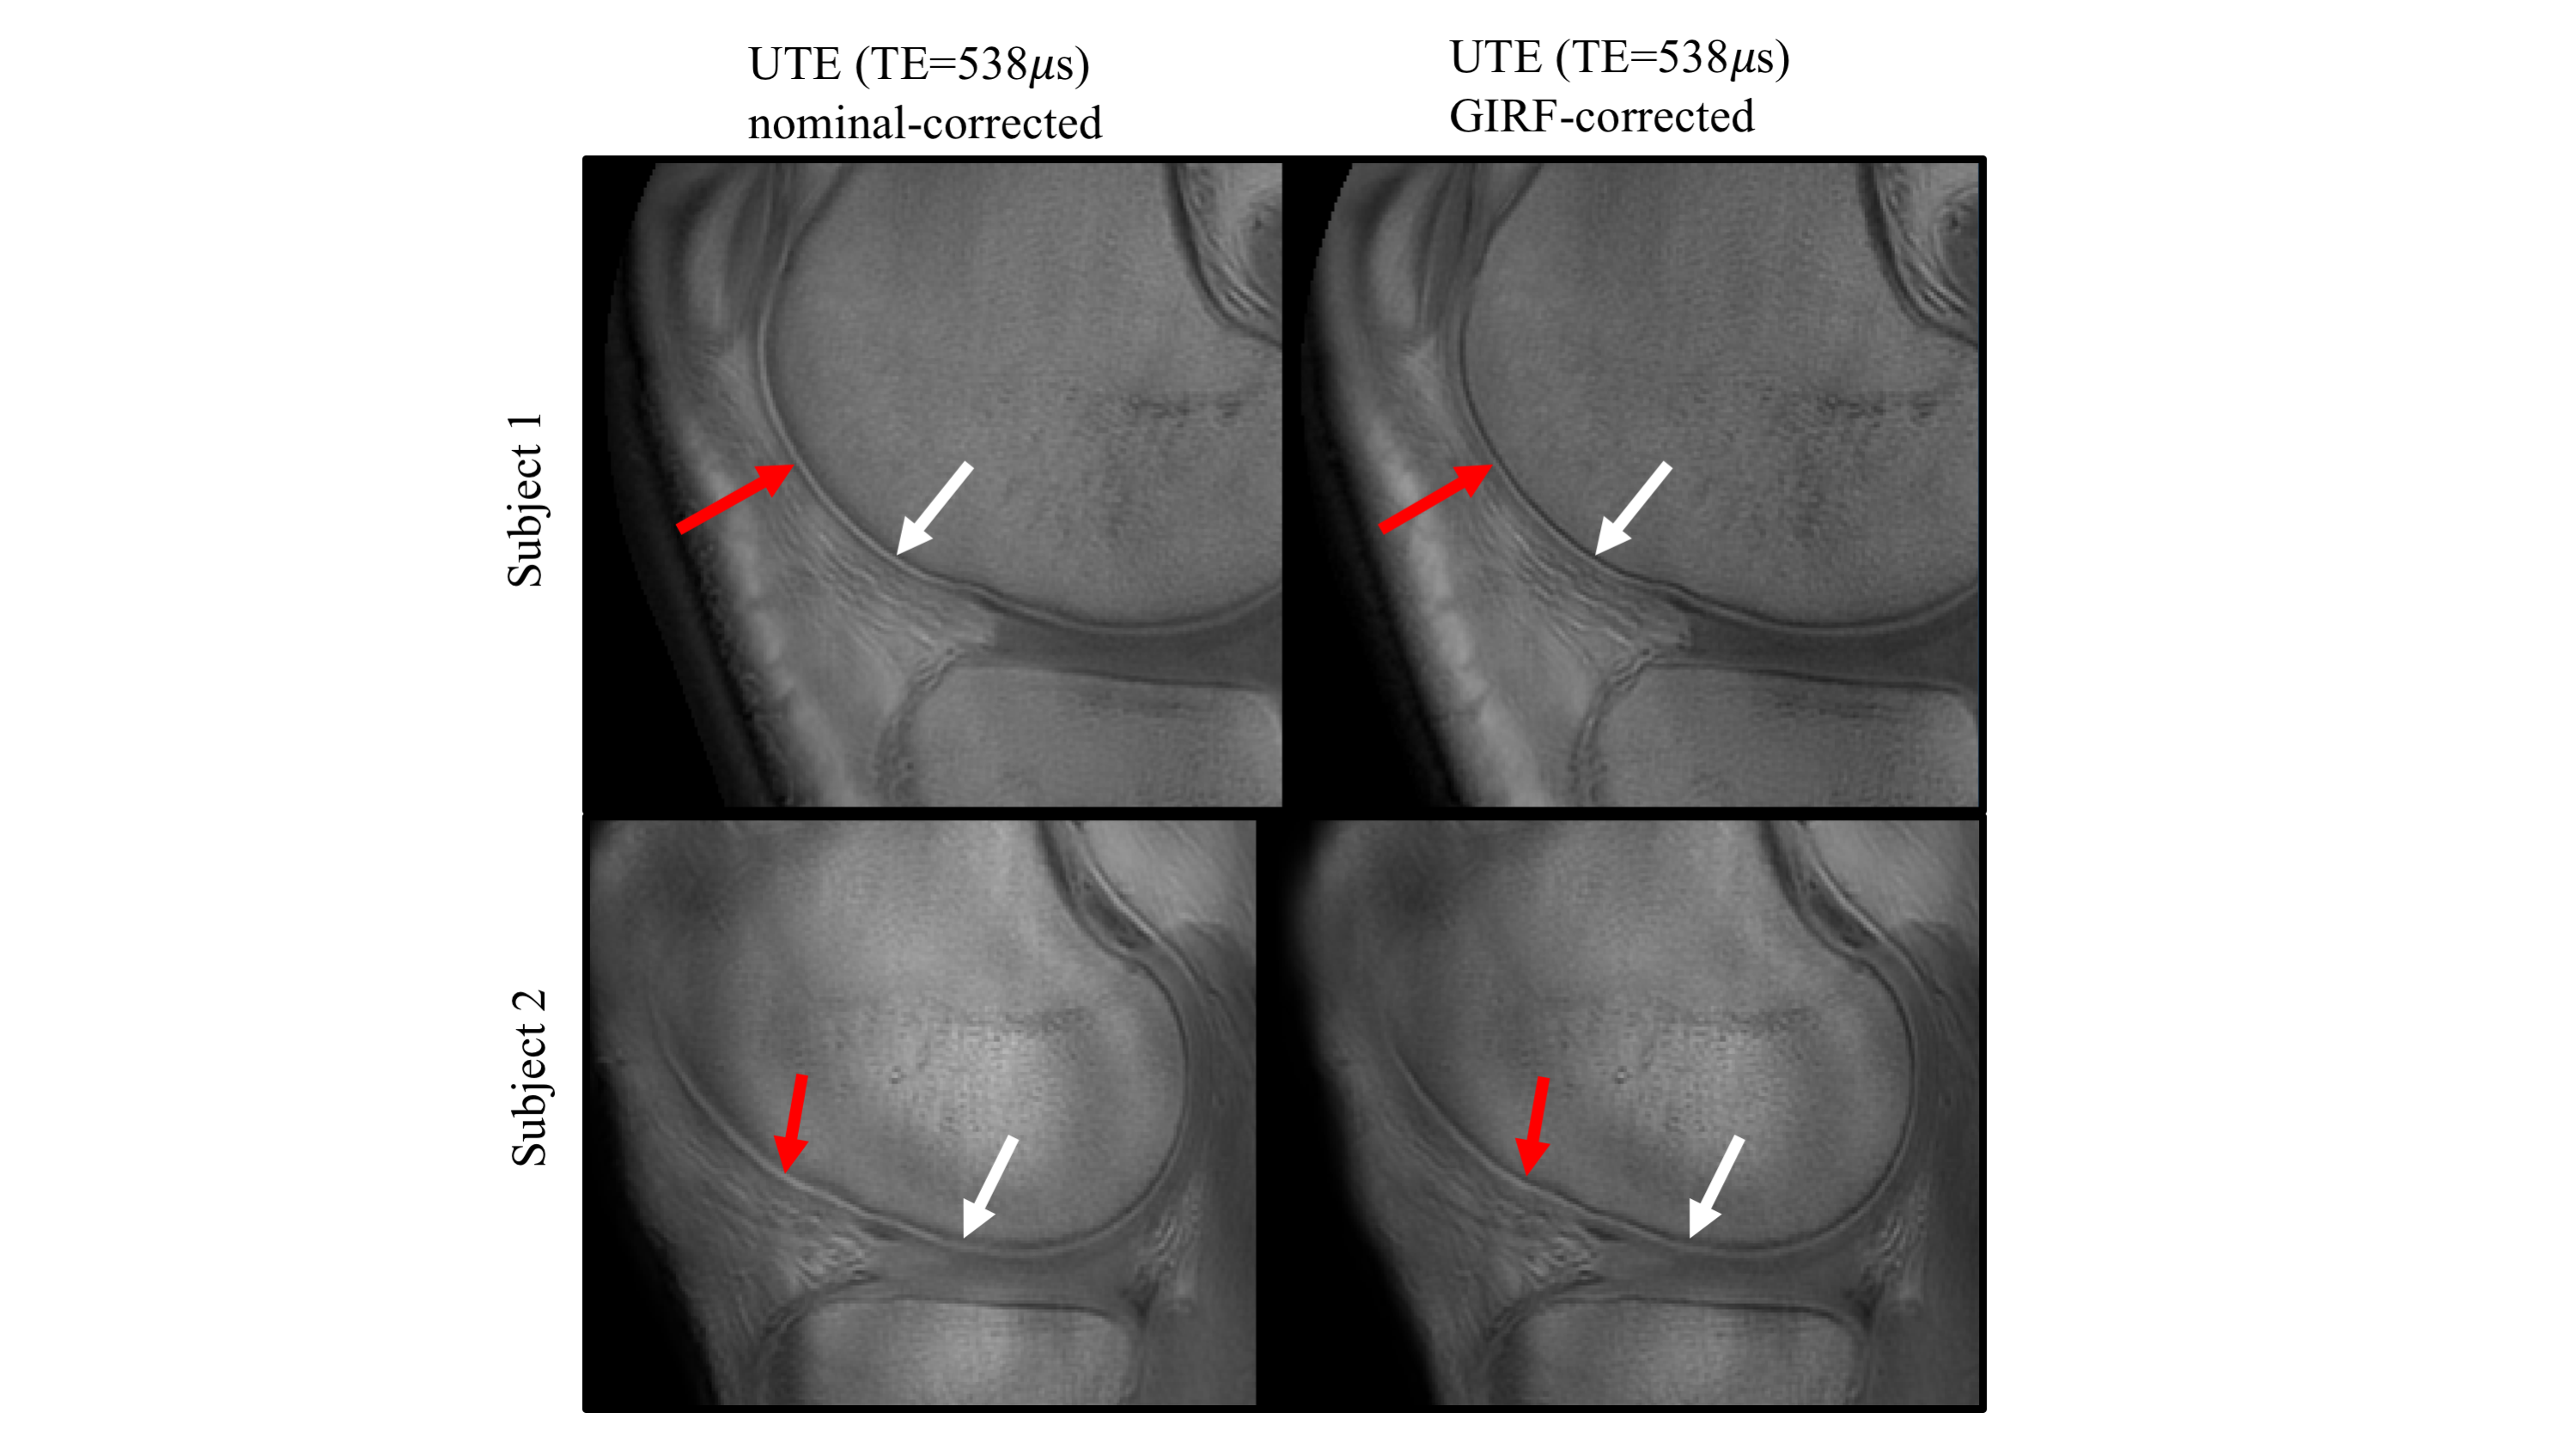
Figure 1 shows the artifact reduction in high-resolution knee imaging when using either the nominal- or the GIRF-correction method. The patellar cartilage was most visible in the GIRF-corrected images for both the UTE at TE=0.538ms and the TE at 2.34ms.Figure 2 depicts the deep articular cartilage of the knee joint of two healthy volunteers. In GIRF-corrected images cortical bone appeared sharper with a higher contrast compared to the nominal-corrected images. In the nominal-corrected images, the deep articular cartilage appeared exaggerated and blurred.
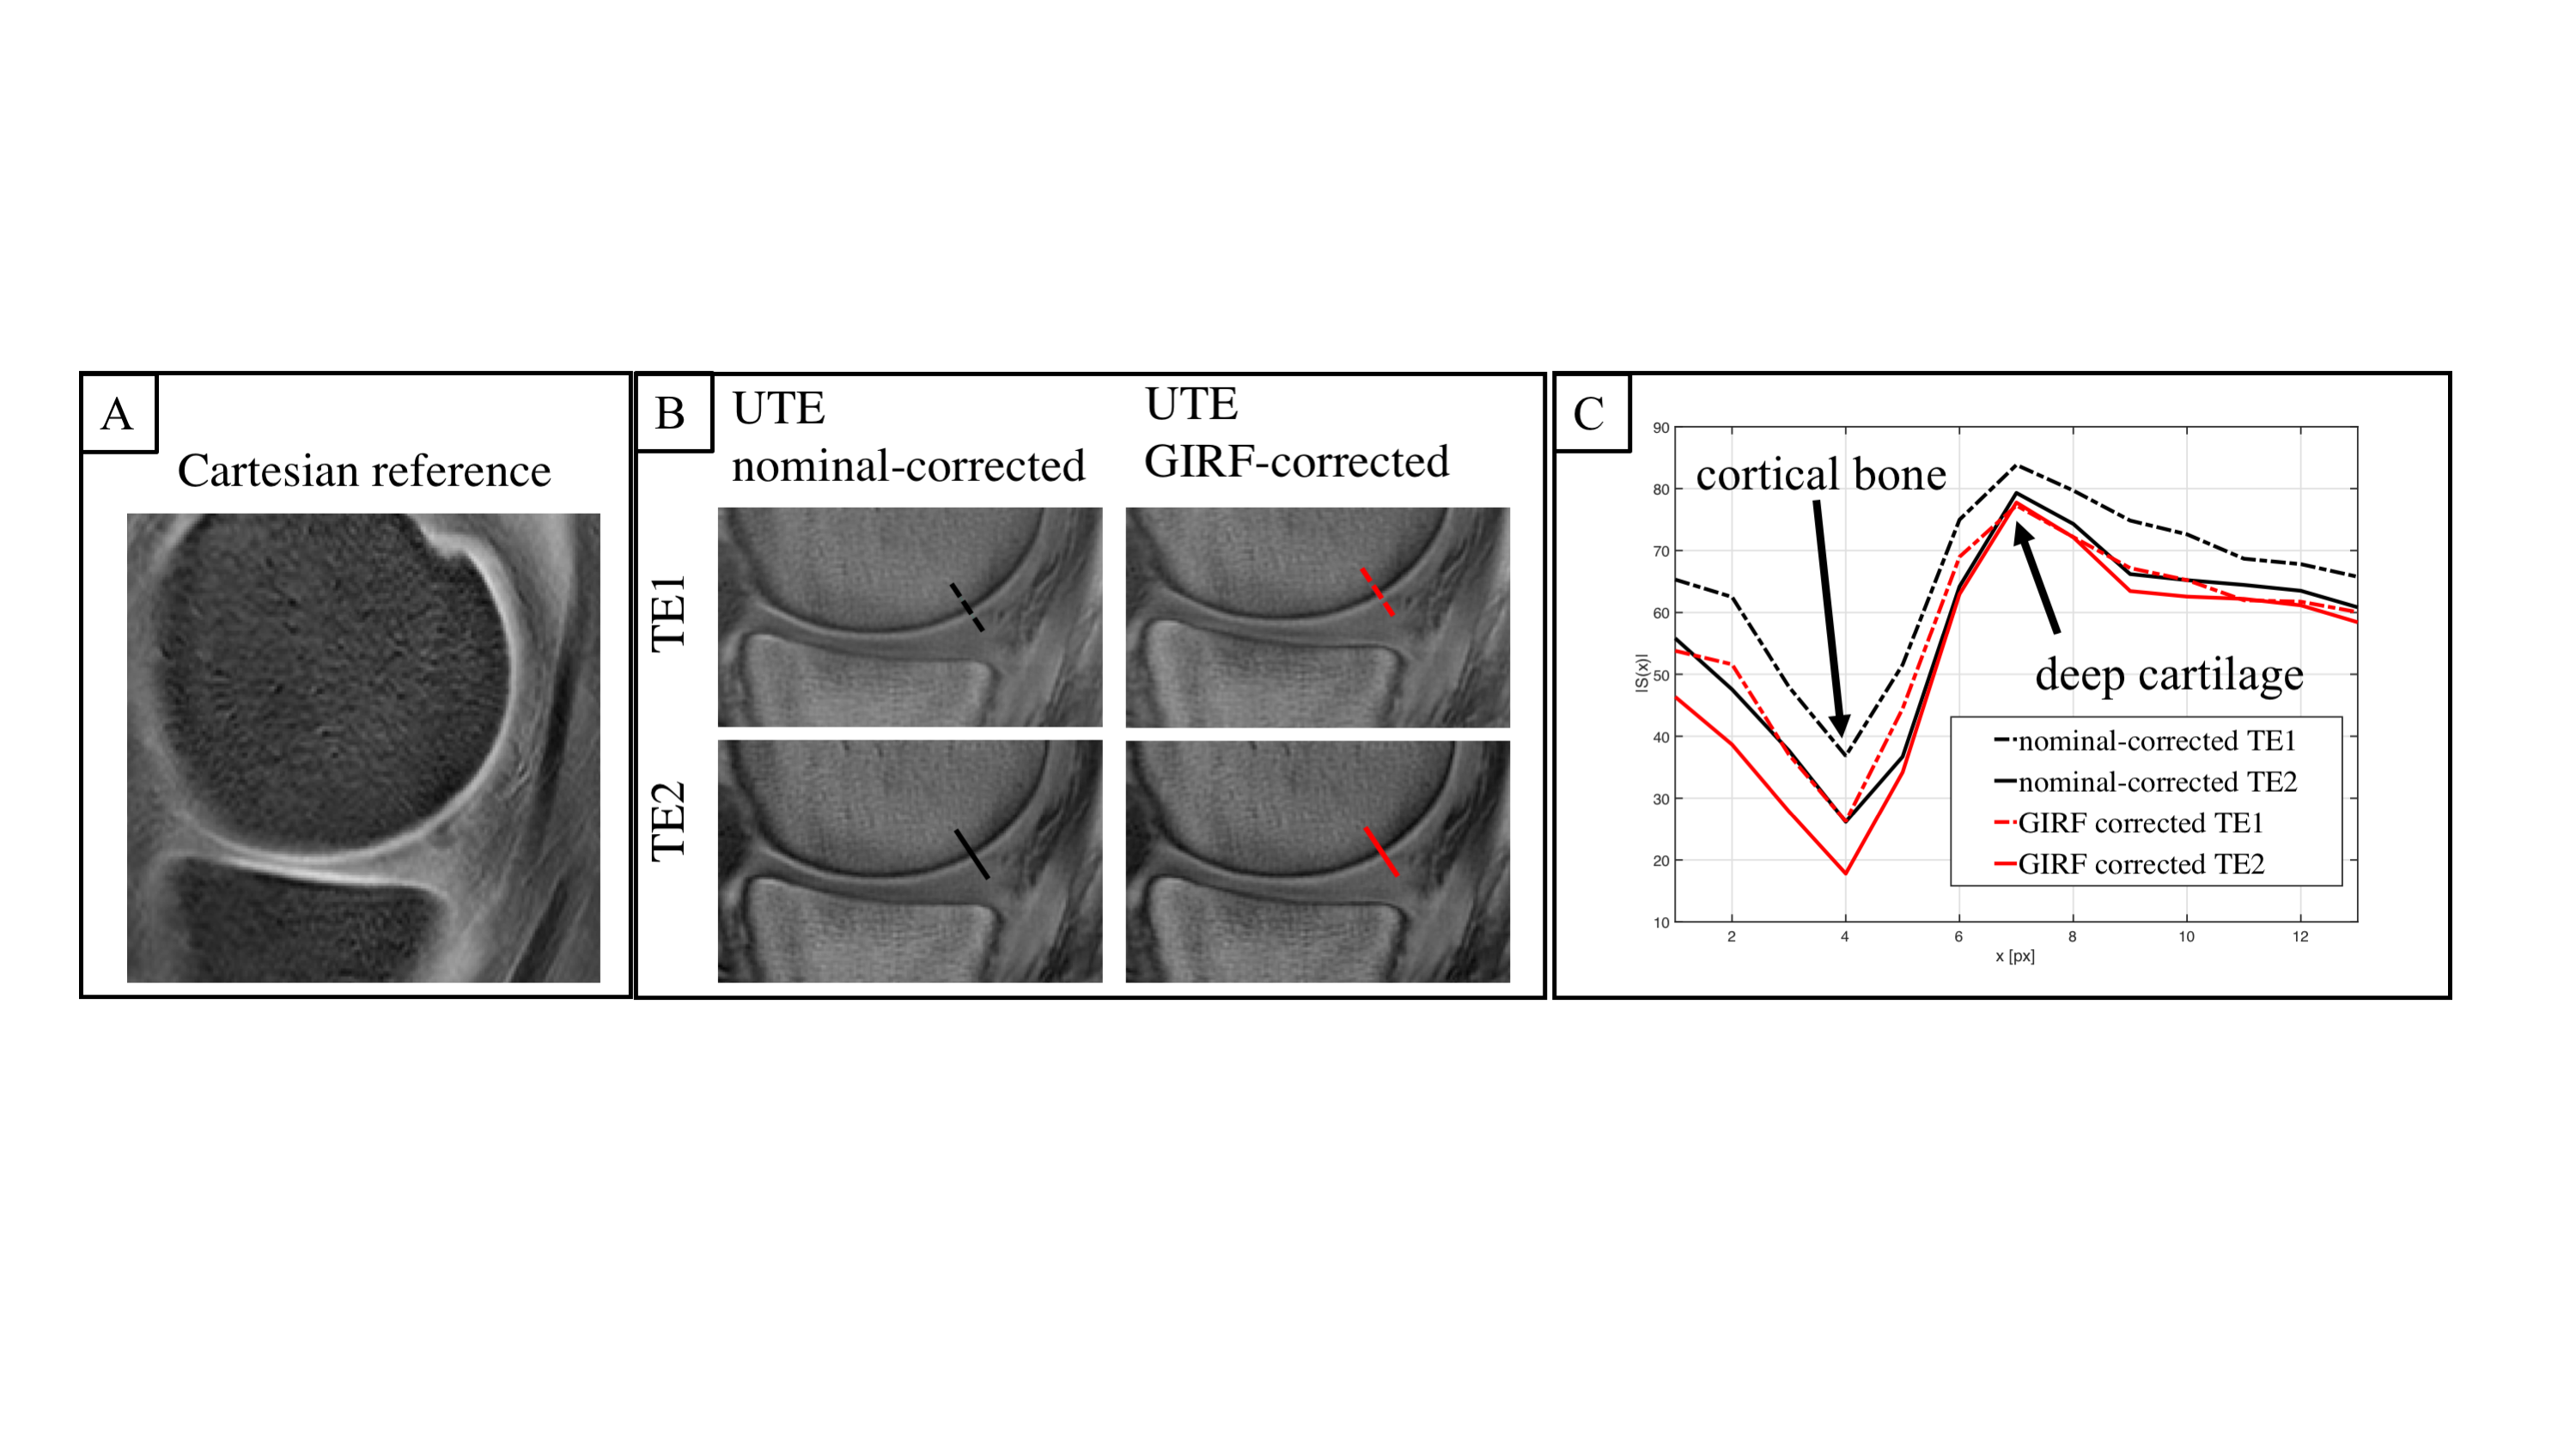
Figure 3 compares the nominal-corrected and GIRF-corrected image of a knee joint for two different TEs (TE1=0.738ms, TE2=0.938ms). As expected, the cortical bone signal decayed quickly. The line profile along a cut perpendicular to the cortical bone shows the observed blurring of thin cortical bone in the nominal-corrected images. Furthermore, the line profile depicts a similarly fast decay in the deep cartilage as in the cortical bone for the nominal-corrected images. In the GIRF-corrected images, a slower decay in the deep cartilage than in the cortical bone was observed.
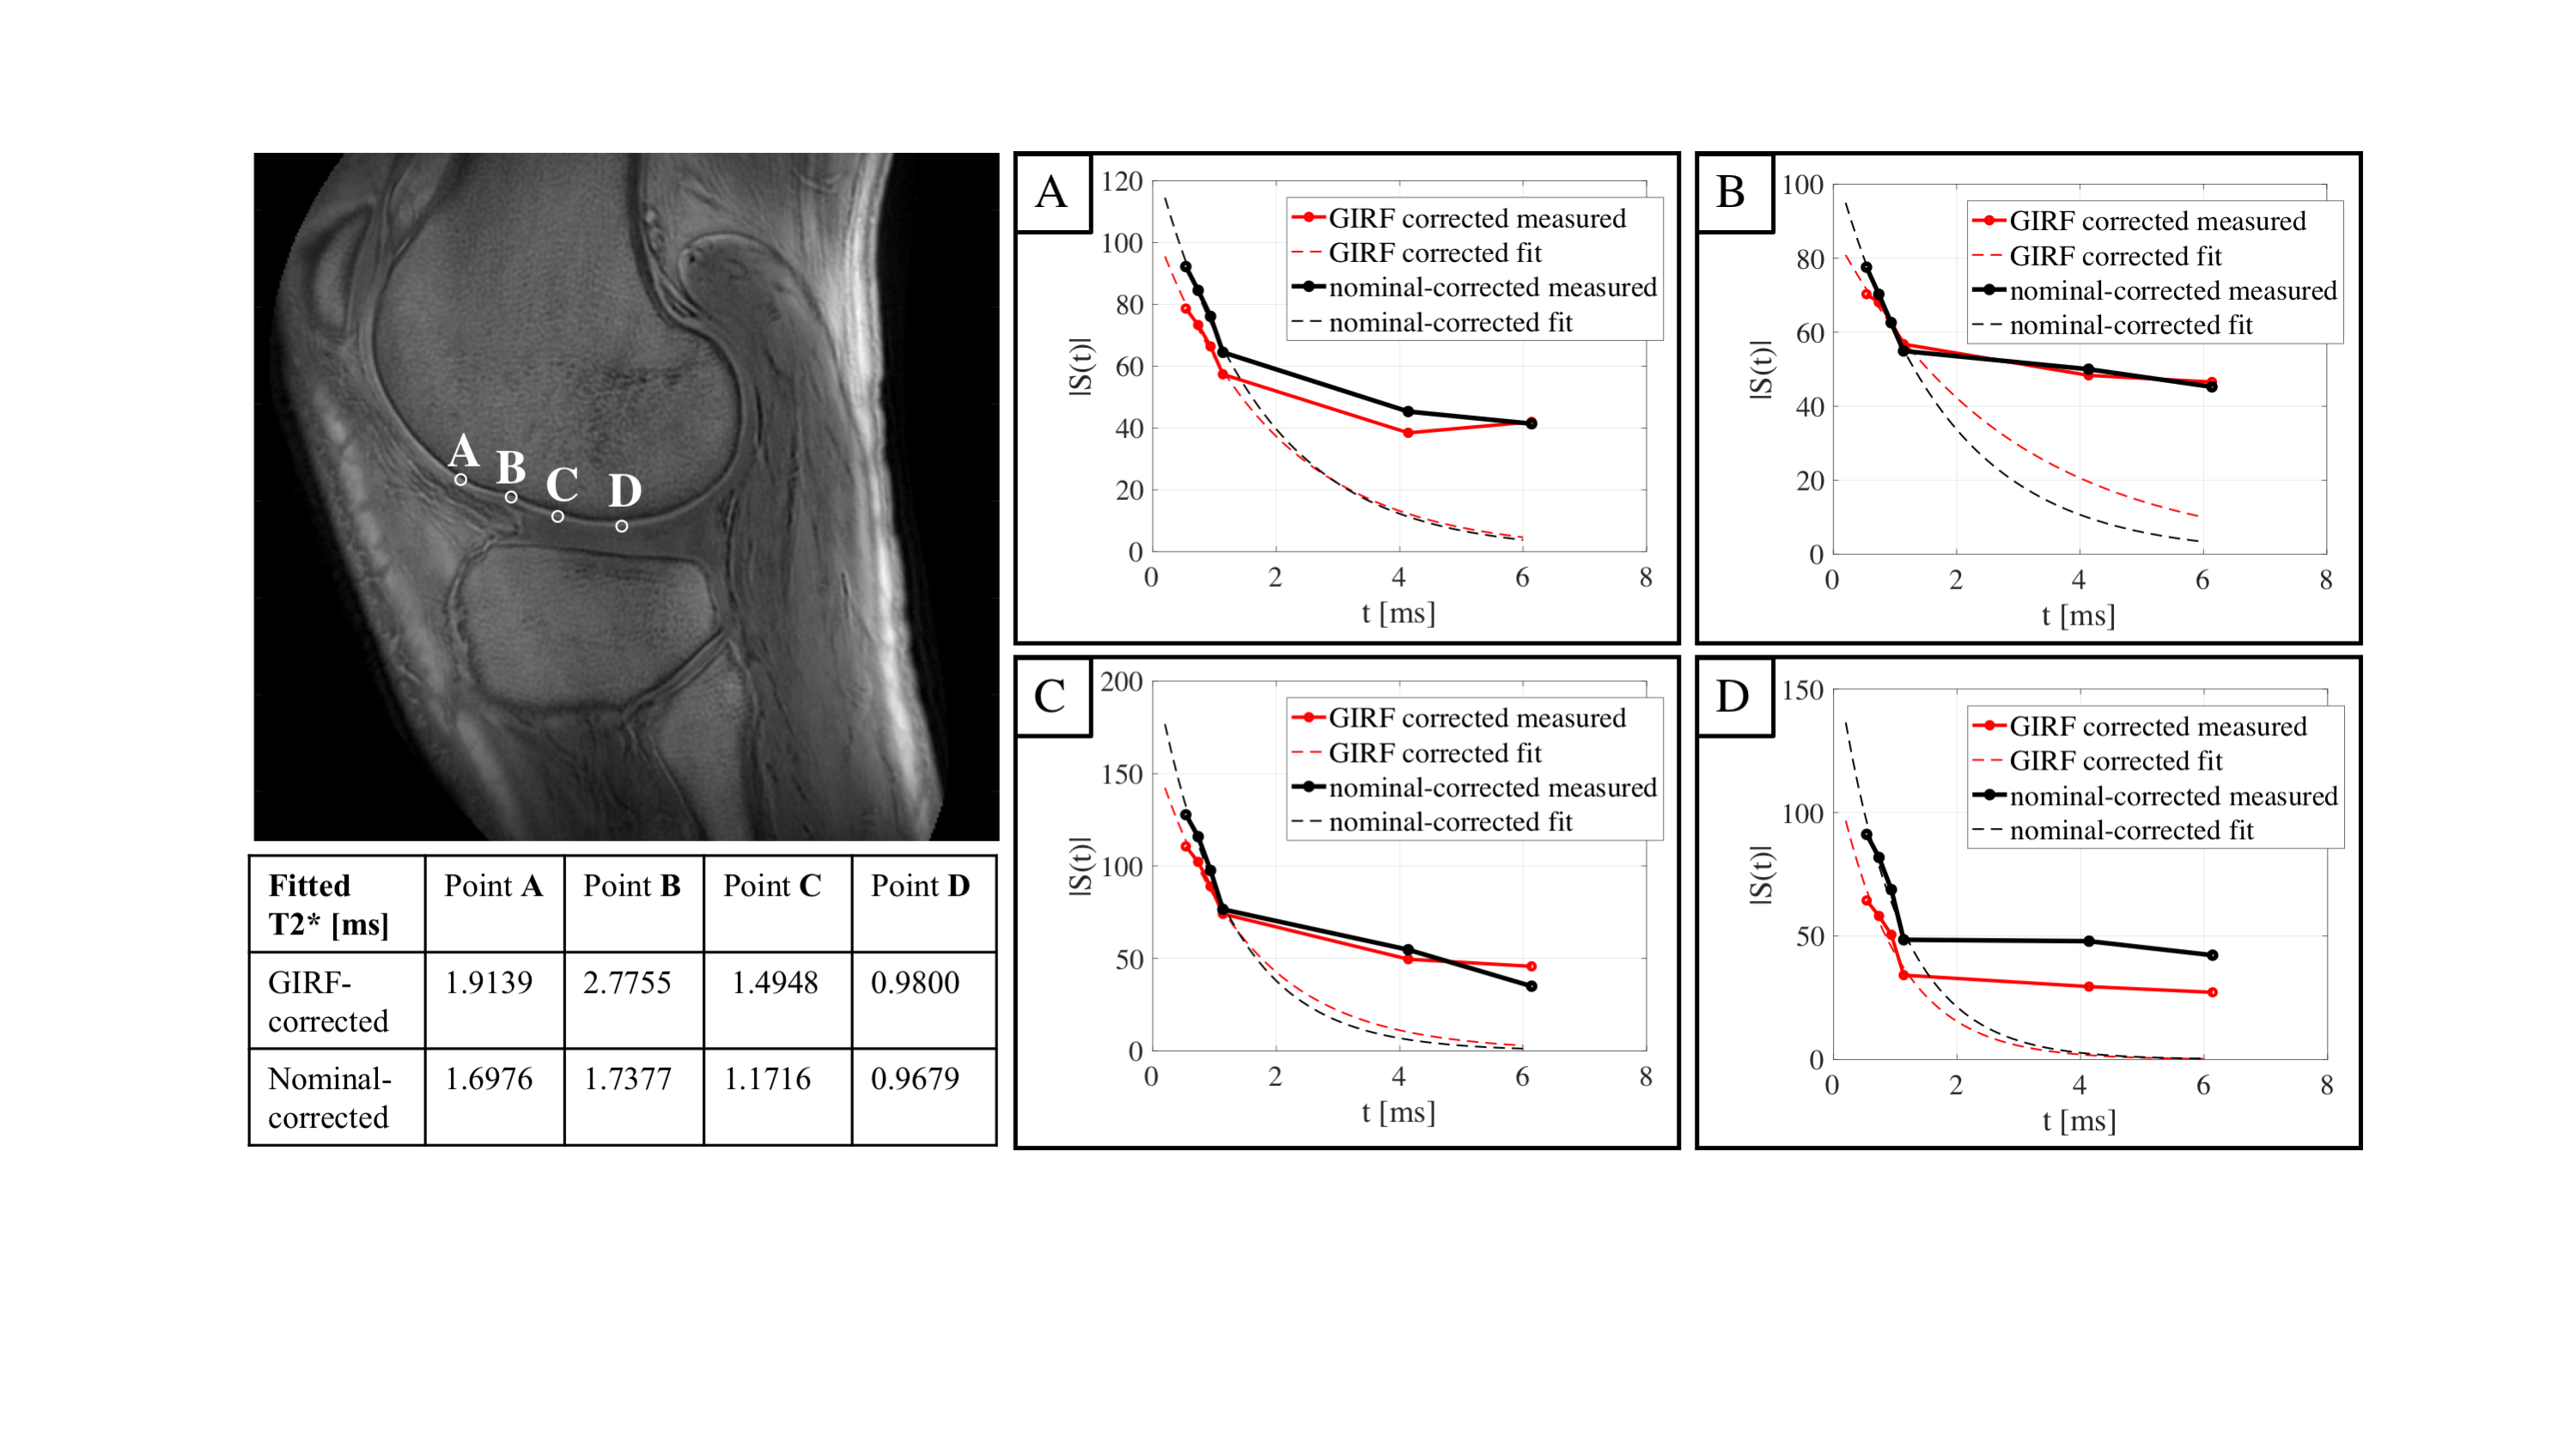
Figure 4 shows exemplary signal decays of deep cartilage voxels as a function of TE. The mono-exponential fit, using only the first four echoes, resulted in lower short T2* values in deep cartilage when using the nominal-corrected images (T2* in the range of 0.97ms and 1.74ms) compared to when using the GIRF-corrected images (T2* in the range of 0.98ms and 2.78ms).
Discussion & Conclusion
The deep cartilage layer zone is 3-8% of the cartilage thickness, which corresponds to a submillimeter thickness. In addition, the deep cartilage layer has a T2* of approximately 1-3.3ms and a shorter T1 than the superficial cartilage2. Therefore, high-resolution T1-weighted UTE imaging is typically being used at a single UTE to depict the deep cartilage morphology and at multi-TEs to measure its T2* relaxation time. The reported decrease of the deep cartilage short T2* value when using the nominal-correction compared to when using the GIRF-correction is in agreement with the increased cortical bone blurring due to UTE k-space trajectory errors when using the nominal-correction. Trajectory errors can blur the surrounding cortical bone signal into the signal of the deep cartilage and therefore induce an underestimation of the deep cartilage T2* relaxation estimated based on the early echoes. The above trajectory errors cannot be corrected using a simple low-pass model of the gradient chain. However, a GIRF-based correction is able to correct for such trajectory distortions and would be helpful in improving the contrast for the depiction of deep cartilage and in removing errors in deep cartilage T2* quantification, employed in osteoarthritis and cartilage repair studies.Acknowledgements
The present work was supported by the European Research Council (grant agreement No 677661, ProFatMRI). This work reflects only the authors view and the EU is not responsible for any use that may be made of the information it contains. The authors also acknowledge research support from Philips Healthcare.References
[1] Link, T. M., Neumann, J., & Li, X. (2017). Prestructural cartilage assessment using MRI. Journal of Magnetic Resonance Imaging. https://doi.org/10.1002/jmri.25554
[2] Du, J., Carl, M., Bae, W. C., Statum, S., Chang, E. Y., Bydder, G. M., & Chung, C. B. (2013). Dual inversion recovery ultrashort echo time (DIR-UTE) imaging and quantification of the zone of calcified cartilage (ZCC). Osteoarthritis and Cartilage. https://doi.org/10.1016/j.joca.2012.09.009
[3] Foreman, S. C., Ashmeik, W., Baal, J. D., Han, M., Bahroos, E., von Schacky, C. E., … Link, T. M. (2019). Patients with Type 2 Diabetes Exhibit a More Mineralized Deep Cartilage Layer Compared with Nondiabetic Controls: A Pilot Study. CARTILAGE. https://doi.org/10.1177/1947603519870853
[4] Shao, H., Chang, E. Y., Pauli, C., Zanganeh, S., Bae, W., Chung, C. B., … Du, J. (2016). UTE bi-component analysis of T2* relaxation in articular cartilage. Osteoarthritis and Cartilage. https://doi.org/10.1016/j.joca.2015.08.017
[5] Williams, A. A., Titchenal, M. R., Andriacchi, T. P., & Chu, C. R. (2018). MRI UTE-T2* profile characteristics correlate to walking mechanics and patient reported outcomes 2 years after ACL reconstruction. Osteoarthritis and Cartilage. https://doi.org/10.1016/j.joca.2018.01.012
[6] Williams, A. A., Titchenal, M. R., Do, B. H., Guha, A., & Chu, C. R. (2019). MRI UTE-T2* shows high incidence of cartilage subsurface matrix changes 2 years after ACL reconstruction. Journal of Orthopaedic Research. https://doi.org/10.1002/jor.24110
[7] Atkinson IC, Lu A, Thulborn KR. Characterization and correction of system delays and eddy currents for MR imaging with ultrashort echo-time and time-varying gradients. Magn Reson Med. 2009;62(2):532-537. doi:10.1002/mrm.22016.
[8] Kronthaler, S., Rahmer, J., Börnert, P., Karampinos, D.C., Trajectory correction for ultrashort echo-time (UTE) imaging based on the measurement of the gradient impulse response function (GIRF) with a thin-slice method, in: Proceedings 27. Annual Meeting International Society for Magnetic Resonance in Medicine. Montreal, Canada, p. 0924.
[9] Vannesjo SJ, Haeberlin M, Kasper L, et al. Gradient system characterization by impulse response measurements with a dynamic field camera. Magn Reson Med. 2013;69(2):583-593. doi:10.1002/mrm.24263.
[10] Duyn JH, Yang Y, Frank JA, Van Der Veen JW. Simple Correction Method for k-Space Trajectory Deviations in MRI. J Magn Reson. 1998;132(1):150-153. doi:10.1006/jmre.1998.1396.
[11] Rahmer, J., Mazurkewitz, P., Börnert, P., & Nielsen, T. (2019). Rapid acquisition of the 3D MRI gradient impulse response function using a simple phantom measurement. Magnetic Resonance in Medicine. https://doi.org/10.1002/mrm.27902
Figures