2754
Cluster analysis of T2 changes is related to acute exercise in individuals with knee osteoarthritis1Bioengineering, Stanford University, Stanford, CA, United States, 2Radiology, Stanford University, Stanford, CA, United States, 3Mechanical Engineering, Stanford University, Stanford, CA, United States, 4Electrical Engineering, Stanford University, Stanford, CA, United States
Synopsis
Degradation of articular cartilage related to osteoarthritis is associated with changes in cartilage T2 relaxation times that may not be uniform across the cartilage surface. Analysis of changes in T2 times longitudinally or in response to mechanical loading can assist in detection of regions of cartilage damage. Here we examine the ability of cluster analysis to reflect transient changes in cartilage T2 times in response to acute loading. Osteoarthritic subjects who performed a squat exercise had a greater percent of the cartilage area with negative changes in T2 times compared to healthy and osteoarthritic subjects who did not exercise.
Introduction
Osteoarthritis (OA) is a progressive and debilitating disease characterized by structural degradation of the whole joint. Structural and compositional properties of articular cartilage, thought to among the first tissues impacted in the progression of OA, can be detected using MRI. Cartilage biochemical degradation and loss and altered mechanical properties have been associated with elevated T2 relaxation times. Analysis of changes in T2 times can assist in the detection of early changes related to OA. However, these changes are not uniform across the cartilage surface. Averaging changes in T2 times may diminish sensitivity to specific regions of structural change. Cluster analysis has been developed as a tool to detect and monitor focal lesions of T2 changes in the cartilage of ACL-injured subjects1. In this work, we examine the ability of cluster analysis to detect transient changes in cartilage related to acute exercise.Methods
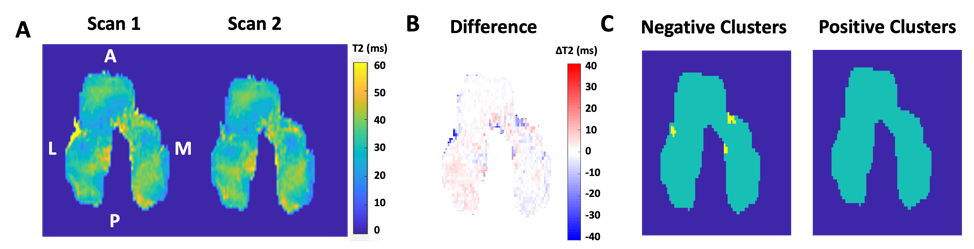
The right knees of three healthy volunteers and ten individuals with lateral knee OA (aged 60.4 ± 9.0 years, BMI 28.0 ± 5.2) were scanned consecutively on a 3T MR system (GE Healthcare) using a quantitative double-echo in steady-state (qDESS) sequence2. Between scans, healthy volunteers (“Healthy” cohort) were repositioned to assess scan-rescan repeatability. OA subjects were split into two groups: 5 performed a single-legged squat exercise (“Exercised”) with their right knee to exhaustion (82 ± 34 repetitions) and 5 did not (“Rested”). Both the first and second echoes of qDESS images were used to calculate T2 relaxation times2. The femoral cartilage of the first scan (“Scan 1”) was automatically segmented using a deep-learning-based algorithm3 and manually corrected as necessary. DESS images and T2 relaxation time maps for the second scan (“Scan 2”) were registered to the images from Scan 1 using Elastix4 implementing rigid registration and resampled using B spline interpolations with a factor of three. Cartilage masks were applied to Scan 1 and Scan 2 T2 relaxation time maps and each was projected onto a 2D plane for visualization1. For each subject, the 2D projection of the Scan 1 cartilage T2 map was subtracted from its respective Scan 2 projection to create a difference map. From this difference map, “clusters”, or groups of pixels greater than 12.4 mm2 where T2 increased or decreased by a factor of two times the standard deviation of scan-rescan differences1 of controls, were identified for the entire cartilage surface. The area of the positive or negative clusters were normalized to the total cartilage area and reported as a percent cluster area (%CA). A general linear model with Tukey post-hoc comparisons was used to assess whether there were significant changes in T2 and positive or negative %CA (a = 0.05) after exercise compared to rested and healthy knees.Results
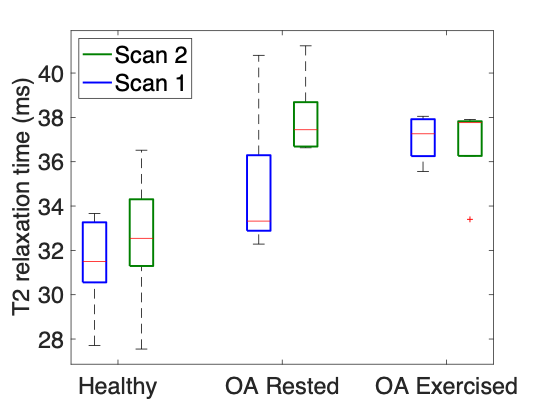
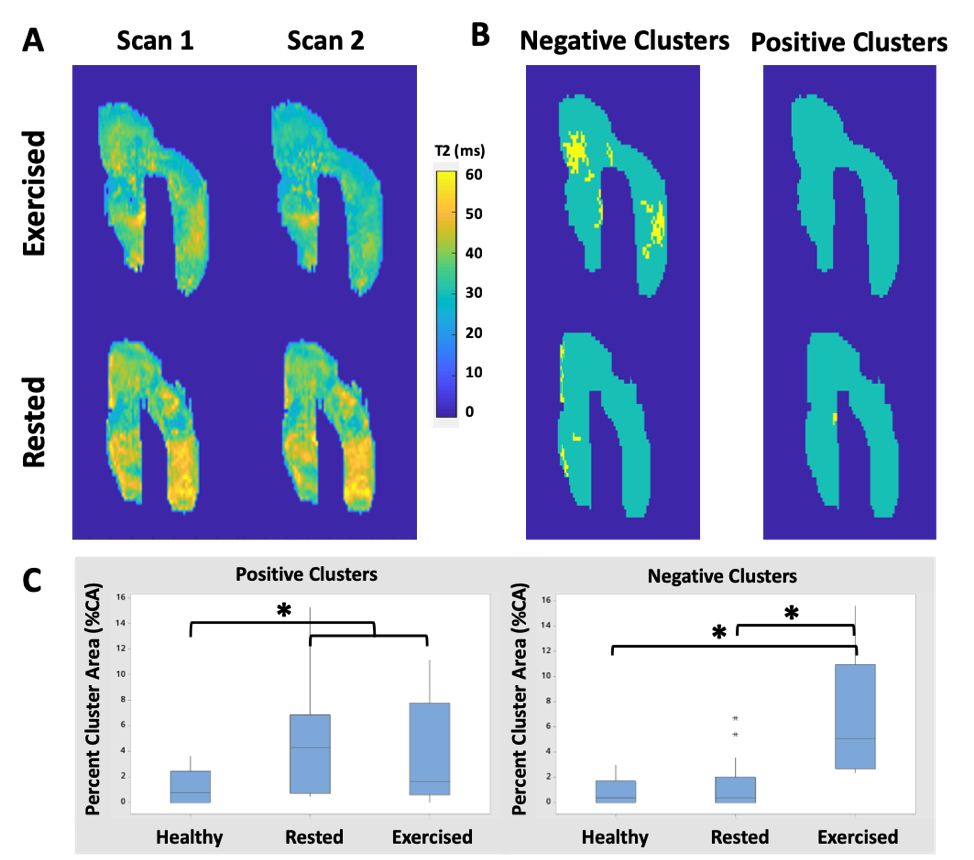
Average femoral cartilage T2 relaxation times for Scan 1 and Scan 2 in healthy controls were statistically similar (p = 0.656) with an average T2 change of 1.0 ± 1.6 ms (Figure 1) suggesting high scan-rescan repeatability. Osteoarthritic subjects had significantly higher T2 times than healthy controls, and the Exercised cohort had significantly higher T2 times compared to those in the Rested cohort (p < 0.001 for both). There was no significant difference between the average T2 values of Scan 1 and Scan 2 for OA subjects who rested (p = 0.093) and those who exercised (p = 0.862). Cluster analysis of repeated scans of healthy subjects showed an average positive %CA of 0.76 ± 1.3% and an average negative %CA of 0.76 ± 0.75% (Figure 2). There were elevated positive and negative cluster areas in exercised OA subjects compared to healthy controls (p = 0.006 and p < 0.001 respectively). Osteoarthritic subjects who rested between Scans 1 and 2 had similar positive %CA as those who exercised (4.7 ± 5.0 %CA and 2.64 ± 3.0 %CA respectively, p = 0.462) (Figure 3). However, the exercise was associated with significant differences in negative cluster area (p = 0.02), with higher negative %CA in exercised knees (6.6 ± 3.3 %CA) than in rested knees (1.1 ± 1.6 %CA).Discussion
Quantitative DESS imaging has good reproducibility in healthy subjects. While the average change in T2 relaxation times of OA subjects who performed a squat exercise with their right leg between scans were similar to those who did not, cluster analysis indicated that the exercise resulted in localized decreases in T2. These subjects had a higher percent of the cartilage surface that experienced negative changes in T2 compared to both rested cohorts. Focal lesions of cartilage degradation may exhibit decreased mechanical stiffness and increased permeability compared to surrounding tissue, which may impact T2 relaxation times in response to loading. While qDESS and cluster analysis show higher scan-rescan variability in OA subjects compared to healthy subjects, cluster analysis shows potential as a method of highlighting specific regions with greater responses to acute loading during analysis of quantitative images.Conclusion
Transient decreases in femoral cartilage T2 relaxation times induced by acute exercise were not detected when T2 times were averaged across the cartilage surface but were observed using cluster analysis. Cluster analysis may assist in detection of cartilage regions with abnormal structural or mechanical properties using MRI.Acknowledgements
We received research support from GE Healthcare and NIH grants R01-EB002524-14, R01-AR063643-05, R00 EB022634, and K24-AR062068-07. This work was also supported by the William K. Bowes Jr. Stanford Graduate Fellowship.
References
1. Monu UD, Jordan CD, Samuelson BL, Hargreaves BA, Gold GE, McWalter EJ. Cluster analysis of quantitative MRI T2 and T1rho relaxation times of cartilage identifies differences between healthy and ACL-injured individuals at 3T. Osteoarthritis and Cartilage, 2017; 25(4):513-520.
2. Sveinsson B, Chaudhari AS, Gold GE, Hargreaves BA. A Simple Analytic Method for Estimating t2 in the Knee from DESS. Magn Reson Imaging. 2017; 38: 63-70.
3. Desai A, Barbieri M, Mazzoli V, Rubin E, Black M, Watkins L, Gold G, Hargreaves B, Chaudhari A. DOSMA: A deep-learning, open-source framework for musculoskeletal MRI analysis (Version v0.0.9, prerelease). Zenodo. Feb 2019. https://doi.org/10.5281/zenodo.2559549.
4. Klein S, Staring M, Murphy K, Viergever MA, Pluim JPW. Elastix: A toolbox for intensity-based medical image registration. IEEE Trans Med Imaging. 2010;29(1):196–205.
Figures