2753
Investigation into the effect of spin-lock frequency on the angular dependence of T1rho in in-vivo measurements of femoral knee cartilage at 3T1Electrical Engineering, Stanford University, Stanford, CA, United States, 2Radiology, Stanford University, Stanford, CA, United States
Synopsis
Given the use of T1rho as a measure of cartilage health and an early indicator for osteoarthritis, it is important to understand the T1rho relaxation mechanism including its somewhat unexplained angular dependence. In the hope of finding a range of spin-lock frequencies (FSLs) with a decreased angular dependence, we generated T1rho maps of in-vivo femoral knee cartilage at various FSLs from 100Hz to 1kHz. We found a visible angular dependence in T1rho measurements for all FSLs including 1kHz. If there exists a range of FSL with little or no angular dependence it is higher than 1kHz.
Introduction
It has previously been shown that T1rho relaxation time mapping for assessment of cartilage health and as an early indicator for osteoarthritis [1,2]. Unfortunately, the T1rho relaxation mechanism remains poorly understood. In particular there have been conflicting results surrounding the sensitivity to dipolar interactions as evidenced by angular dependence (AD) in T1rho maps, and the optimal spin lock frequency (FSL) for proteoglycan sensitivity [3-6]. It has been shown the magnitude of changes in T1rho due to angular orientation exceeded those of the changes in T1rho due to degeneration [6] making it imperative to better understand this AD. Our goal is to investigate this dependency with the hope of identifying FSL values with a smaller AD for in-vivo measurements of T1rho in articular cartilage, indicating a decoupling of collagen dipolar relaxation effects.Methods
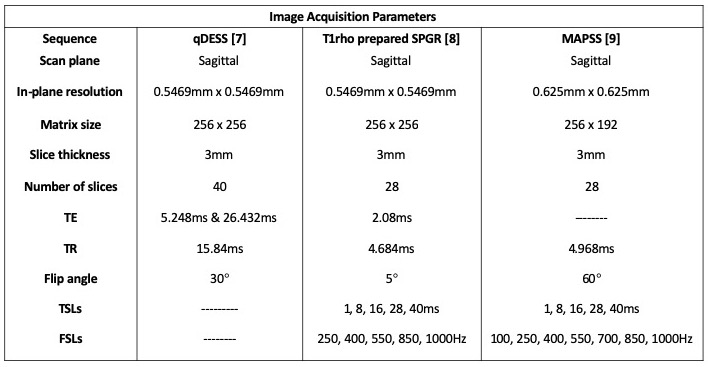
Two healthy volunteers were scanned on a whole-body 3T scanner (GE Signa, GE Healthcare, WI) with an 18-ch transmit and receive knee coil. A quantitative double echo steady state (qDESS) sequence [7] and one of two pulse sequences consisting of a T1rho magnetization preparation followed by an SPGR readout [8-9] were acquired. The imaging parameters for these sequences are shown in Table 1.Using the qDESS data and an open source deep-learning analysis pipeline [10], we generated a segmentation of the femoral cartilage in the first qDESS echo (adjusted manually) and a T2 map [7]. The T1rho weighted images were registered to the first TSL image using affine image registration and then to the first qDESS echo using rigid and b-spline image registration. A T1rho map was then generated for each FSL by a pixel-wise mono-exponential fitting algorithm. All T1rho values greater than 120ms were discarded as not physiological for cartilage.
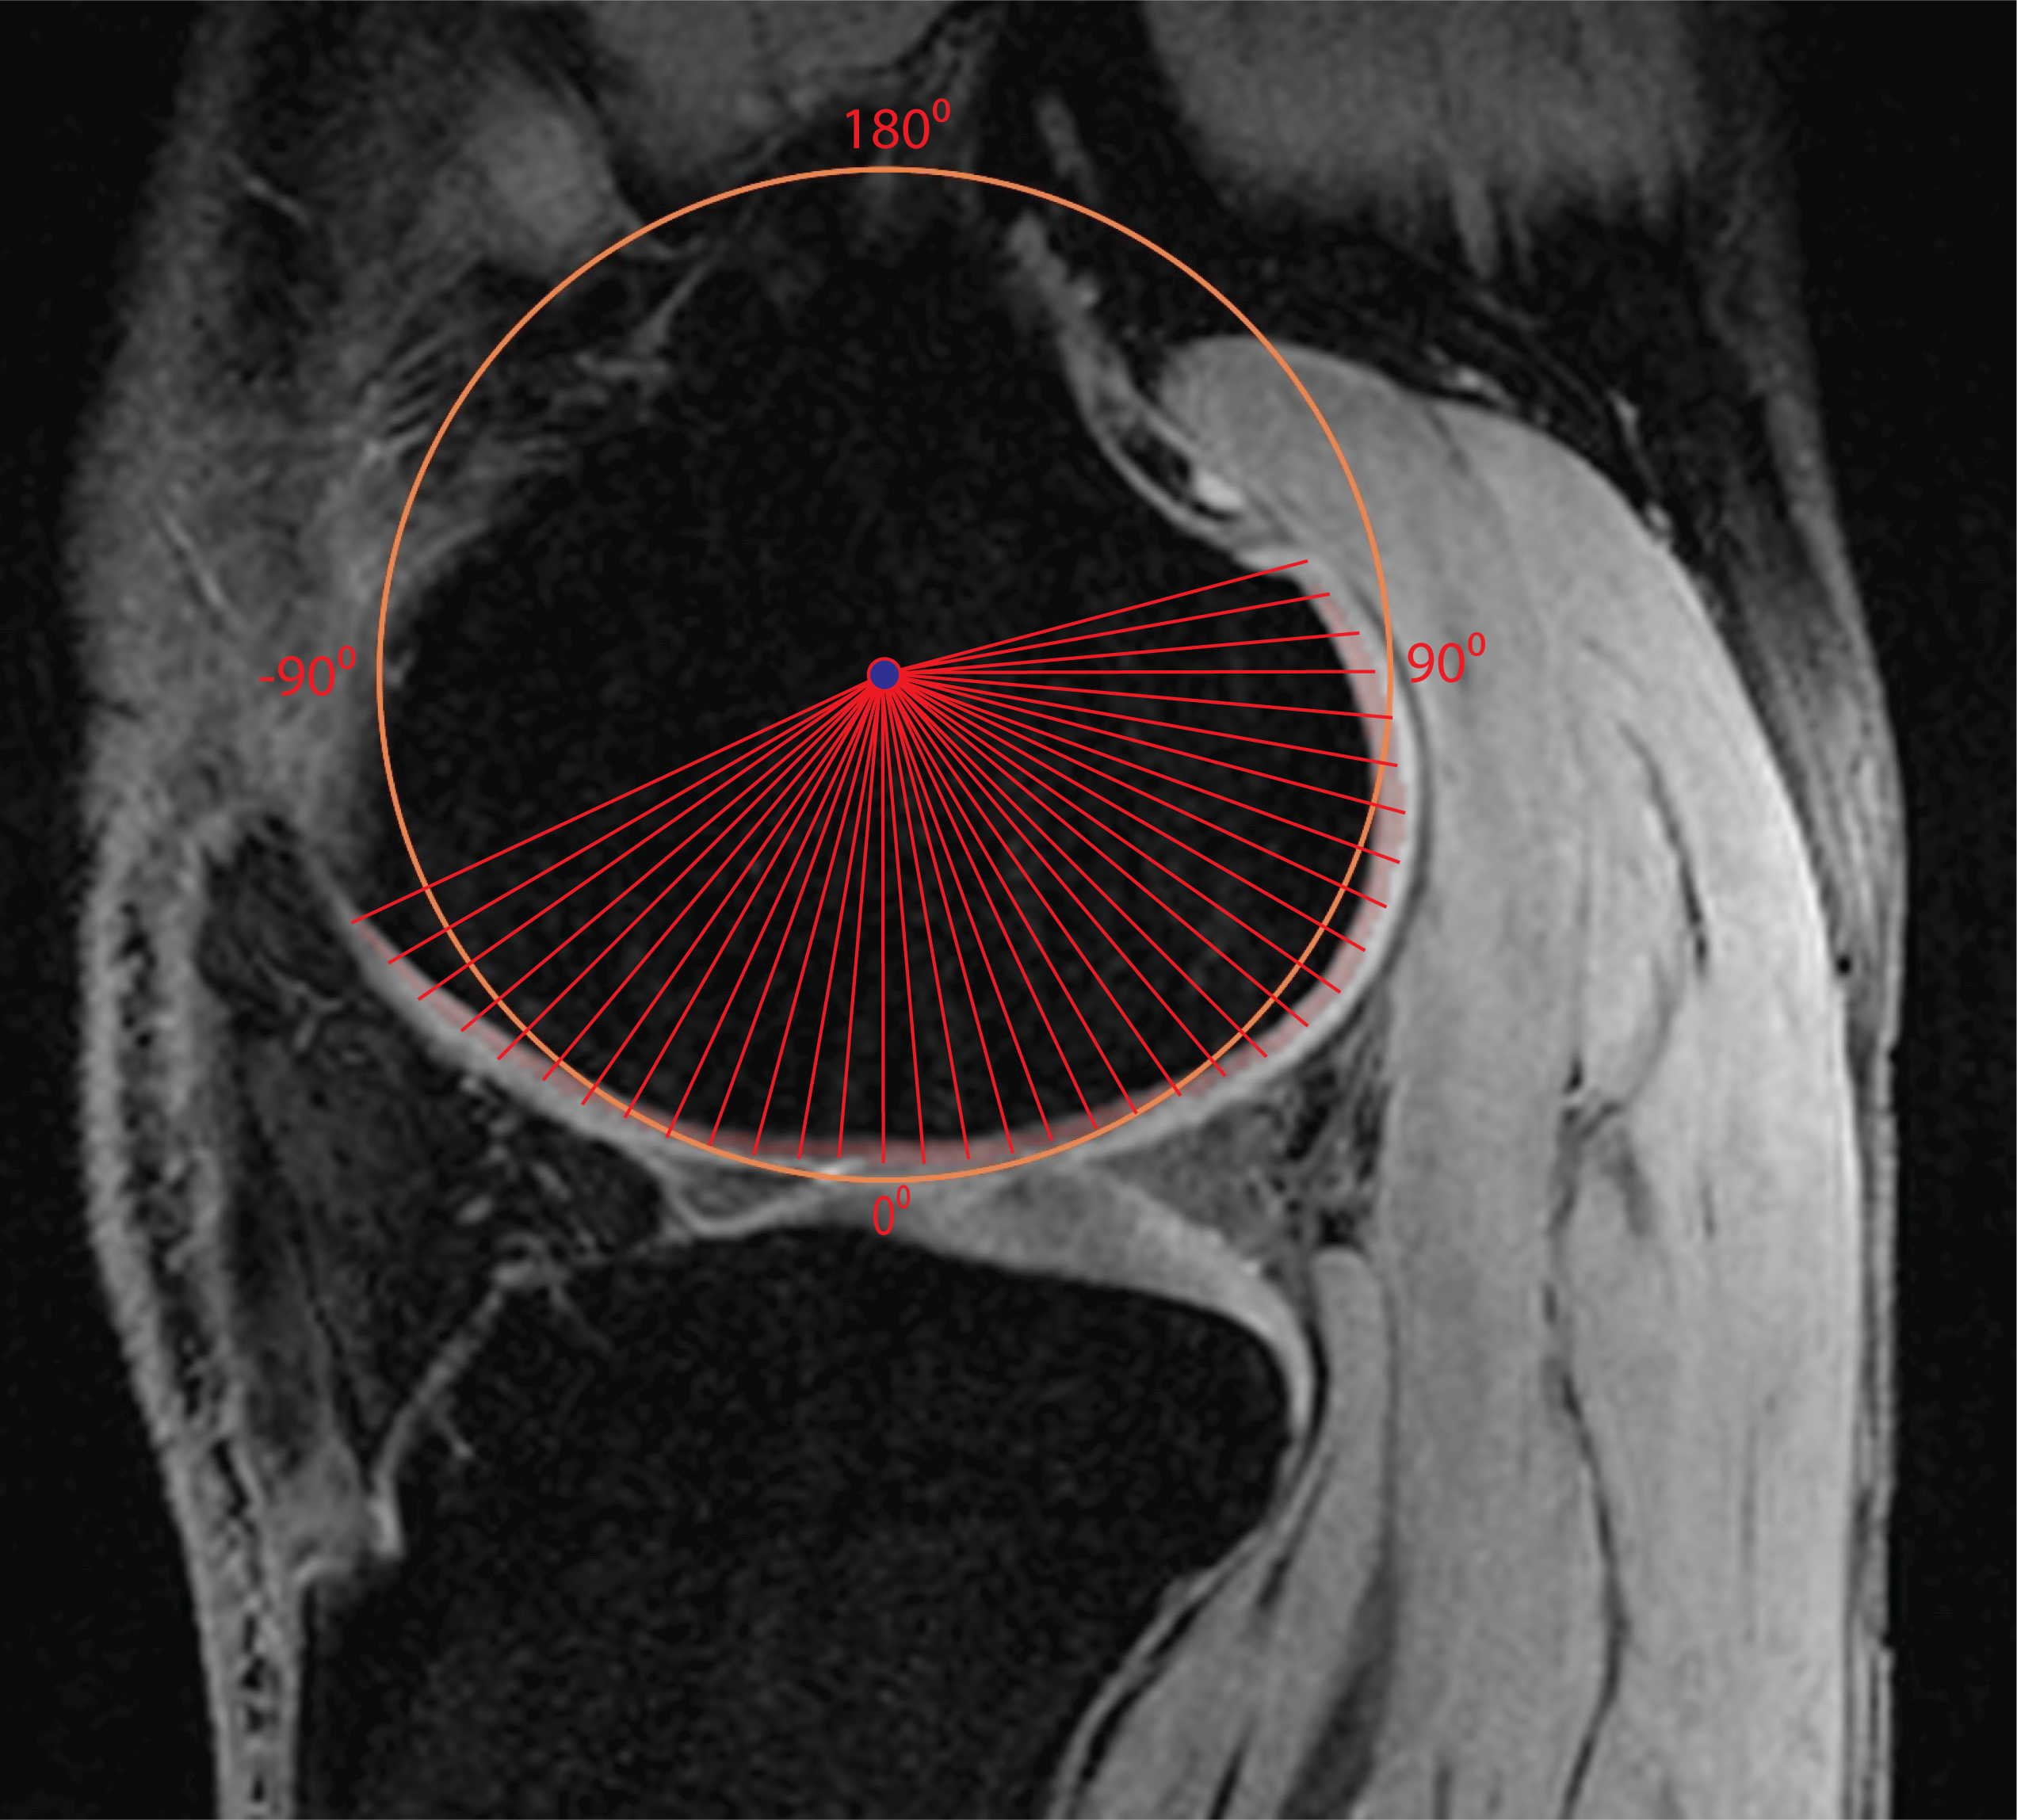
We estimated the angular orientation of the cartilage similarly to previously reported methods [5,11]. For each slice, the x and y values of each cartilage pixel were fitted using a least-squares circle fitting algorithm. The center point of the circle was used to calculate the angular orientation of each cartilage pixel as shown in Figure 2. We used only slices with a wide range of angular orientations and relatively smooth T1rho maps to maximize the accuracy of the angular estimates and decrease the effect of partial voluming. For better visualization, we combined the results from three or four neighboring slices and averaged T1rho values over angular bins of 5°.
To account for the approximate nature of the angle measures we used the location of peak values of T2 to identify the magic angle. T1rho dispersion curves were calculated at these and other angles by averaging all T1rho values from the combined data from neighboring slices found within 3 degrees of the angle of interest for each of the FSLs.
Results
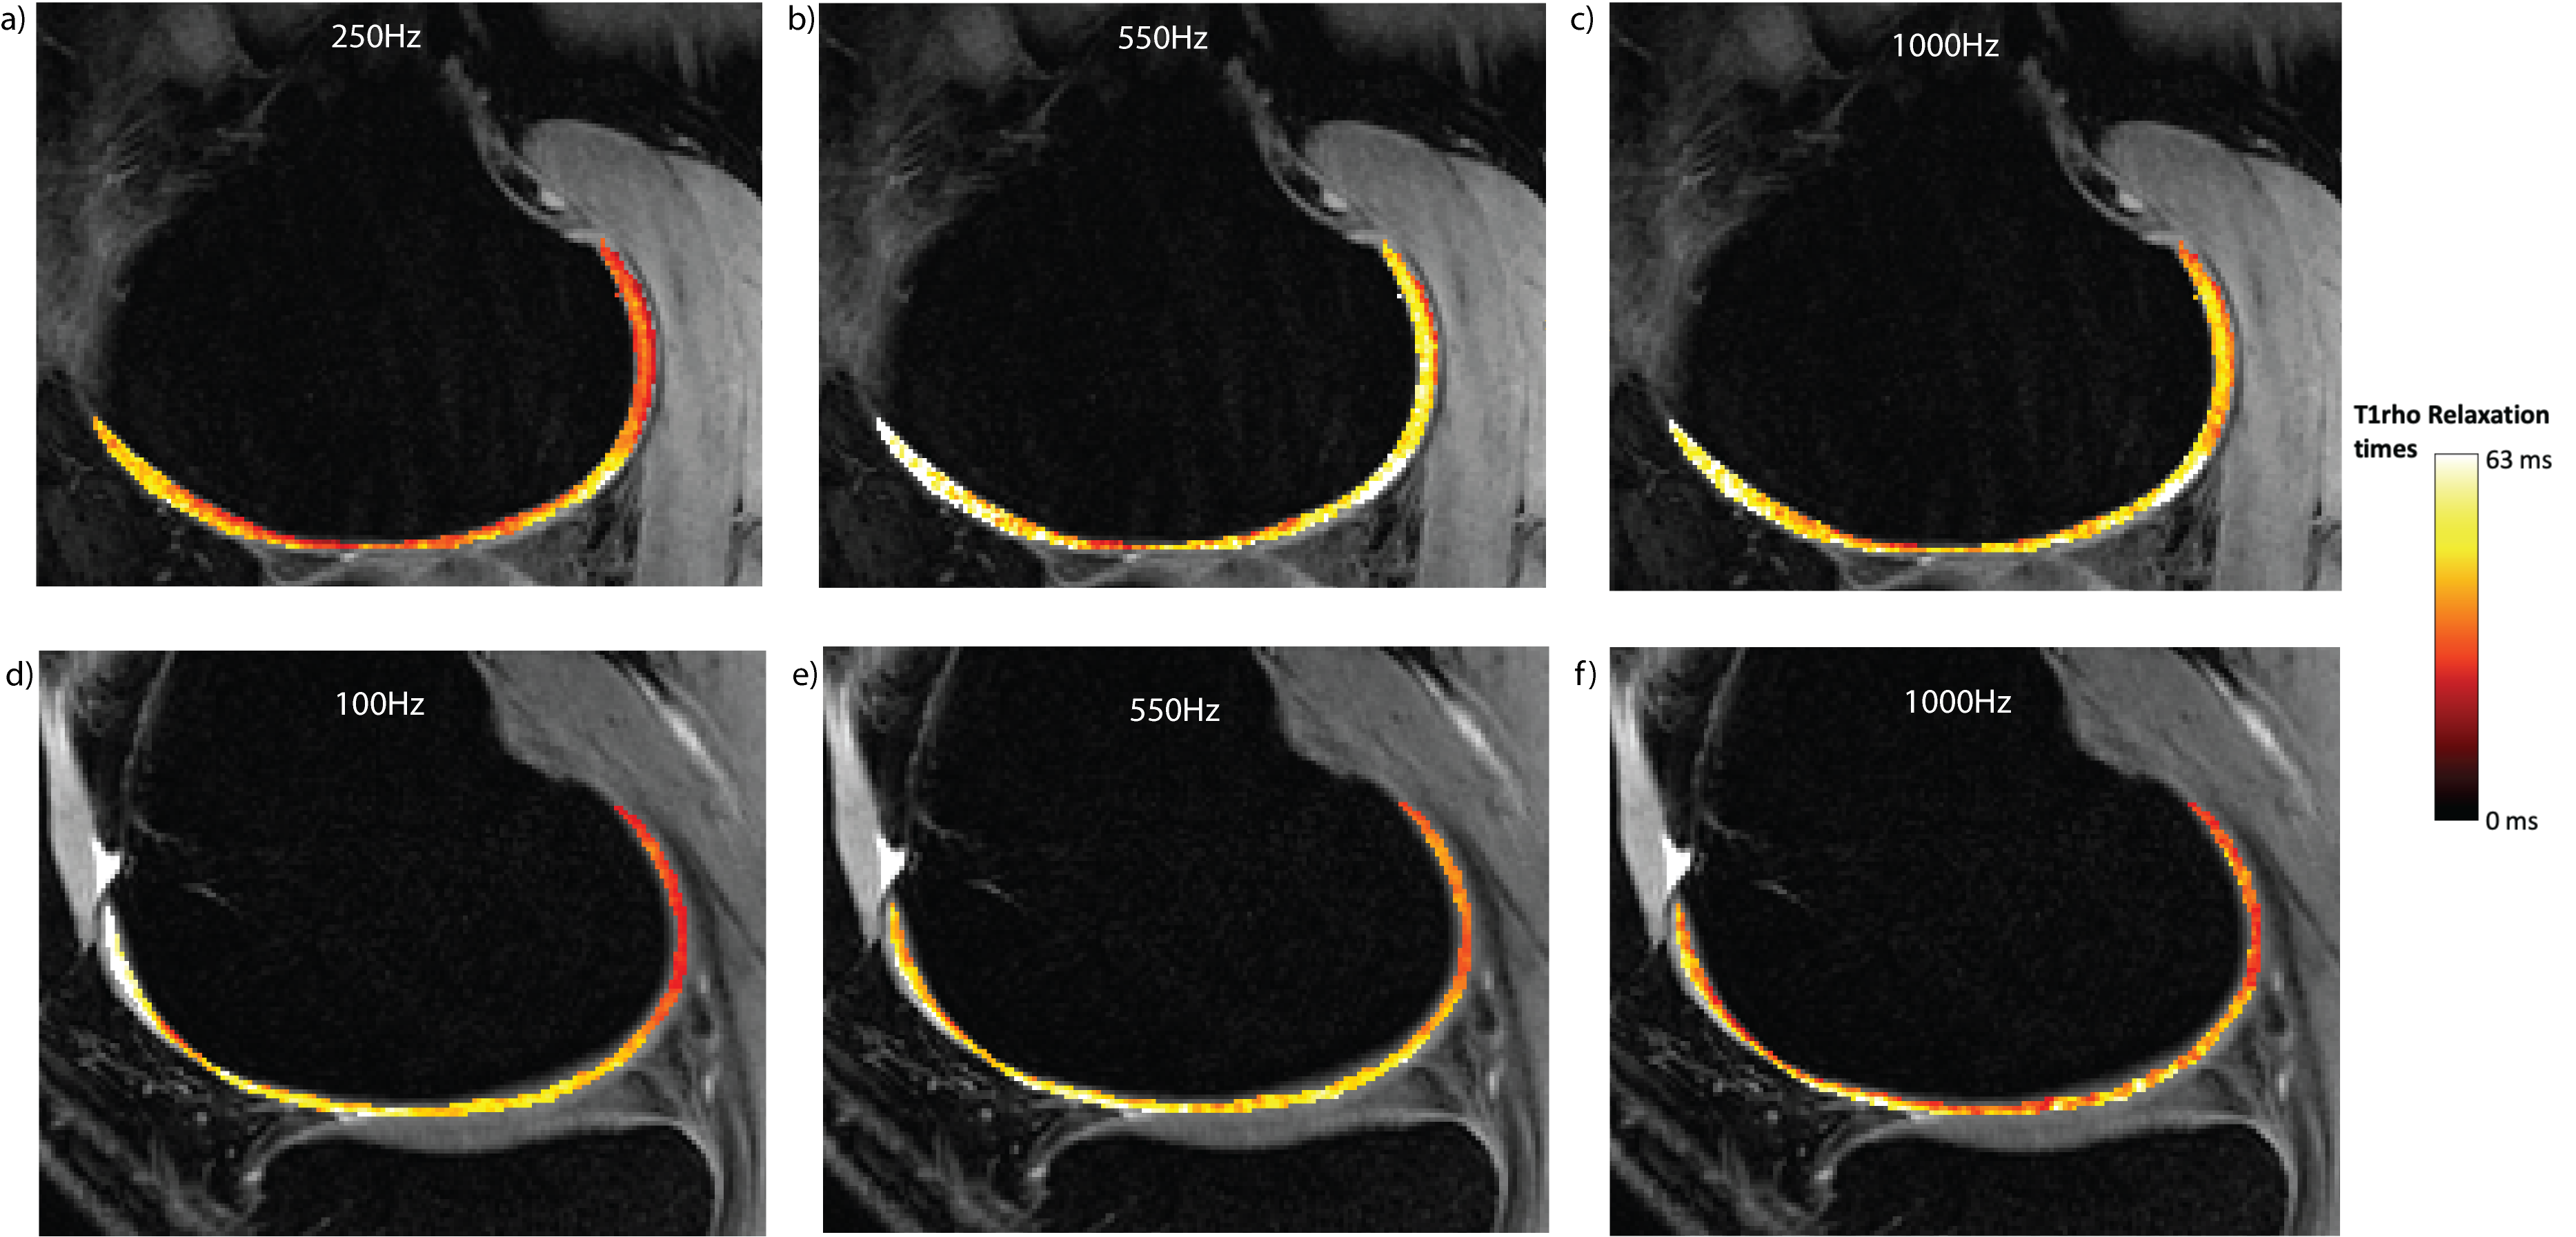
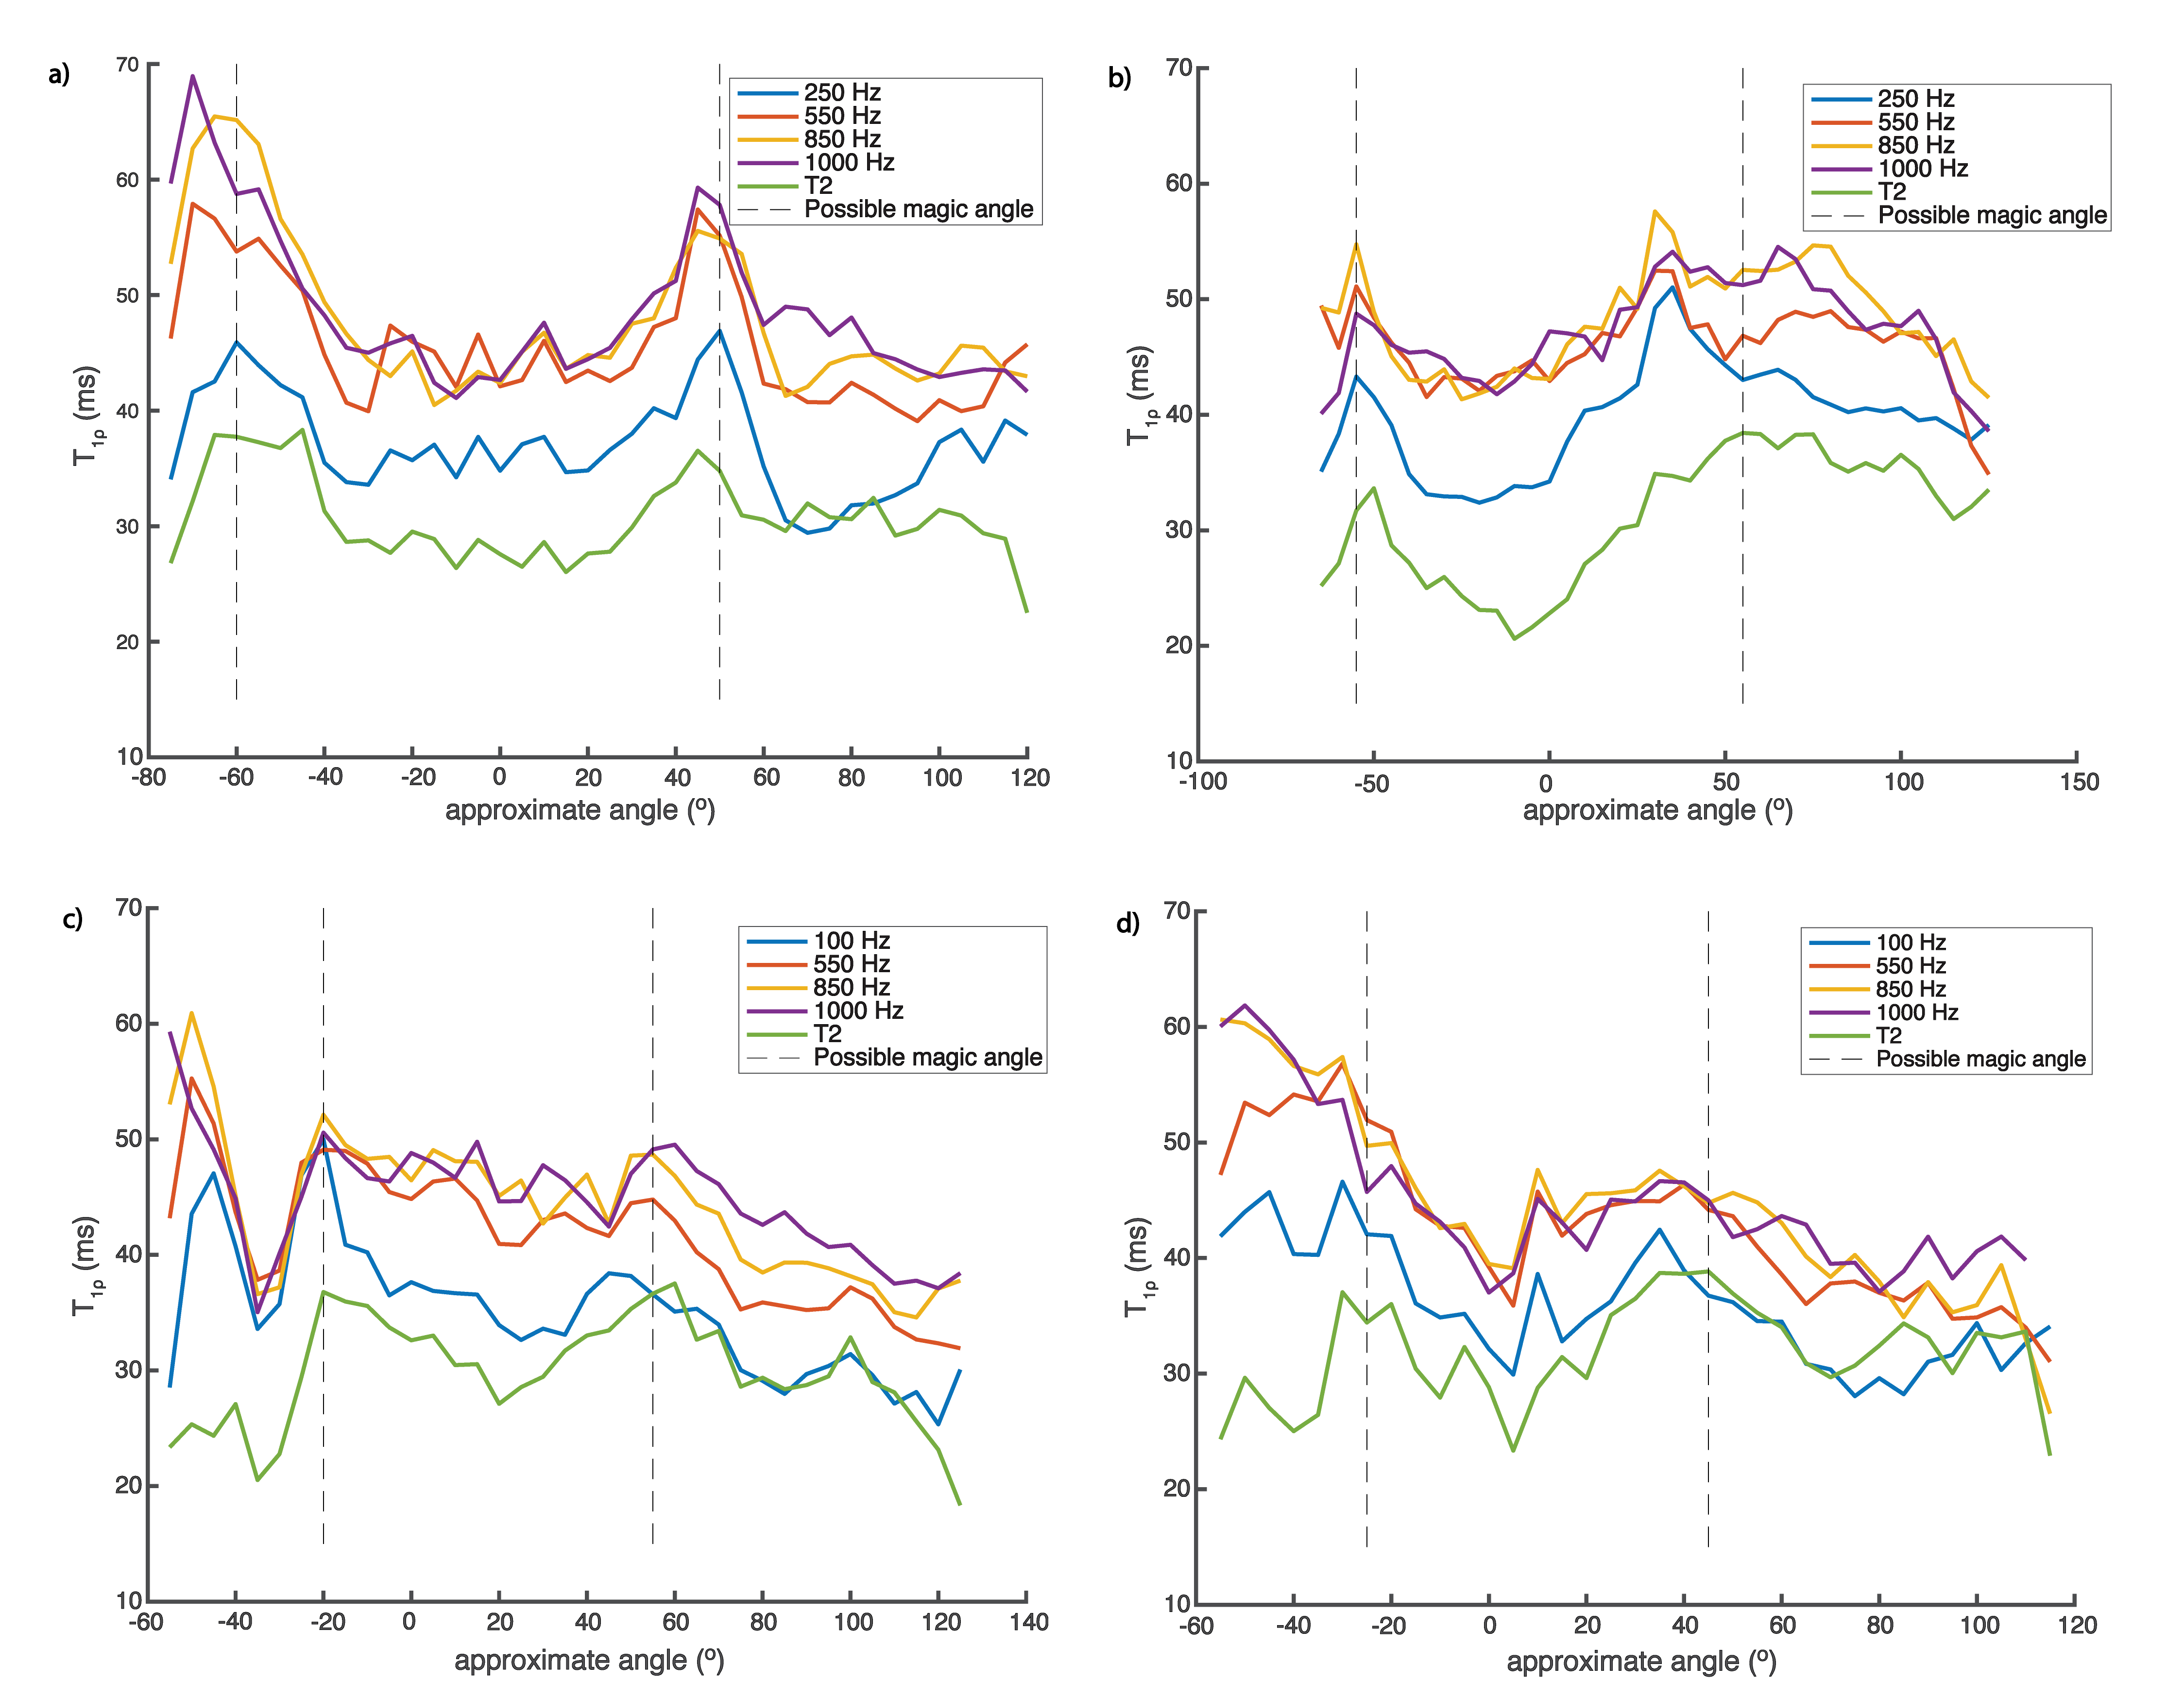
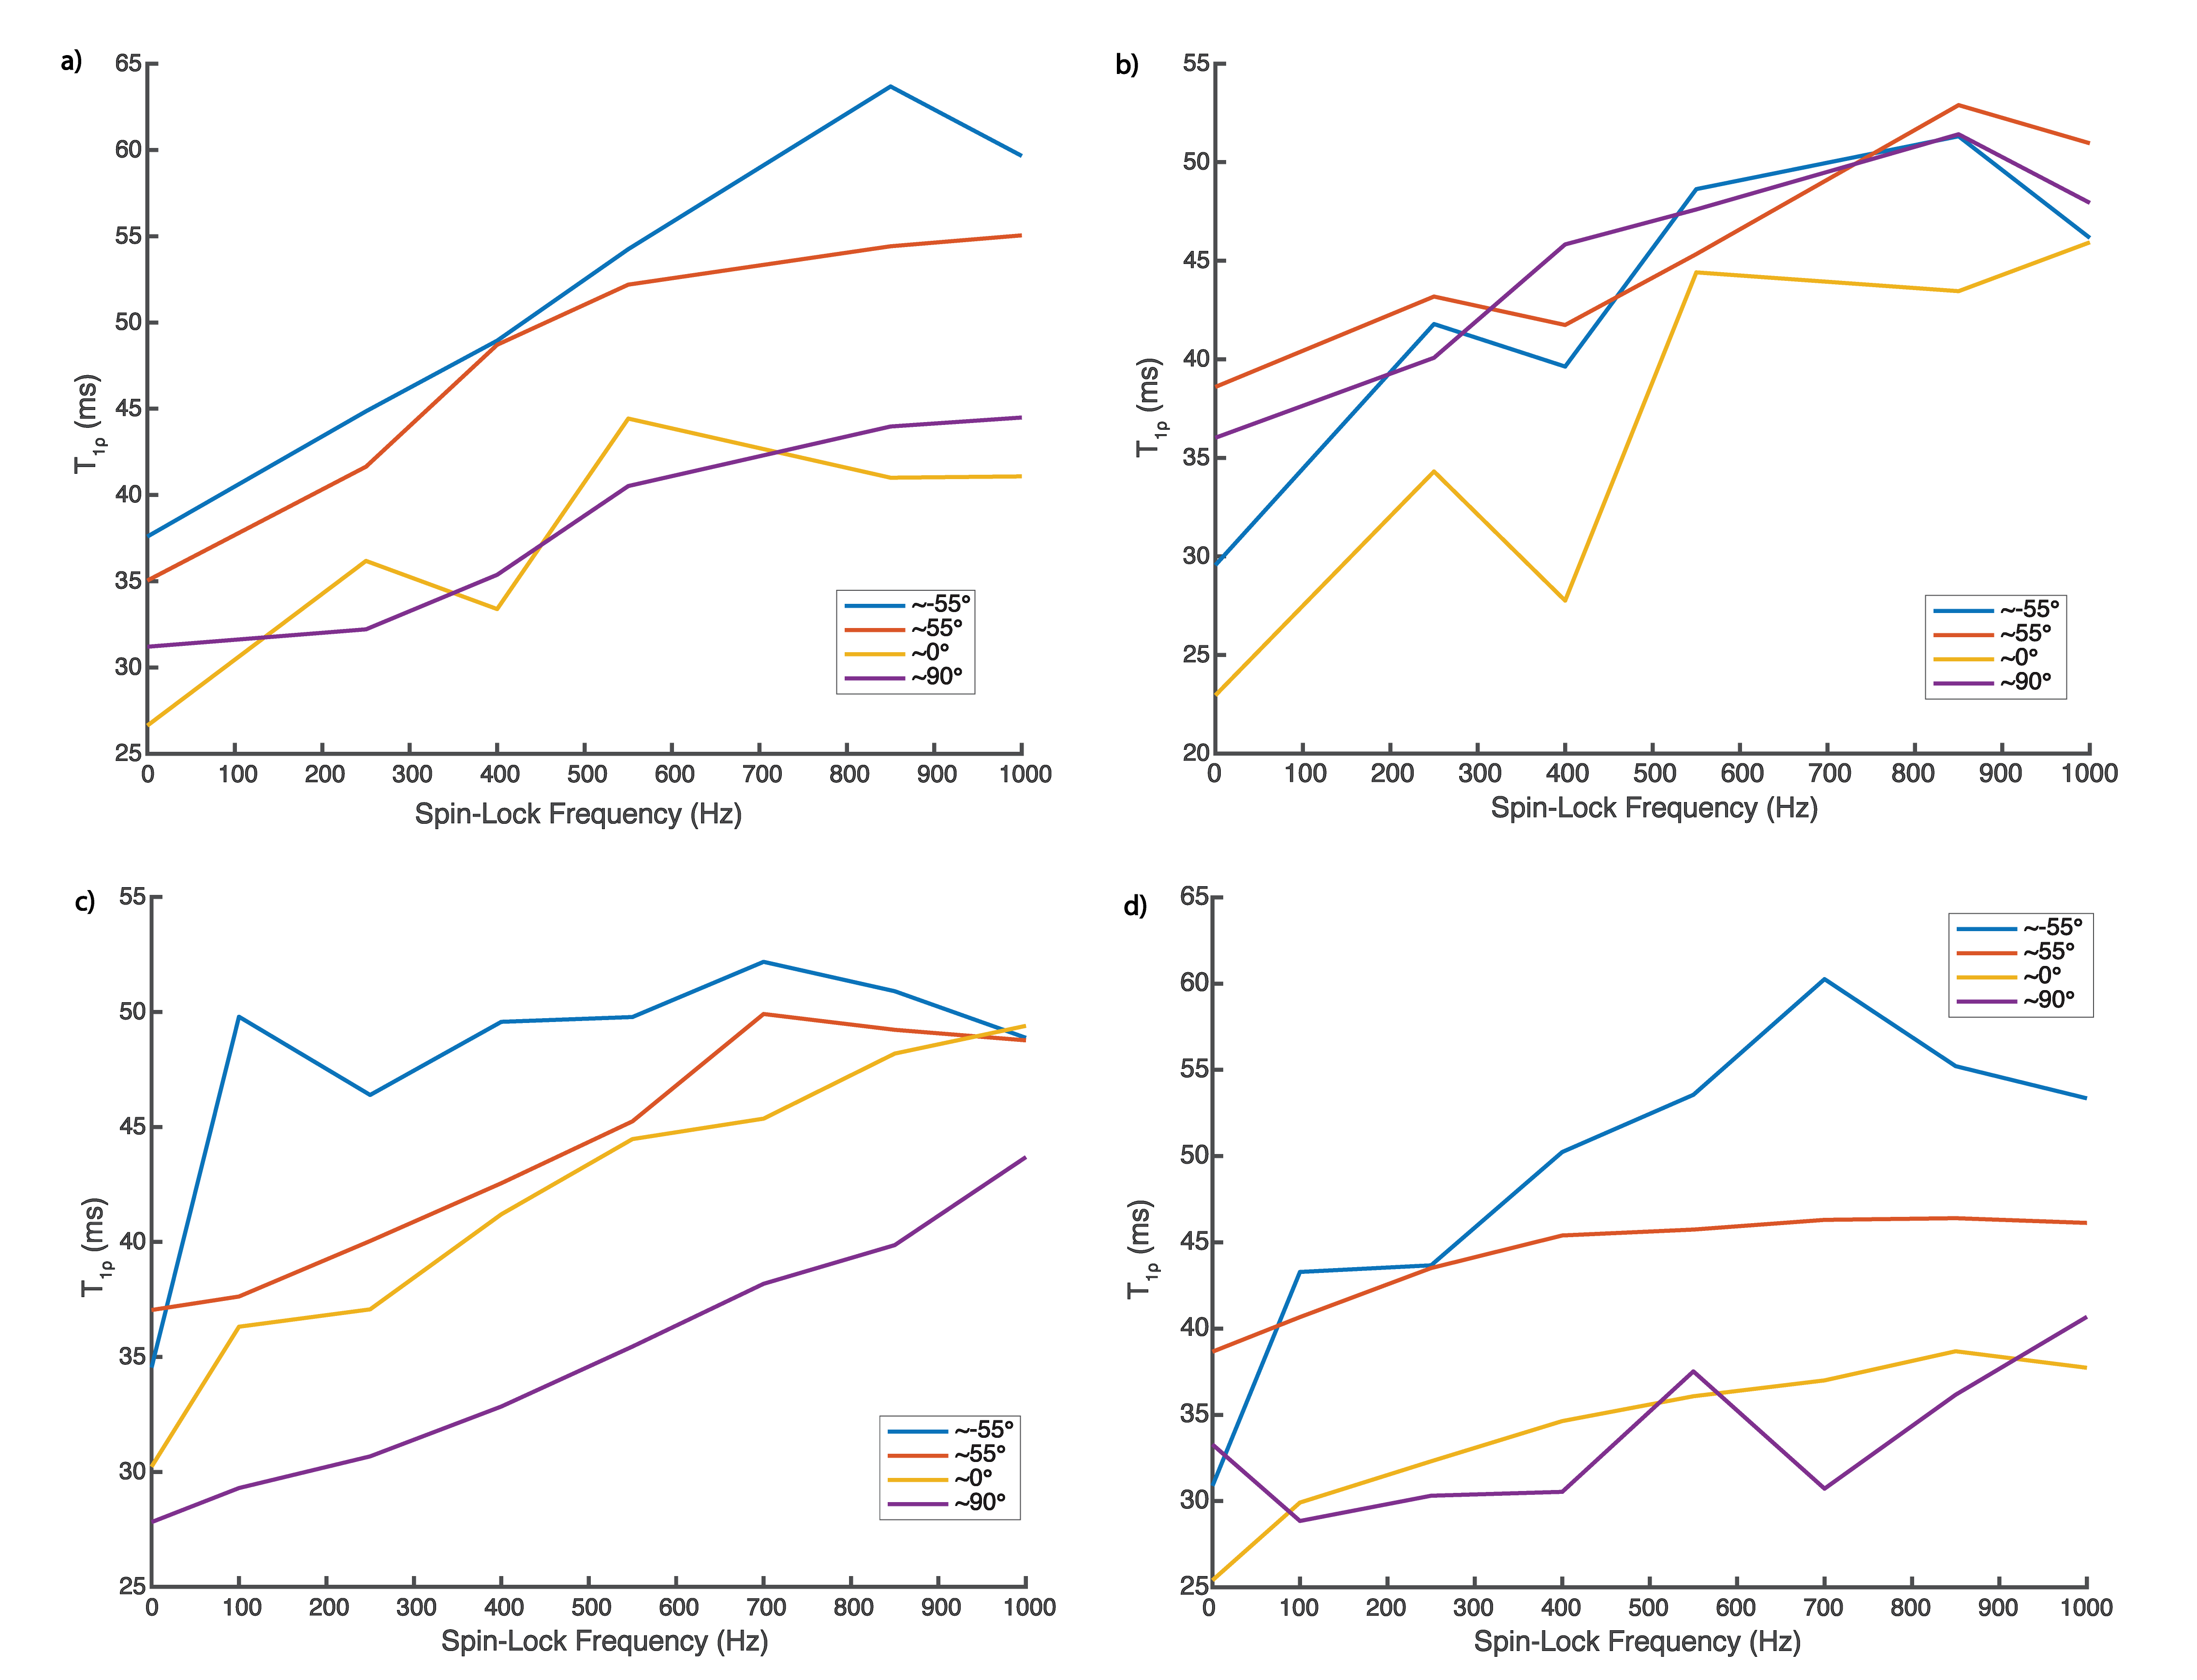
Example slices from the T1rho maps acquired with various FSL values are shown in Figure 3. The AD of T1rho is clearly demonstrated by the regions with higher T1rho values on both sides of each image. The same AD is shown in Figure 4; while the data is noisy, it is clear that for all regions of elevated T2 corresponding to the magic angle, there are corresponding regions of further elevated T1rho for each FSL. The Dispersion curves (Figure 5) similarly show increasing T1rho values for all FSL at the magic angles. They show a noisy but somewhat linear increase in T1rho with increasing FSL.Discussion
There is a noticeable AD in T1rho even with FSL=1kHz. There is a decreased AD for higher FSL values in images 4b/4c, however this is not true in images 4a/4d. This indicates that there may be some decoupling from dipolar effects at higher FSL, or the change could be due to differences in the cartilage in those areas. The fact that the slopes of the dispersion curves (Figure 5) at 0° are, in general, greater than those at magic angles is another possible indication of decoupling from dipolar effects at high FSL.This analysis did not take into account the variation in structural organization between the different regions of articular cartilage meaning that within each angular bin there are collagen fibers with a wide range of orientations. We did not acquire images with sufficient resolution to perform a laminar evaluation of AD. This laminar variation in cartilage collagen orientation may account for the somewhat linear increase seen in the T1rho dispersion curves (Figure 5) instead of the sharp increases we expect. This steady increase could also be due to the noisy nature of the dispersion data. Figure 4 shows that for FSL above 550Hz there is less of a change in T1rho values measured with different FSL than there is for FSL below 550Hz. Indicating that there may be diminishing benefits for FSL above 550Hz.
Conclusion
We have demonstrated evidence of an AD of T1rho with FSLs as high as 1kHz. If there exists a FSL that completely decouples dipolar effects, it is likely be higher than 1kHz.Acknowledgements
This work was funded by grant support from GE Healthcare and NIH grants R01-EB002524-14, K24-AR062068-07, R00 EB022634 and T32-EB009653-10References
1. Nishioka, H., Hirose, J., Nakamura, E., Oniki, Y., Takada, K., Yamashita, Y., & Mizuta, H. (2012). T1ρ and T2 mapping reveal the in vivo extracellular matrix of articular cartilage. Journal of Magnetic Resonance Imaging, 35(1), 147-155.
2. Regatte, R. R., Akella, S. V., Wheaton, A. J., Lech, G., Borthakur, A., Kneeland, J. B., & Reddy, R. (2004). 3D-T1ρ-relaxation mapping of articular cartilage: In vivo assessment of early degenerative changes in symptomatic osteoarthritic subjects1. Academic radiology, 11(7), 741-749.
3. Mlynarik, V., Szomolanyi, P., Toffanin, R., Vittur, F., & Trattnig, S. (2004). Transverse relaxation mechanisms in articular cartilage. Journal of Magnetic Resonance, 169(2), 300-307.
4. Wang, N., & Xia, Y. (2011). Dependencies of multi-component T2 and T1ρ relaxation on the anisotropy of collagen fibrils in bovine nasal cartilage. Journal of magnetic Resonance, 212(1), 124-132.
5. Nozaki, T., Kaneko, Y., Hon, J. Y., Kaneshiro, K., Schwarzkopf, R., Hara, T., & Yoshioka, H. (2016). T1rho mapping of entire femoral cartilage using depth-and angle-dependent analysis. European radiology, 26(6), 1952-1962.
6. Shao, H., Pauli, C., Li, S., Ma, Y., Tadros, A. S., Kavanaugh, A., ... & Du, J. (2017). Magic angle effect plays a major role in both T1rho and T2 relaxation in articular cartilage. Osteoarthritis and cartilage, 25(12), 2022-2030.
7. Sveinsson, B., Chaudhari, A. S., Gold, G. E., & Hargreaves, B. A. (2017). A simple analytic method for estimating T2 in the knee from DESS. Magnetic resonance imaging, 38, 63-70. 8. Witschey II, W. R., Borthakur, A., Elliott, M. A., Mellon, E., Niyogi, S., Wallman, D. J., ... & Reddy, R. (2007). Artifacts in T1ρ-weighted imaging: Compensation for B1 and B0 field imperfections. Journal of magnetic resonance, 186(1), 75-85.
9. Li, X., Han, E. T., Busse, R. F., & Majumdar, S. (2008). In vivo T1ρ mapping in cartilage using 3D magnetization‐prepared angle‐modulated partitioned k‐space spoiled gradient echo snapshots (3D MAPSS). Magnetic Resonance in Medicine: An Official Journal of the International Society for Magnetic Resonance in Medicine, 59(2), 298-307.
10. Arjun D. Desai, Marco Barbieri, Valentina Mazzoli, Elka Rubin, Marianne S. Black, Lauren E. Watkins, … Akshay S. Chaudhari. (2019, February 7). DOSMA: A deep-learning, open-source framework for musculoskeletal MRI analysis (Version v0.0.9 (prerelease)). Zenodo. http://doi.org/10.5281/zenodo.2559549
11. Monu, U. D., Jordan, C. D., Samuelson, B. L., Hargreaves, B. A., Gold, G. E., & McWalter, E. J. (2017). Cluster analysis of quantitative MRI T2 and T1ρ relaxation times of cartilage identifies differences between healthy and ACL-injured individuals at 3T. Osteoarthritis and cartilage, 25(4), 513-520.
Figures