2750
Magnetization Transfer Techniques (MTR and ihMTRex) for Detecting Cartilage Strain in Loaded ex vivo Joints at 7 Tesla1UBC MRI Research Centre, University of British Columbia, Vancouver, BC, Canada, 2Centre for Hip Health and Mobility, University of British Columbia, Vancouver, BC, Canada
Synopsis
We investigated the use of magnetization transfer ratio MTR and ihMTRex as a potential surrogate of cartilage strain, using ex vivo cow knee specimens in a uniaxial compression rig. On MTR and ihMTRex image volumes for several load levels, the cartilage strain and average MTR or ihMTRex for each column of pixels within the cartilage were calculated. Normalized change in MTR showed a linear relation with strain throughout the tested range of deformation, whereas ihMTRex only showed response at the highest load levels. These techniques may be an attractive alternative to T2 or T1ρ techniques to map cartilage strain.
Introduction
Quantitative MRI has been used to detect changes in cartilage biomechanics, in the hopes of characterizing abnormal magnitudes and/or spatial patterns of load, which may provide an early biomarker to osteoarthritis. These techniques include T2 and T1ρ mapping, which reflect changes in cartilage microstructure in response to cartilage deformation1. Magnetization transfer methods, which are sensitive to the macromolecular content of cartilage, may also exhibit signal changes in response to increasing strain. This work describes an initial investigation of these techniques, using ex vivo cow knee specimens under uniaxial compressive loading at 7T. We investigated two potential MT metrics: the standard magnetization transfer ratio (MTR), and an inhomogenous magnetization transfer (ihMT) quantity called ihMTRex as a technique that may be more specific to the collagen fiber component of cartilage, motivated by the success of ihMT in generating contrast in other tissues with dipolar order (most notably myelin)2. Our specific research question is: can MTR and/or ihMTRex be used as a potential surrogate measure of cartilage strain?Methods
A segmented sagittal 3D FLASH sequence was optimized for maximal ihMT cartilage signal, where every four FLASH readouts were interleaved with off-resonant saturation pulses (Δf=14 kHz, fo=500 Hz, two 3ms Hanning pulses separated by 0.3ms, B1rms=11.5 mT, TE/TR = 2.888/65ms, voxel size=62.5x250x1600 μm, NA=2, FLASH flip angle=15o, 3min32sec per volume). Calculation of ihMTRex required five repetitions of this protocol with different saturation schemes: So (no saturation), S+ and S- (single-offset saturation at fo ± Δf) and S± (dual-frequency saturation at fo ± Δf via cosine-modulated Hanning pulse, repeated twice to increase averaging). The image sets were acquired twice with opposing phase encoding polarities and averaged (to account for interleaving-related ghosting), denoised3, and corrected for Gibbs artifact4.MTR (using a subset of the acquired data) and ihMTRex are derived as:
$$ihMTRex = \frac{S_{o}}{2}(2S_{\pm}^{-1}-S_{+}^{-1}-S_{-}^{-1})$$
$$MTR = \frac{1}{2S_{o}}(2S_{0}-S_{+}-S_{-})$$
ihMTRex is based on a subtraction of the signal reciprocals, as opposed to the more commonly used ihMTR value (ihMTR response to load was insignificant; data not shown).
ihMTRex and MTR data was acquired from a previously frozen bovine femoral/tibial condyle pair immersed in PBS within a uniaxial compression rig (7T Bruker scanner with quadrature volume coil). MTR data were acquired for two other condyle pairs (never frozen). MR scans at several compressive strain levels were acquired (starting from unloaded, in increments of displacement of roughly 0.25 mm) until maximum displacement was reached; actuation of compression required removal and subsequent re-insertion of the rig from the scanner and thus, image volumes between load levels were manually registered and segmented for cartilage. Cartilage thickness was measured from MR image data (62.5 mm resolution; unloaded thickness ranging from 1-1.5 mm), estimated as the height of each ‘column’ of voxels of the segmented cartilage. Strain of each ‘column’ was calculated as:
$$\epsilon = \frac{thickness_{loaded}-thickness_{unloaded}}{thickness_{unloaded}}$$
MTR and ihMTRex values along the same column of pixels were averaged and used to calculate change in metric ∆MTRnorm and ∆ihMTRexnorm , normalized to unloaded value.
Results
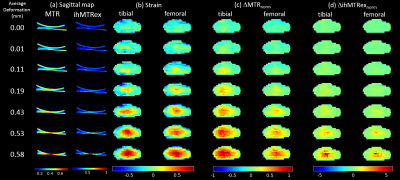
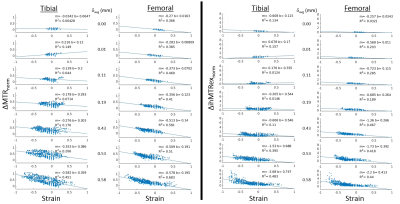
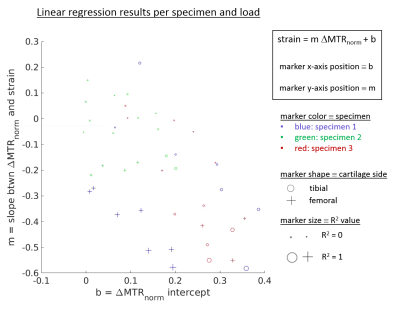
Figure 1 shows results for the first specimen at several compression levels, with sagittal ihMTRex and MTR maps in column (a). Measured strain and the average ∆MTRnorm or ∆ihMTRexnorm along a cartilage column were collapsed into axial “projection” images for the tibial/femoral cartilage separately (Figure 1b-d). Both metrics show spatial distributions that are similar to the strain distribution, but ∆ihMTRexnorm only shows response at the highest loads where the strain may be considered non-physiological. ∆MTRnorm and ∆ihMTRexnorm increase monotonically with increasing strain magnitudes (Figure 2), with a higher degree of linearity found between ∆MTRnorm and strain, as evidenced by higher R2. In contrast, the ∆ihMTRexnorm response remains flat until the last two load levels, where it rapidly increases nonlinearly to 600-800% of baseline value at the highest load level. The discrete nature of the strain values originates from the resolution of the thickness measurement (steps of 62.5 μm). The variability in the data may be related to manual segmentation errors, variation of baseline MTR or ihMTRex over different cartilage regions, and depth-dependent behavior that is obscured by the column-wise averaging. Figure 3 shows a summary of regression results for ∆MTRnorm vs. strain across all three specimens. The second and third specimen exhibited smaller correlations than the first dataset, likely related to the smaller range of strain values studied (the specimen cartilage was thinner and thus less able to support the same level of displacement). Overall, the femoral cartilage produced a more linear response between MTR and strain than tibial cartilage, with slopes varying in the range between roughly 0.3 to 0.5.Discussion and Conclusions
We have demonstrated the use of MTR as a potential surrogate measure of cartilage strain, whereas ihMTRex showed less promise due to its response being limited to unphysiological strain levels. The linearity between strain and ∆MTRnorm could be explained by MTR’s sensitivity to the macromolecular volume fraction: as strain increases, the density of macromolecules would also increase by a proportionate amount. The robust dynamic range, linearity of response, and relative simplicity of the sequence may make MTR an attractive alternative to existing MR techniques that measure cartilage strain, and therefore this method offers exciting promise and should be explored further.Acknowledgements
This work is supported by the Canadian Institutes of Health Research.References
1. Rossom et al. Knee Cartilage Thickness, T1ρ and T2 Relaxation Time Are Related to Articular Cartilage Loading in Healthy Adults. PLoS One. 2017 Jan 11;12(1):e0170002
2. Duhamel G et al. Validating the sensitivity of inhomogeneous magnetization transfer (ihMT) MRI to myelin with fluorescence microscopy. Neuroimage. 2019;199:289-303.
3. Coupe P et al. An optimized blockwise nonlocal means denoising filter for 3-D magnetic resonance images. IEEE Trans Med Imaging. 2008;27(4):425-41.
4. Kellner E et al. Gibbs-ringing artifact removal based on local subvoxel-shifts. Magn Reson Med. 2016;76(5):1574-1581.
Figures


