2749
Inhomogenous Magnetization Transfer Imaging in Cartilage – Initial Demonstration and Protocol Optimization at 7 Tesla1UBC MRI Research Centre, University of British Columbia, Vancouver, BC, Canada, 2Centre for Hip Health and Mobility, University of British Columbia, Vancouver, BC, Canada
Synopsis
This work presents one of the first examples of ihMT imaging in cartilage, using ex vivo bovine knee specimens at 7 Tesla. Protocol optimization experiments were performed to determine the optimal set of parameters (B1rms, TR, frequency offset, centre frequency) to maximize the ihMTRex signal. Cartilage-specific signal was observed, which may be related to residual dipolar order established by the highly ordered nature of collagen.
Introduction
The potential of inhomogenous magnetization transfer (ihMT) imaging has been primarily demonstrated in CNS tissue, where the long-lived dipolar coupling within the myelin bilayer produces myelin-specific contrast1. Other tissues with dipolar order have also been shown to exhibit ihMT signal, including skeletal muscle2, tendon and intervertebral disc3. In particular, a preliminary study of cartilage using solid state NMR spectroscopy demonstrated the presence of dipolar order4. We present one of the first demonstrations of ihMT imaging in articular cartilage, using bovine knee specimens. Protocol optimization experiments were performed to determine the optimal set of parameters to maximize the ihMT signal at 7 Tesla.Methods
Protocol optimization was performed on a femoral cartilage condyle of a previously frozen cow knee cartilage specimen immersed in PBS at room temperature; an additional femoral/tibial condyle pair was subsequently imaged with the optimized protocol and higher resolution. Five image sets were acquired: So (no saturation), S+ and S- (single-offset saturation) and S± (dual-frequency saturation via cosine-modulated pulse, repeated twice to increase averaging). ihMTR and ihMTRex were calculated as:$$ihMTR = \frac{1}{2S_{o}}(2S_{\pm}-S_{+}-S_{-})$$ $$ihMTRex = \frac{S_{o}}{2}(2S_{\pm}^{-1}-S_{+}^{-1}-S_{-}^{-1})$$
ihMTRex has been shown to produce a more linear relation with saturation power5.
A segmented 3D FLASH sequence was used, where every saturation train is interleaved with four FLASH readouts to accelerate the imaging. Persistent sequence parameters include: NA = 2, FLASH flip angle = 15o, TE = 2.888 ms, 64x64x32 matrix, 20x60x60 mm FOV, two Hanning pulses per saturation train separated by 0.3 ms, cosine-modulated peak B1 increased by 3dB to make B1rms equal to single-offset saturation. Each of the five image sets was acquired twice with opposing phase encoding polarities and averaged, to account for T1-related ghosting due to the saturation/readout interleaving. All component images underwent denoising6 and Gibbs artifact reduction7.
Results
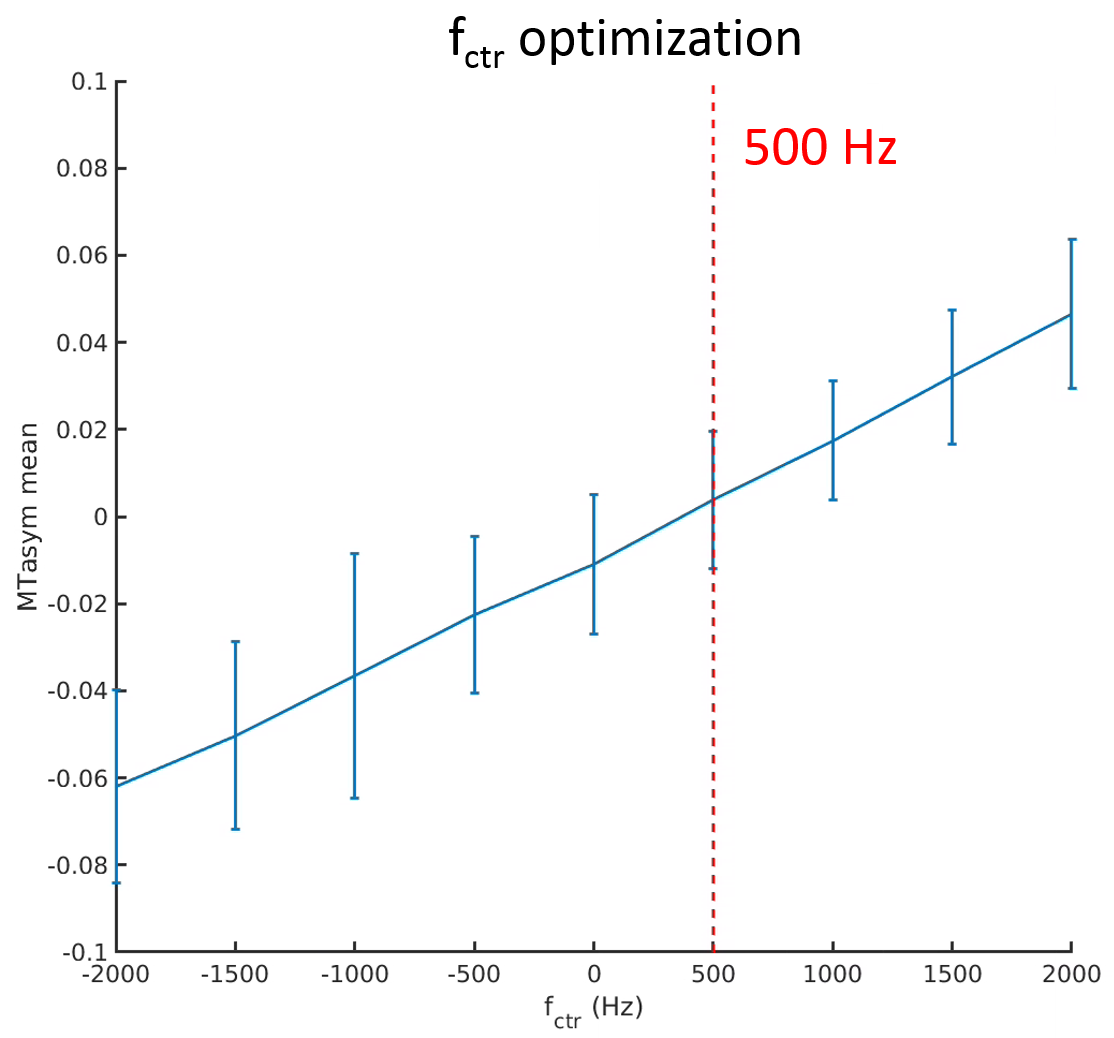
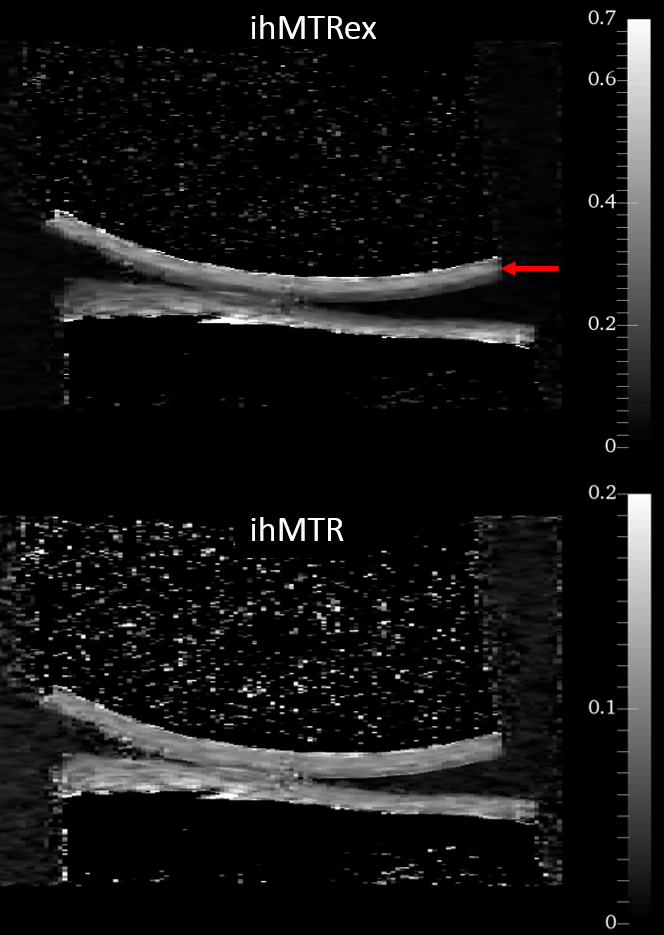
Figures 1 to 4 show the averages and standard error of the ihMT metrics in cartilage during protocol optimization of B1rms (averaged over TR), saturation frequency offset, TR, and frequency center (midpoint between positive and negative frequencies), respectively. The dashed line denotes the chosen setpoint (for maximal ihMTRex) for the parameter under test. Several pulse widths were explored during the B1rms optimization (Figure 1), with longer pulses allowing higher B1rms but reduced energy deposition density. A 3 ms pulse produces higher signal than 2 ms and 4 ms pulses, with a setpoint of approximately 11.5 uT resulting in a relatively flat signal maxima in ihMTRex and ihMTR (<10% signal difference within ±2 µT range). The 3 ms power optimization was repeated 11 hours after the first series, demonstrating a slight increase in signal but resulting in the same optimum. Variation of frequency offset (Figure 2) reveal a weak signal dependence around the optimal setpoint, which differs for ihMTRex and ihMTR (14-15 kHz vs 16-17 kHz, respectively). Signal variance also increased with frequency offset. Variation of TR (Figure 3) shows that the energy deposition density was optimal at TR=65 ms. Finally, the MT asymmetry ratio ((S+ - S-)/So) was minimized when the centre frequency was adjusted to 500 Hz, which should be used to avoid contamination of the ihMT metrics. Figure 5 shows a higher resolution scan (62.5x250x1600 um in 17min41sec) with the optimized protocol (B1rms per TR=11.5 µT, frequency offset = 14 kHz, centre frequency = 500 Hz, TR = 65 ms), showing high signal specificity in cartilage. Average ihMTR and ihMTRex values were similar in the tibial and femoral cartilage (tibial: ihMTRex = 0.28±0.11 and ihMTR = 0.10±0.03; femoral: ihMTRex = 0.31±0.11 and ihMTR = 0.10±0.03) Depth dependent signal changes on the femoral side can be clearly observed in the ihMTRex map, with lower signal levels at the cartilage surface which may reflect the zonal anatomy of articular cartilage (red arrow in Figure 5).Discussion and Conclusions
We have demonstrated one of the first examples of ihMT imaging in cartilage, with contrast reflecting the zonal nature of the knee cartilage. ihMTR produces image contrast that is more dependent on sequence parameters (notably TR and flip angle), which may explain its inability to show contrast along the cartilage depth. The protocol optimization presented here suggests that signal change is relatively small around the optimal setpoints, which increase the technique’s practicability. We expect that cartilage ihMT acquisition is only feasible using cosine-modulated saturation (i.e. no T1d filtering), due to the sub-millisecond dipolar relaxation time T1d found in spectroscopy studies [4]. Because of its high sensitivity for the residual dipolar coupling, the source of the ihMT signal in cartilage may be related to the highly ordered nature of collagen, which consists of large, immobile protein chains arranged in triple helices, which are further arranged in fibrillar bundles. Any interruption to this order could reduce the ihMT signal, which may make it useful for detection of cartilage degradation. Specificity of the cartilage ihMT signal may be hampered by the wide range of collagen orientation within articular cartilage, since ihMT has been shown to be sensitive to orientation with respect to B08. Further work in pathological specimens should be performed to assess its potential to detect cartilage degradation, in comparison to more established techniques such as T1ρ or T2 mapping.Acknowledgements
This work has been supported by the Canadian Institutes for Health Research.References
1. Duhamel G et al. Validating the sensitivity of inhomogeneous magnetization transfer (ihMT) MRI to myelin with fluorescence microscopy. Neuroimage. 2019;199:289-303.
2. Prevost VH et al. Optimization of inhomogeneous magnetization transfer (ihMT) MRI contrast for preclinical studies using dipolar relaxation time (T1D ) filtering. NMR Biomed. 2017;30(6).
3. Varma G et al. Towards short dipolar relaxation time, T1D, MRI. ISMRM 2018, 8474.
4. Swanson et al. Molecular, dynamic, and structural origin of inhomogeneous magnetization transfer in lipid membranes. Magn Reson Med. 2017;77(3):1318-1328.
5. Varma G et al. Extracting a robust inhomogeneous magnetization transfer (ihMT) rate parameter, ihMT-Rex. ISMRM 2015, 3357.
6. Coupe P et al. An optimized blockwise nonlocal means denoising filter for 3-D magnetic resonance images. IEEE Trans Med Imaging. 2008;27(4):425-41.
7. Kellner E et al. Gibbs-ringing artifact removal based on local subvoxel-shifts. Magn Reson Med. 2016;76(5):1574-1581.
8. Girard O et al.
Anisotropy of inhomogeneous Magnetization Transfer (ihMT) in White
Matter. ISMRM 2017, 0472.
Figures
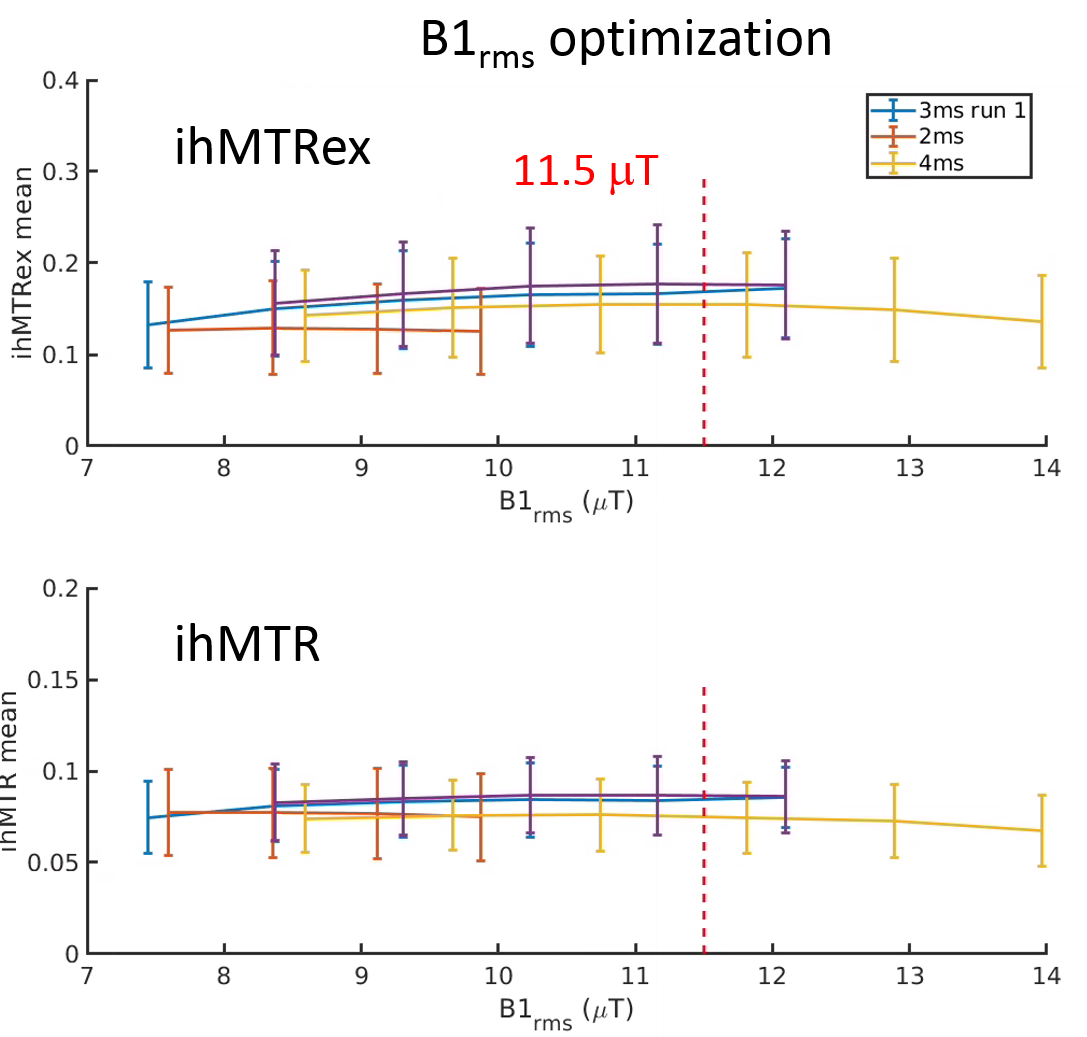
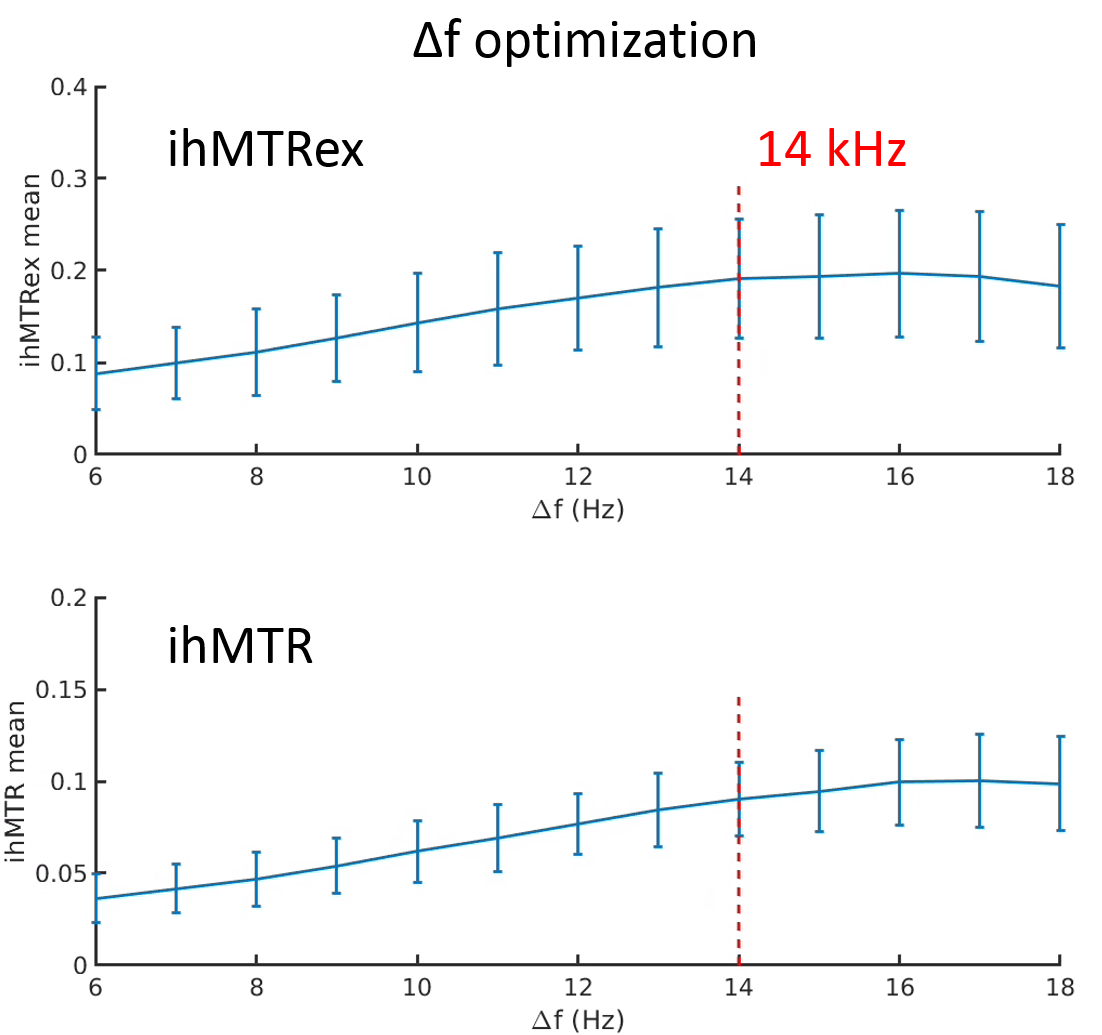
Fig. 2. Optimization of frequency offset to maximize ihMTRex (base protocol, B1rms = 11.5 μT).