2747
Comparison between high-resolution DESS images of the hip joint at 3T and 7T MRI1School of Information Technology and Electrical Engineering, The University of Queensland, Brisbane, Australia, 2Mark and Mary Stevens Neuroimaging and Informatics Institute, University of Southern California, Los Angeles, CA, United States, 3ARC Training Centre for Innovation in Biomedical Imaging Technology, The University of Queensland, Brisbane, Australia, 4CSIRO Health and Biosecurity, Herston, Australia, 5School of Human Movement and Nutrition Sciences, The University of Queensland, Brisbane, Australia
Synopsis
Advances in automatic segmentation of cartilage in hip joints has shown the need for high resolution and contrast in 3D sequences. In this work, double-echo steady-state (DESS) hip images from a healthy volunteer were compared at 3T and 7T. 3D-DESS with a resolution up to 0.4x0.4x0.6mm3 was acquired, and showed that the 7T images had superior anatomical detail, signal-to-noise ratio (SNR), contrast ratio (CR) and overall image quality. The improvements observed in 7T imaging of the hip have the potential to boost the performance of automated cartilage segmentation algorithms by reducing segmentation errors.
Introduction
Magnetic resonance imaging (MRI) is well suited for quantitative analysis of the musculoskeletal tissues comprising the hip joint1,2. In particular, the segmentation of joint cartilage offers a clinically appealing technique for assessing and monitoring pathoanatomical conditions such as osteoarthritis using existing 3T MRI systems3. However, the 3D MRI sequences most effective for cartilage segmentation, such as water-excited double-echo steady-state (we-DESS), require reliable automated segmentation techniques to process the large number of images from each patient examination. However, low contrast-to-noise ratio (CNR) may introduce errors between segmentation of cartilage, synovial fluid and ligamentous tissues4. High-resolution data is preferred to identify the highly curved, closely coupled femoral and acetabular cartilages in the hip. Although ultra-high field (UHF) MRI has the potential to improve the reliability of musculoskeletal imaging5 and thus automated joint cartilage segmentation, there is a lack of research in this area for 7T MRI given the scarcity of dedicated radiofrequency coils for UHF systems, issues with RF homogeneity and efficiency and challenges of generating images with high tissue contrast6-8. In this work, we compare 3T and 7T images of the hip cartilages acquired across a number of different spatial resolution. Parallel transmit (pTx) techniques were used at 7T in efforts to overcome many of the above UHF MRI challenges.Methods
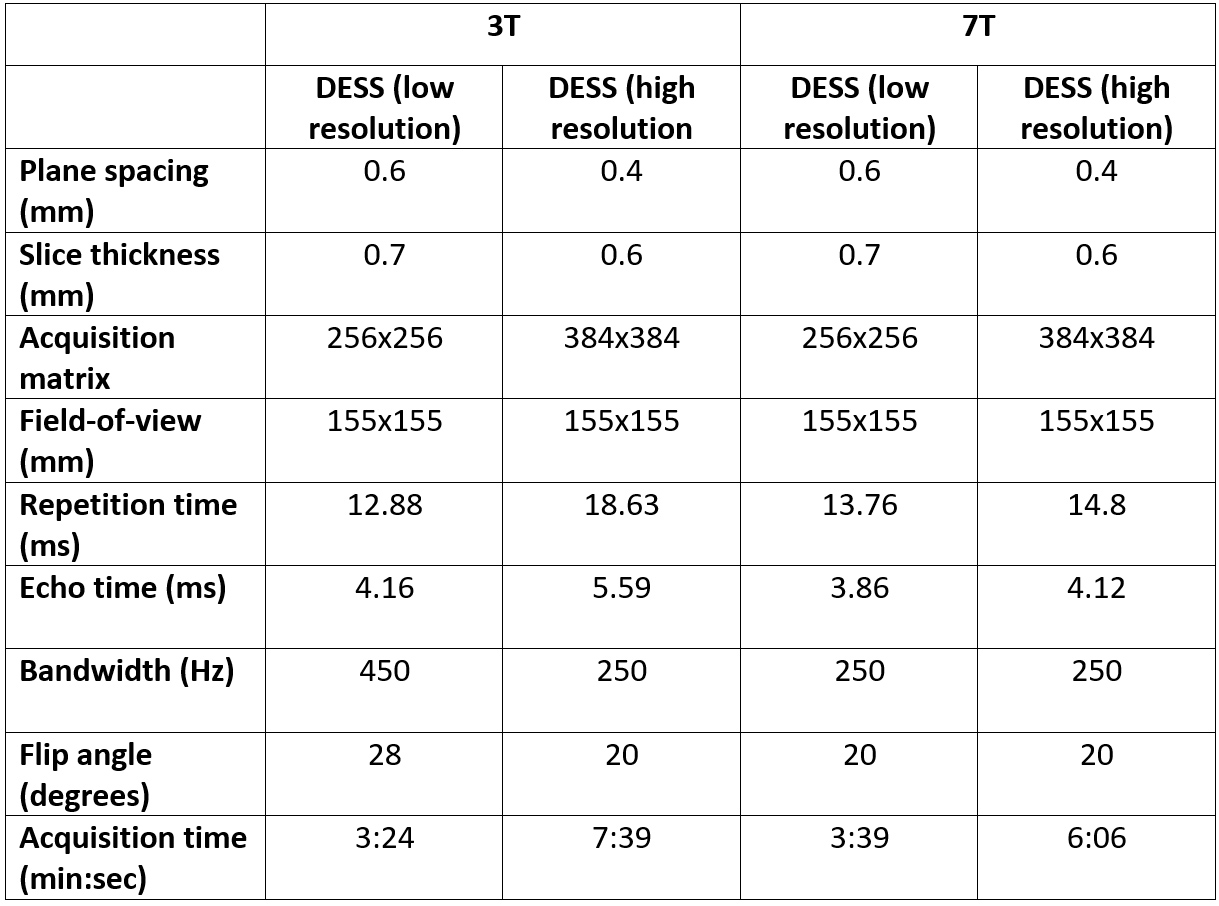
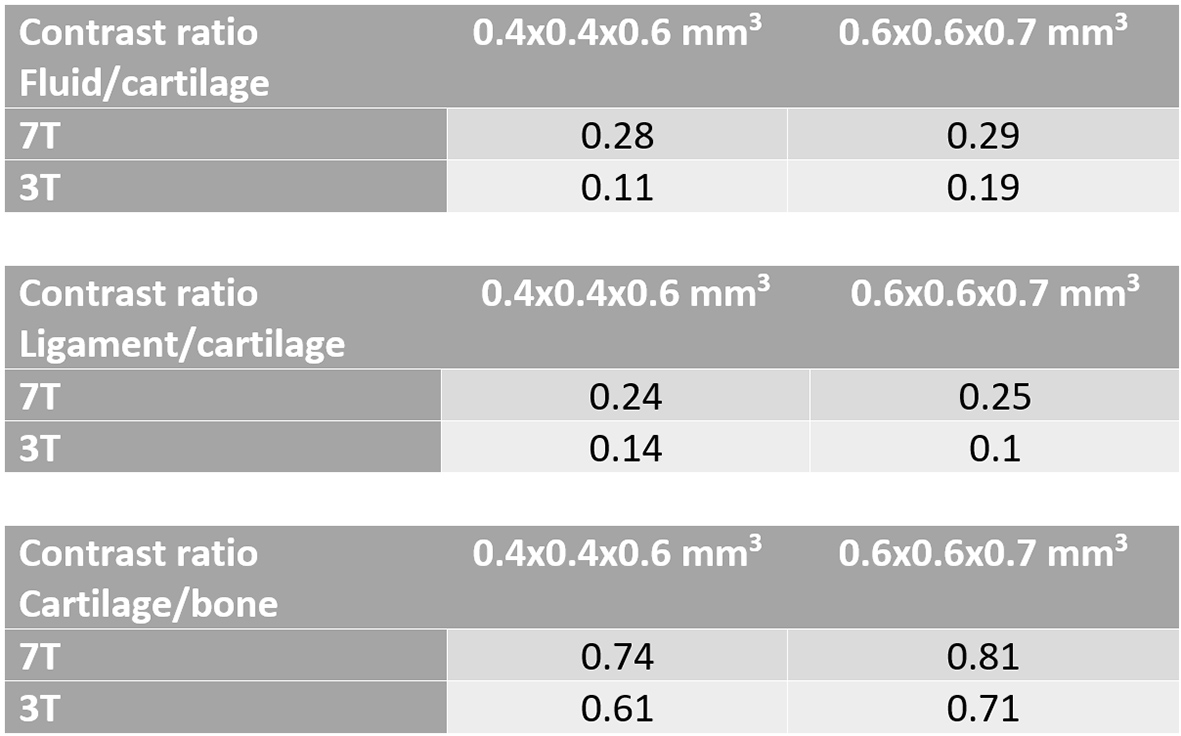
Comparative 3T and 7T MRI was performed on a healthy volunteer (Age: 54Y, Mass: 75 kg). The 3T images were acquired on a MAGNETOM Prismafit (Siemens Healthcare, Erlangen, Germany), using an 18-channel coil array placed anteriorly and a posteriorly located 32-channel spine receive coil array. The 7T images were acquired on a research system (Siemens Healthcare, Erlangen, Germany), using a prototype eight-channel pTx transceiver RF coil for unilateral hip imaging (modified from a previous work6). A custom code was implemented for phase only B1-shimming to increase the B1 efficiency and uniformity. Virtual observation points were used to limit the 10g-averaged specific absorption rate (SAR10g)9, and were based on simulations done in Sim4Life (ZMT, Switzerland).Comparison between 3T and 7T MRI were made using 3D we-DESS images due to their enhanced bone-cartilage and cartilage-synovial contrasts. Images were acquired at a resolution used in previous 3T studies (0.6x0.6x0.7mm3) and at a higher resolution (0.4x0.4x0.6mm3) at 3T and 7T. Due to the reduction of synovial signal in DESS at high resolution, a modified version was used with spoiler gradients in the slice direction10. Table 1 shows the parameters used at the different field strengths. Pre-scan normalization was used at 3T, but was not applicable at 7T due to the absence of a volume transmit coil. For this reason, the signal-to-noise ratio (SNR) and CNR cannot be directly compared between systems. Thus, the contrast ratio (CR) was used as indicator of contrast performance11, defined as (SignalA – SignalB)/(SignalA – SignalB), where the signals were averaged over a representative region for different pairs of tissues: synovial fluid/cartilage (CRFC), ligament/cartilage (CRLC), cartilage/bone (CRCB).
Results
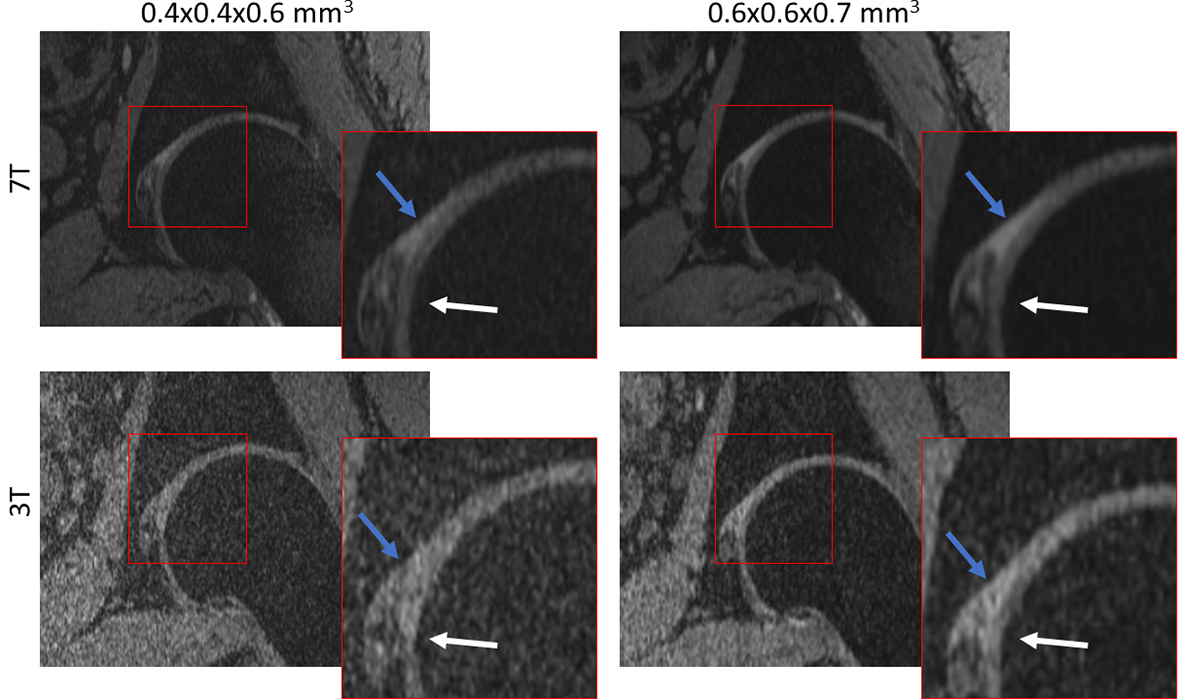
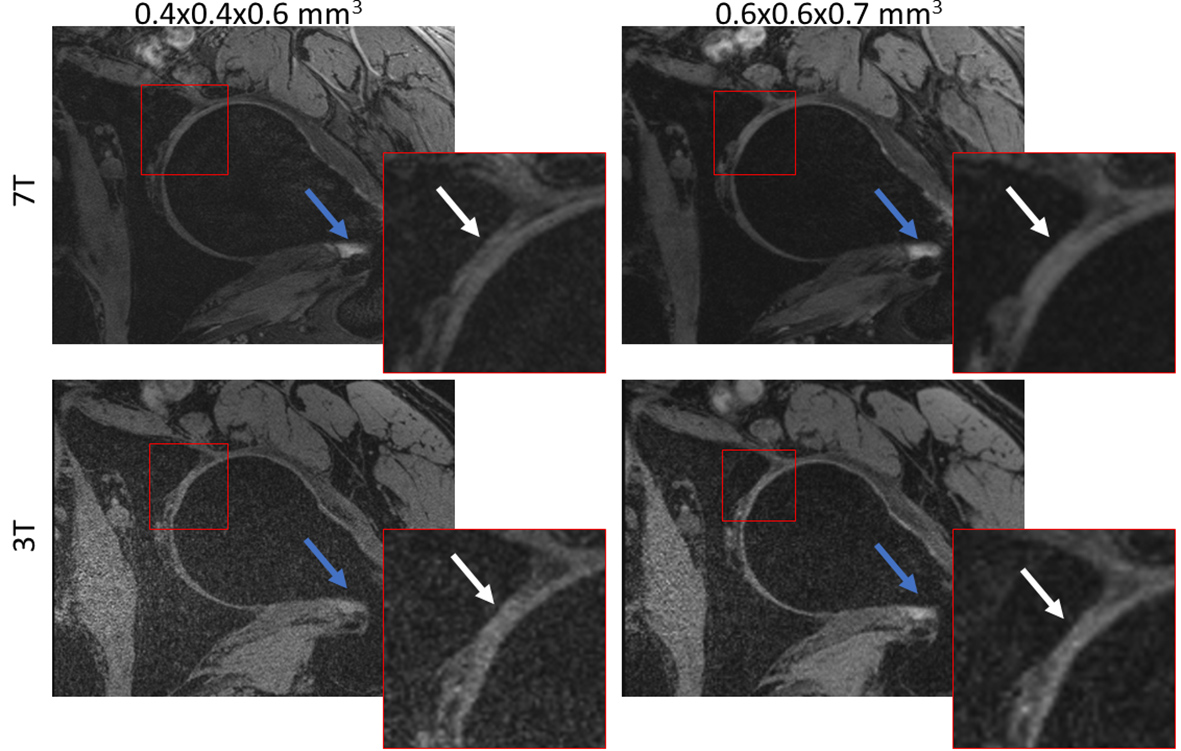
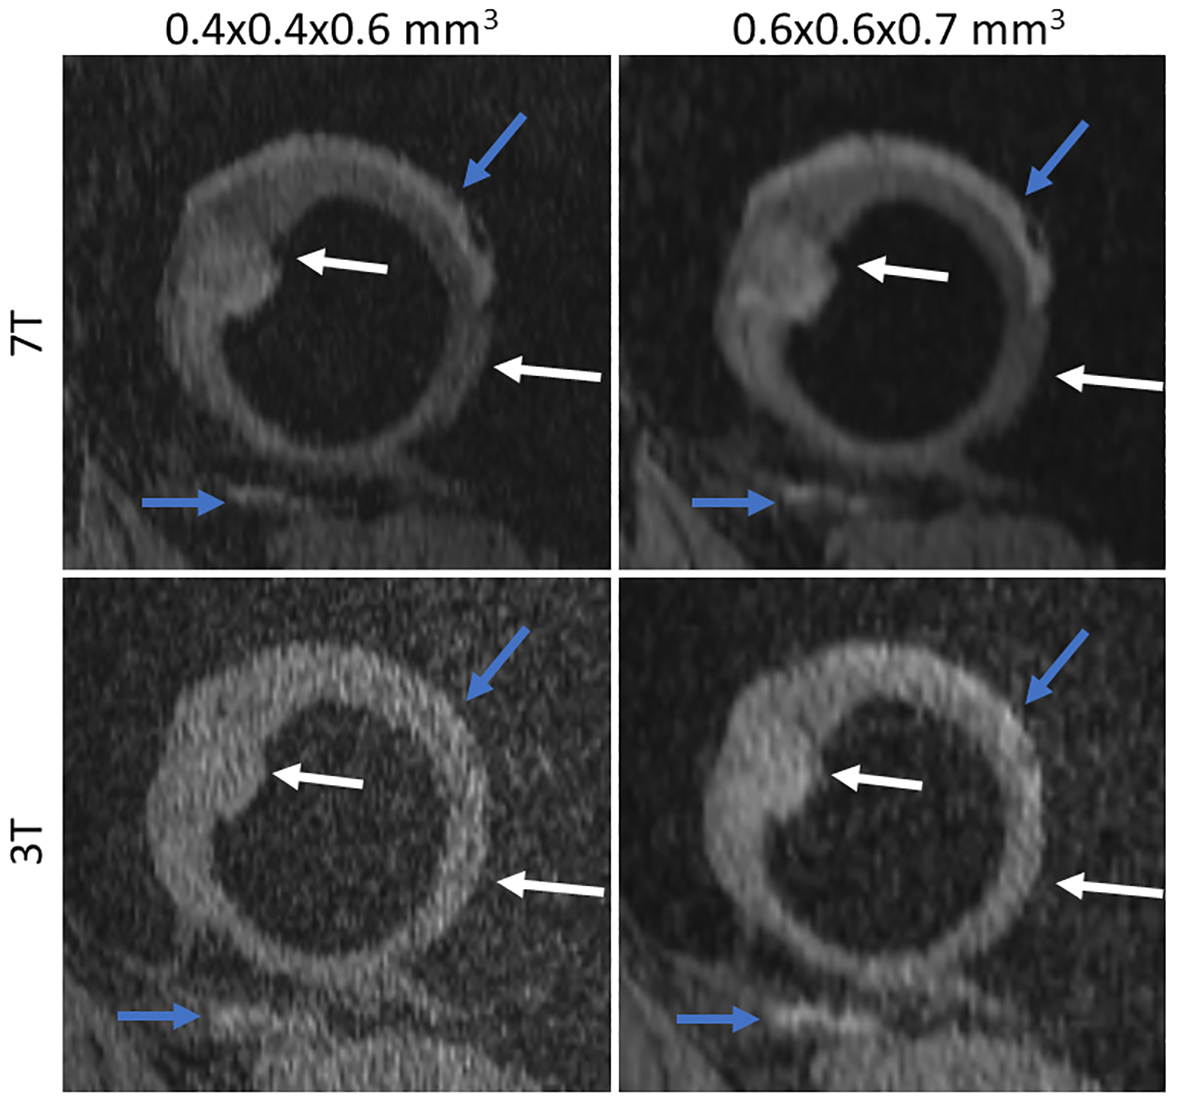
Figures 1 to 3 show comparisons between the 3T and 7T we-DESS images at the two different spatial resolutions. After the custom designed B1 shimming algorithm was applied, no B1-inhomogeneity was observed adjacent to the hip joint, attesting to the feasibility and practicality of using 7T pTx for hip imaging. In addition, the SAR10g was maintained well below the limits recommended by the IEC12.Qualitative assessments of the we-DESS images showed that there was substantially less noise present at 7T compared with 3T, providing visual enhancement of the overall image quality in all cases. Similarly, visual inspections of the contrast between tissues and anatomical details demonstrated the superiority of 7T over 3T. There was a more distinct separation between the femoral and acetabular cartilages in the 7T images compared to 3T (Figure 1). In addition, the contrast between the synovial fluid/cartilage and ligament/cartilage were improved at 7T (Figures 2 and 3). These qualitative assessments were confirmed by measurements of the CR, which was better at 7T compared with 3T in all images with an average increase of 77%, and up to 154% for the high resolution CRFC.
Discussion and Conclusion
In this work, acquisition of we-DESS images with a resolution of 0.4x0.4x0.6mm3 was successfully undertaken at 7T. In comparison with 3T MRI, the 7T images had superior anatomical detail, SNR, CR and overall image quality. At 7T, the high-resolution 3D we-DESS images were acquired in ~6 minutes which would likely be acceptable for dedicated clinical studies of cartilage in the hip joint (and other major joints). Such improvements have the potential to enhance the performance of automated cartilage segmentation algorithms whereby the combination of high-resolution images with enhanced contrast between all joint tissues offers a basis for the reduction of segmentation errors. However, there has been little work on the development of automated cartilage segmentation from 7T images and, rather than a perfunctory application of current algorithms trained on 3T data, there needs to be well controlled training and implementation of automated segmentation algorithms for 7T. Future studies will evaluate the potential of high-resolution 7T MRI of the hip for enhanced examination of joint cartilage (and other musculoskeletal elements) in prodromal or symptomatic semi-acute or chronic disease states associated with various joint pathologies.Acknowledgements
The authors acknowledge Dr Rahel Heule and Dr Oliver Bieri for providing the DESS sequence used in this study. This work received funding from the ‘MR Hip Intervention and Planning System to enhance clinical and surgical outcomes’ NHMRC Development Grant. Aurelien Destruel acknowledges ZMT for providing the free academic license of the software Sim4Life.References
1. Alizai H, Chang G, Regatte RR. MRI of the Musculoskeletal System: Advanced Applications using High and Ultrahigh Field MRI. Semin Musculoskelet Radiol 2015;19(4):363-374.
2. Shapiro L, Harish M, Hargreaves B, Staroswiecki E, Gold G. Advances in musculoskeletal MRI: technical considerations. J Magn Reson Imaging 2012;36(4):775-787.
3. Xia Y, Fripp J, Chandra SS, Schwarz R, Engstrom C, Crozier S. Automated bone segmentation from large field of view 3D MR images of the hip joint. Physics in Medicine and Biology 2013;58(20):7375-7390.
4. Xia Y, Chandra SS, Engstrom C, Strudwick MW, Crozier S, Fripp J. Automatic hip cartilage segmentation from 3D MR images using arc-weighted graph searching. Physics in Medicine and Biology 2014;59(23):7245-7266.
5. Jin J, Weber E, Destruel A, O’Brien K, Henin B, Engstrom C, Crozier S. An open 8-channel parallel transmission coil for static and dynamic 7T MRI of the knee and ankle joints at multiple postures. Magnetic Resonance in Medicine 2018.
6. Jin J, Weber E, O'Brien K, Destruel A, Henin B, Engstorm C, Crozier S. An 8-channel pTx transceive coil for hip imaging at 7 T. 2017; Proceedings of the 25th Annual Meeting of ISMRM, Honolulu, HI, USA.
7. Theysohn JM, Kraff O, Theysohn N, Orzada S, Landgraeber S, Ladd ME, Lauenstein TC. Hip imaging of avascular necrosis at 7 Tesla compared with 3 Tesla. Skeletal Radiology 2014;43(5):623-632.
8. Chang G, Deniz CM, Honig S, Egol K, Regatte RR, Zhu YD, Sodickson DK, Brown R. MRI of the Hip at 7T: Feasibility of Bone Microarchitecture, High-Resolution Cartilage, and Clinical Imaging. Journal of Magnetic Resonance Imaging 2014;39(6):1384-1393.
9. Eichfelder G, Gebhardt M. Local Specific Absorption Rate Control for Parallel Transmission by Virtual Observation Points. Magnetic Resonance in Medicine 2011;66(5):1468-1476.
10. Bieri O, Ganter C, Scheffler K. On the fluid-tissue contrast behavior of high-resolution steady-state sequences. Magn Reson Med 2012;68(5):1586-1592.
11. Lazik-Palm A, Kraff O, Johst S, Quick HH, Ladd ME, Geis C, Korsmeier K, Landgraeber S, Theysohn JM. Morphological and Quantitative 7 T MRI of Hip Cartilage Transplants in Comparison to 3 T-Initial Experiences. Invest Radiol 2016;51(9):552-559.
12. International Electrotechnical Commission: Medical electrical equipment, Part 2: particular requirements for the basic safety and essential performance of magnetic resonance equipment for medical diagnosis2010.
Figures