2746
Improving DESS contrast in 7T hip images using L1-norm denoising and optimal echo combination1School of Information Technology and Electrical Engineering, The University of Queensland, Brisbane, Australia, 2School of Human Movement and Nutrition Sciences, The University of Queensland, Brisbane, Australia, 3University of Southern California, Los Angeles, CA, United States, 4Siemens Healthcare Pty Ltd, Brisbane, Australia, 5High Field Magnetic Resonance, Max Planck Institute for Biological Cybernetics, Tübingen, Germany, 6Division of Radiological Physics, Department of Radiology, University Hospital Basel, Basel, Switzerland
Synopsis
The double-echo steady-state (DESS) sequence has been used successfully in 3T MRI imaging of the musculoskeletal system for segmentation of joint. However, in 3D-DESS images acquired at 7T MRI, a reduction in the contrast between tissues due to an increased diffusion sensitivity may complicate cartilage segmentation. Typically, the signals acquired with DESS are averaged without any pre-processing. However, these signals give different contrasts and have different noise behaviours. In this work, we improve the contrast-to-noise ratio (CNR) whilst preserving anatomical detail in high-resolution 7T DESS images through a new approach combining L1-norm denoising and p-norm combination of the echo signals.
Introduction
The clinical assessment of pathoanatomical conditions of hip joint cartilages, such as osteoarthritis, can be enhanced by automated segmentation and quantitative analyses of hip joint cartilages from magnetic resonance imaging (MRI). High resolution 3D sequences such as double-echo steady-state (DESS) are beneficial to facilitate the separation of the femoral and acetabular cartilages, which are thin and highly curved, and a high contrast-to-noise ratio (CNR) is required to reduce segmentation errors between joint cartilage, ligamentous structures and synovial fluid1,2. Ultra-high field (UHF) MRI has the capacity to provide high resolution images to allow improved spatial segmentations of joint cartilage, however there is the potential for better processing of current 3D-DESS images at 7T3. Specifically, the two echoes acquired during the DESS sequence, PSIF (high contrast, low signal-to-noise ratio (SNR)) and FISP (high SNR, low contrast) are typically averaged without any pre-processing4, which does not use the full potential of their individual features3. In this work, we developed a new approach to improve the contrast in 7T hip DESS images through combined application of L1-norm denoising and a p-norm combination of the echo signals.Methods
Images of the hip joint were acquired on a 7T research system (Siemens Healthcare, Erlangen, Germany) using a prototype radiofrequency pTx hip coil modified from a previous work5. The eight-channel coil allowed unilateral hip imaging, while B1-shimming6 and virtual observation points7 were used to improve the B1-field and limit the 10g-average specific absorption rate (SAR10g)8, respectively. In line with the UHF capabilities of 7T MRI, high-resolution 3D water-excited DESS (we-DESS) images were obtained with an acquired resolution of 0.4x0.4x0.6mm3 (sequence parameters given in Figure 2 caption). To mitigate the decrease in tissue contrast with high resolutions, a modified DESS sequence was used to allow spoiler gradients in the slice direction9.Images were imported in Matlab (MathWorks, MA, USA) for post-processing. The effect of denoising the PSIF and FISP images before combination was investigated. L1-norm denoising was applied due to its edge preserving and denoising features10, by converting images to the wavelet domain and applying L1-norm minimisation with a total variation (TV) and L1-norm penalty = 0.01 and 0.025, respectively.
In addition, different combinations of the PSIF and FISP signals were analysed to optimize CNR between cartilage and synovial fluid (CNRC/F) and CNR between bone and ligaments (CNRB/L):
Original: $$DESS = PSIF + FISP$$
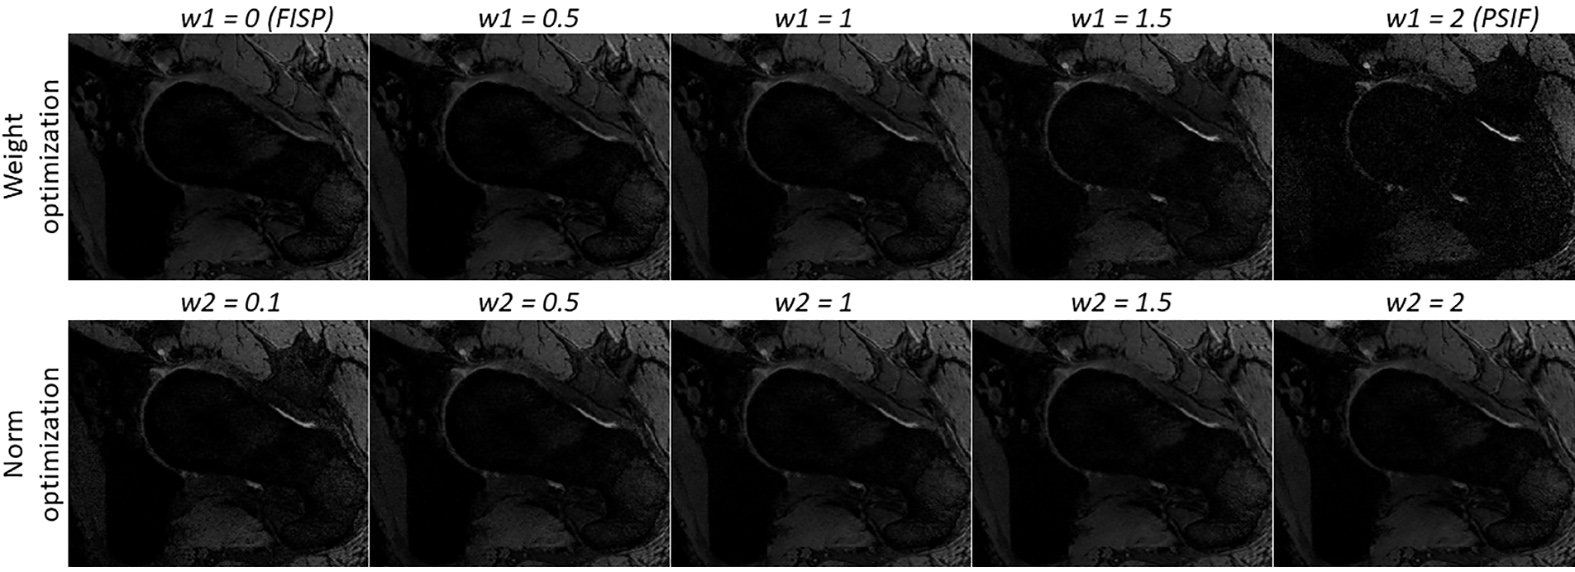
Weight optimisation: $$DESS_{WO} = w1 PSIF + (2 - w1) FISP$$
p-Norm optimisation: $$DESS_{NO} = (PSIF^{w2} + FISP^{w2})^{1/w2}$$
where w1 and w2 are the optimized parameters. The signal intensity (SI) was calculated by manually segmenting regions of the cartilage, bone, ligament and synovial fluid in an axial slice directed through the femoral head and acetabulum. The CNR between two tissues was calculated as the difference between the average SI in each tissue divided by the standard deviation of the background SI. A summary of the different signal processing and combinations is given in Figure 1. Because the denoising and different signal combinations affect the SI, all DESS images were normalized to have identical average cartilage SI in the reference slice.
Results
Figure 2 shows comparisons between PSIF, FISP and DESS before and after L1-norm denoising. It can be seen that the noise was substantially reduced, in particular for the PSIF image, while preserving tissue details and therefore enhancing the contrast.Figure 3 shows the evolution of the CNR and SI differences between tissues when varying the parameters w1 and w2, with and without denoising. The standard deviation of the background SI with and without denoising is also shown, to identify the behaviours of the different CNR components with different combination methods. It can be seen that denoising increases the CNR in all cases, which is caused by a small increase in SI difference, and large decrease in noise standard deviation. It can also be observed that CNRB/L and CNRC/F have different optimal weightings and norm-values. For example, decreasing w2 significantly increases CNRC/F, but at the cost of lower CNRB/L and larger noise.
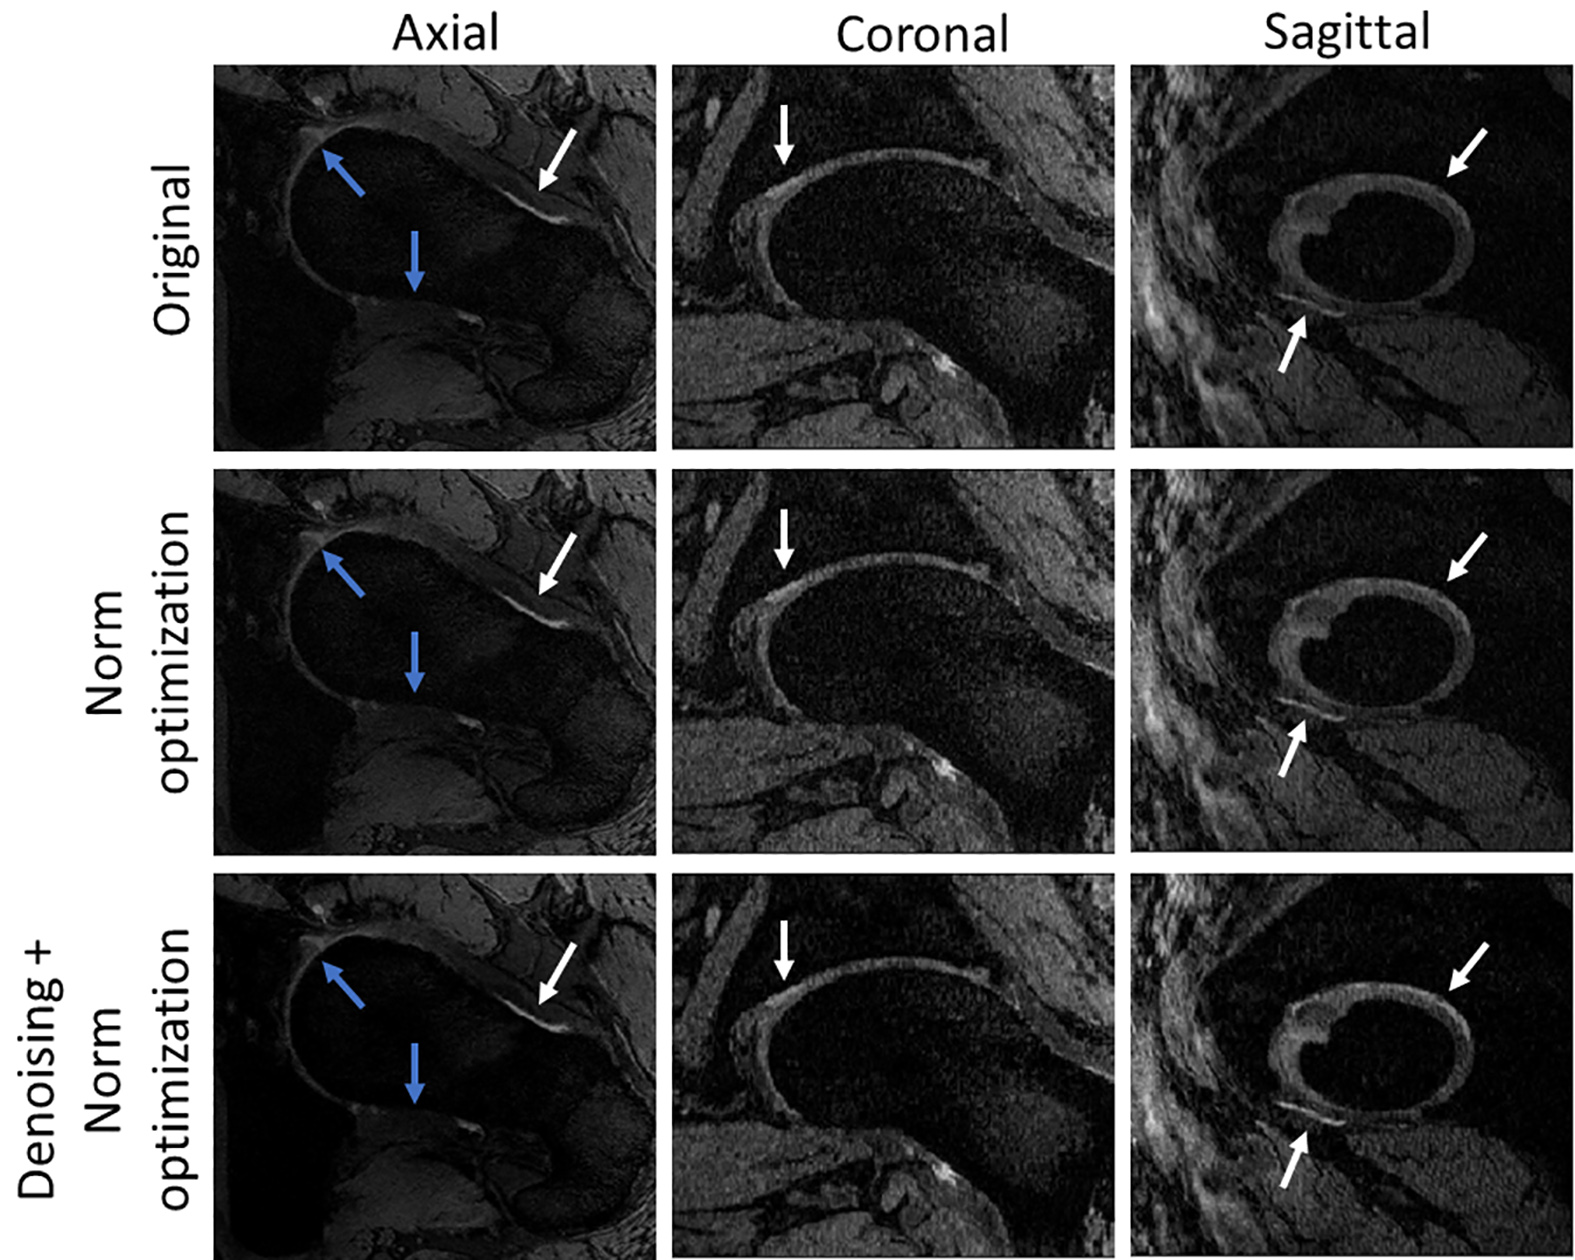
Figure 4 shows DESSWO and DESSNO with w1 and w2 ranging from 0 to 2. Although the PSIF image has the largest SI difference between the cartilage and synovial fluid, it contributes substantially to the amount of noise in the combined image and has poor contrast between bone and ligaments. A trade-off between noise amplification and contrast improvement was chosen by using DESSNO using denoised data and with w2 = 0.7 (Figure 5). This resulted in an increase of CNRC/F and CNRB/L of 104% and 70%, respectively, compared to the original DESS image, and a reduction of the standard deviation of the noise of 31%.
Discussion and Conclusion
In this work, we have developed a new approach using L1-norm denoising and p-norm combination (p = 0.7) of the PSIF and FISP images to improve the CNR between cartilage, synovial fluid, bone and ligaments in 7T images of the hip joint. These improvements have the potential to significantly improve the performance of automated hip segmentation, where errors often occur due to poor contrast between certain tissues. The method used in this work can be used at lower field MRI and for other applications than hip imaging.Acknowledgements
This work received funding from the ‘MR Hip Intervention and Planning System to enhance clinical and surgical outcomes’ NHMRC Development Grant.References
1. Xia Y, Fripp J, Chandra SS, Schwarz R, Engstrom C, Crozier S. Automated bone segmentation from large field of view 3D MR images of the hip joint. Physics in Medicine and Biology 2013;58(20):7375-7390.
2. Xia Y, Chandra SS, Engstrom C, Strudwick MW, Crozier S, Fripp J. Automatic hip cartilage segmentation from 3D MR images using arc-weighted graph searching. Physics in Medicine and Biology 2014;59(23):7245-7266.
3. Friedrich KM, Reiter G, Kaiser B, Mayerhofer M, Deimling M, Jellus V, Horger W, Trattnig S, Schweitzer M, Salomonowitz E. High-resolution cartilage imaging of the knee at 3 T: Basic evaluation of modern isotropic 3D MR-sequences. European Journal of Radiology 2011;78(3):398-405.
4. Hardy PA, Recht MP, Piraino D, Thomasson D. Optimization of a dual echo in the steady state (DESS) free-precession sequence for imaging cartilage. Jmri-J Magn Reson Im 1996;6(2):329-335.
5. Jin J, Weber E, O'Brien K, Destruel A, Henin B, Engstorm C, Crozier S. An 8-channel pTx transceive coil for hip imaging at 7 T. 2017; Proceedings of the 25th Annual Meeting of ISMRM, Honolulu, HI, USA.
6. Setsompop K, Wald LL, Alagappan V, Gagoski B, Hebrank F, Fontius U, Schmitt F, Adalsteinsson E. Parallel RF transmission with eight channels at 3 Tesla. Magnetic Resonance in Medicine 2006;56(5):1163-1171.
7. Eichfelder G, Gebhardt M. Local Specific Absorption Rate Control for Parallel Transmission by Virtual Observation Points. Magnetic Resonance in Medicine 2011;66(5):1468-1476.
8. International Electrotechnical Commission: Medical electrical equipment, Part 2: particular requirements for the basic safety and essential performance of magnetic resonance equipment for medical diagnosis2010.
9. Bieri O, Ganter C, Scheffler K. On the fluid-tissue contrast behavior of high-resolution steady-state sequences. Magn Reson Med 2012;68(5):1586-1592.
10. Lustig M, Donoho D,
Pauly JM. Sparse MRI: The application of compressed sensing for rapid MR imaging.
Magnetic Resonance in Medicine 2007;58(6):1182-1195.
Figures