2744
Accelerating 3D-T1ρ cartilage imaging using signal compensated low-rank plus sparse matrix decomposition
Yuanyuan Liu1,2, Weitian Chen3, Xin Liu1, Hairong Zheng1, Dong Liang1,2, and Yanjie Zhu1
1Paul C. Lauterbur Research Center for Biomedical Imaging, Shenzhen Institutes of Advanced Technology, Chinese Academy of Sciences, Shenzhen, China, 2Research center for Medical AI, Shenzhen Institutes of Advanced Technology, Chinese Academy of Sciences, Shenzhen, China, 3Department of Imaging and Interventional Radiology, The Chinese University of Hong Kong, Hong Kong, China
1Paul C. Lauterbur Research Center for Biomedical Imaging, Shenzhen Institutes of Advanced Technology, Chinese Academy of Sciences, Shenzhen, China, 2Research center for Medical AI, Shenzhen Institutes of Advanced Technology, Chinese Academy of Sciences, Shenzhen, China, 3Department of Imaging and Interventional Radiology, The Chinese University of Hong Kong, Hong Kong, China
Synopsis
The quantitative 3D-T1ρ mapping requires multiple T1ρ-weighted images with different spin lock times (TSLs) to obtain the T1ρ map, which makes the acquisition time very long. In this work, a signal compensation strategy with low-rank plus sparse model (SCOPE) was used to reconstruct T1ρ-weighted images from highly undersampled data. We provide the reconstructed images and the estimated T1ρ maps at an acceleration factor up to 8.5 in fast 3D-T1ρ cartilage imaging.
INTRODUCTION
Osteoarthritis (OA) is a major public health problem in the world (1). Recent studies have shown that cartilage degeneration is a major cause of OA (2,3). Cartilage degeneration is triggered by damage to the collagen-proteoglycan (PG) matrix. Spin-lattice relaxation in the rotating frame (T1ρ ), has received considerable interest in early identification of cartilage degeneration since it can reflect the changes in the PG matrix (4,5). However, quantitative T1ρ imaging requires multiple images with different spin-lock times (TSLs) to obtain the T1ρ map, which makes the acquisition time very long and thus limits the widespread clinical use of this technique. Compressed sensing has shown significant performance in fast quantitative T1ρ mapping (6-9). In this work, we extend our previous 2D fast T1ρ mapping method (SCOPE) (10) to reconstruct 3D T1ρ-weighted images from highly undersampled k-space data.METHODS
The SCOPE method was used for image reconstruction at each readout line in the kx direction, with the model as follows: $$min_{\{X,L,S\}} {{\parallel}L{\parallel}}_{*} +\lambda{{\parallel}S{\parallel}}_{1} s.t. C(X)=L+S,E(X)=d,Rank(L)=1 \ \ \ \ \ \ \ \ \ \ [1] $$ where $$${{\parallel}L{\parallel}}_{*}$$$ is the nuclear norm of the low-rank matrix L; $$${{\parallel}S{\parallel}}_{1}$$$ is the l1-norm of the sparse matrix S; X is the image series; λ is a regularization parameter; d is the undersampled k-space data; C(∙) performs pixel-wise signal compensation; E is the encoding operator (11); Rank(·) represents the rank value of the 2D image matrix in ky and kz dimension. To solve the above equation, an initial compensation coefficient was calculated using the T1ρ map estimated from the fully sampled central k-space. Iterative hard thresholding of the singular values for L and a soft-thresholding of the entries for S were used to solve the optimization problem in Eq. [1]. A new T1ρ map was estimated from the reconstructed images and then used to update the compensation coefficient. The reconstruction and signal compensation coefficient updating steps were repeated alternately until convergence. The T1ρ measurements can be estimated using the monoexponential model: $$M=M_{0}\exp(-TSL_{n}/T_{1\rho})_{n=1,2,...,N} \ \ \ \ \ \ \ \ \ \ [2] $$ where M is the image intensity obtained at varying TSLs, M0 is the baseline image intensity without the application of spin lock pulse; TSLn is the nth spin-lock time; N is the total TSL number.The compensation coefficient for signal compensation is calculated by : $$Coef=1/{exp(−TSL_n/T_{1\rho})_{n=1,2,...,N}} \ \ \ \ \ \ \ \ \ \ [3] $$Evaluation
Two in vivo human knee 3D-T1ρ -weighted data sets (1 male, age 26,1 female, age 22, IRB proved, written informed consent obtained) were acquired with five different TSLs using a 3D gradient echo (GRE) sequence with a self-compensated paired spin-lock preparation (12) . The MRI scan was performed on a 3T uMR 790 scanner (United Imaging Healthcare, Shanghai, China) using a commercial UIH 12-channel phase array knee coil. Imaging parameters were: TR/TE=9.46ms/3.49ms, spin-lock frequency 500 Hz, FOV=256 ×140 mm2, T1 recovery delay=850 ms, matrix size =256 × 140 × 92, slice thickness 1.6 mm, TSLs =5, 10, 20, 40 and 60 ms and the total acquisition time=23 minutes and 30 seconds. The acquired 3D k-space data were retrospectively undersampled along the ky and kz dimensions with 2D Poisson disk random pattern (shown in Figure 1) for net acceleration factors R=5.1,7.4, and 8.5. T1ρ-weighted images were reconstructed by the SCOPE method and L+S method. The quality of the reconstructed T1ρ-weighted images and the estimated T1ρ maps were assessed by normalized root mean square error (nRMSE) as follows: $$nRMSE=\sqrt{{\parallel{X_{est}-X_{ref}}\parallel}_2^2/{\parallel{X_{ref}}\parallel}_2^2} \ \ \ \ \ \ \ \ \ \ [4]$$ where $$$X_{est}$$$ denotes the reconstructed image or the estimated T1ρ map from the undersampled data, and $$$X_{ref}$$$ is the reference image or T1ρ map from the fully sampled k-space data.RESULTS and DISCUSSION
Figure 1 shows the 2D undersampling patterns for net acceleration factors R=5.1, 7.4, and 8.5, respectively. Figure 2 shows the reconstructed T1ρ-weighted images using SCOPE and L+S, and the estimated T1ρ maps in selected region of interest (ROI) from the reconstructed images at each acceleration factor for slice = 42 of subject 1. Figure 3 shows the reconstructed T1ρ-weighted images using SCOPE and L+S, and the estimated T1ρ maps in selected ROI from the reconstructed images at each acceleration factor for slice = 34 of subject 2. The corresponding nRMSEs of the estimated T1ρ maps in selected ROI are shown at the bottom of each image.The reconstructed images and T1ρ maps using SCOPE are comparable with the reference, which were obtained from the fully sampled k-space data. Figure 4 shows the nRMSE curves of the reconstructed T1ρ-weighted images in selected ROI at TSL = 5 ms with R = 5.1,7.4 and 8.5 for the above two slices in Figure 2 and Figure 3.It can be observed that the SCOPE method achieves better reconstruction quality with lower nRMSEs than the L+S method for all the acceleration factors.CONCLUSION
The proposed method can accurately reconstruct the 3D-T1ρ-weighted image series from highly undersampled k-space data, and thereby significantly reduce the scan time of 3D- T1ρ cartilage imaging.Acknowledgements
This work is supported in part by the National Natural Science Foundation of China under grant nos. 61771463, 81971611, National Key R&D Program of China no. 2017YFC0108802 and Technology Commission of the government of Hong Kong SAR under grant no. MRP/001/18X.References
- Neogi T. The epidemiology and impact of pain in osteoarthritis. Osteoarthritis Cartilage 2013;21(9):1145-1153.
- Li X, Pai A, Blumenkrantz G, Carballido-Gamio J, Link T, Ma B, Ries M, Majumdar S. Spatial distribution and relationship of T1ρ and T2 relaxation times in knee cartilage with osteoarthritis. Magn Reson Med 2009;61(6):1310-1318.
- Regatte RR, Akella SV, Wheaton AJ, Lech G, Borthakur A, Kneeland JB, Reddy R. 3D- T1ρ-relaxation mapping of articular cartilage: in vivo assessment of early degenerative changes in symptomatic osteoarthritic subjects. Acad Radiol 2004;11(7):741-749.
- Li X, Han ET, Ma CB, Link TM, Newitt DC, Majumdar S. In vivo 3T spiral imaging based multi-slice T1ρ mapping of knee cartilage in osteoarthritis. Magn Reson Med 2005;54(4):929-936.
- Wang YX, Zhang Q, Li X, Chen W, Ahuja A, Yuan J. T1ρ magnetic resonance: basic physics principles and applications in knee and intervertebral disc imaging. Quant Imaging Med Surg 2015;5(6):858-885.
- Zhou Y, Pandit P, Pedoia V, Rivoire J, Wang Y, Liang D, Li X, Ying L. Accelerating T1ρ cartilage imaging using compressed sensing with iterative locally adapted support detection and JSENSE. Magn Reson Med 2016;75(4):1617-1629.
- Zhu Y, Zhang Q, Liu Q, Wang YX, Liu X, Zheng H, Liang D, Yuan J. PANDA- T1ρ: Integrating principal component analysis and dictionary learning for fast T1ρ mapping. Magn Reson Med 2015;73(1):263-272.
- Zibetti MVW, Baboli R, Chang G, Otazo R, Regatte RR. Rapid compositional mapping of knee cartilage with compressed sensing MRI. J Magn Reson Imaging 2018;48(5):1185-1198.
- Zibetti MVW, Sharafi A, Otazo R, Regatte RR. Compressed sensing acceleration of biexponential 3D- T1ρ relaxation mapping of knee cartilage. Magn Reson Med 2019;81(2):863-880.
- Zhu Y, Liu Y, Ying L, Peng X, Wang YJ, Yuan J, Liu X, Liang D. SCOPE: signal compensation for low-rank plus sparse matrix decomposition for fast parameter mapping. Phys Med Biol 2018;63(18):185009.
- Pruessmann KP, Weiger M, Bornert P, Boesiger P. Advances in sensitivity encoding with arbitrary k-space trajectories. Magn Reson Med 2001;46(4):638-651.
- Mitrea BG, Krafft AJ, Song R, Loeffler RB, Hillenbrand CM. Paired self-compensated spin-lock preparation for improved T1ρ quantification. J Magn Reson 2016;268:49-57.
Figures
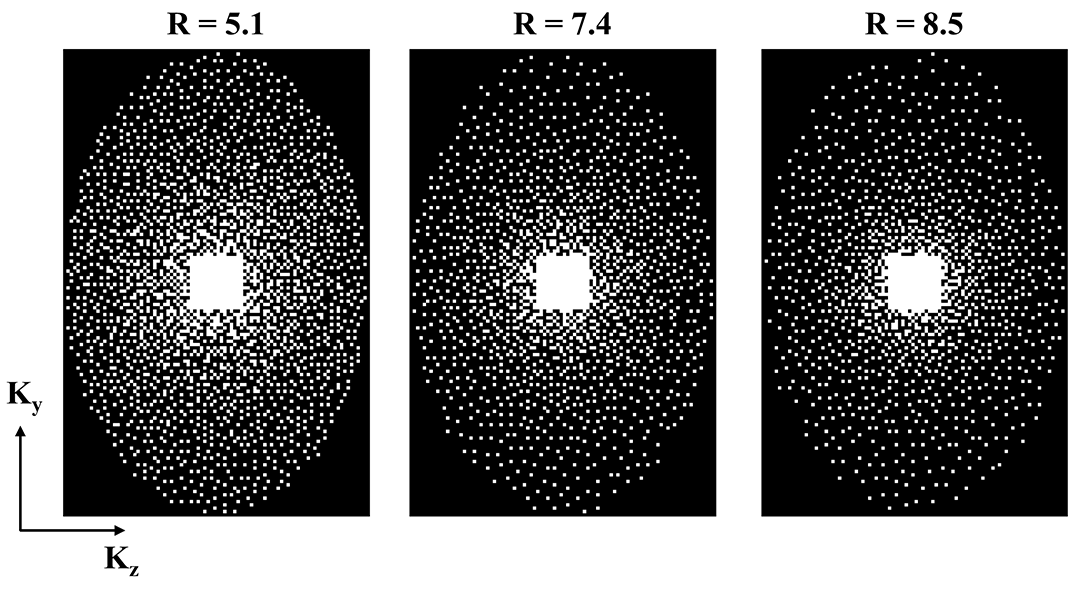
Figure 1. The proposed
undersampling mask in the ky- kz space for net acceleration
factors R=5.1,7.4 and 8.5.
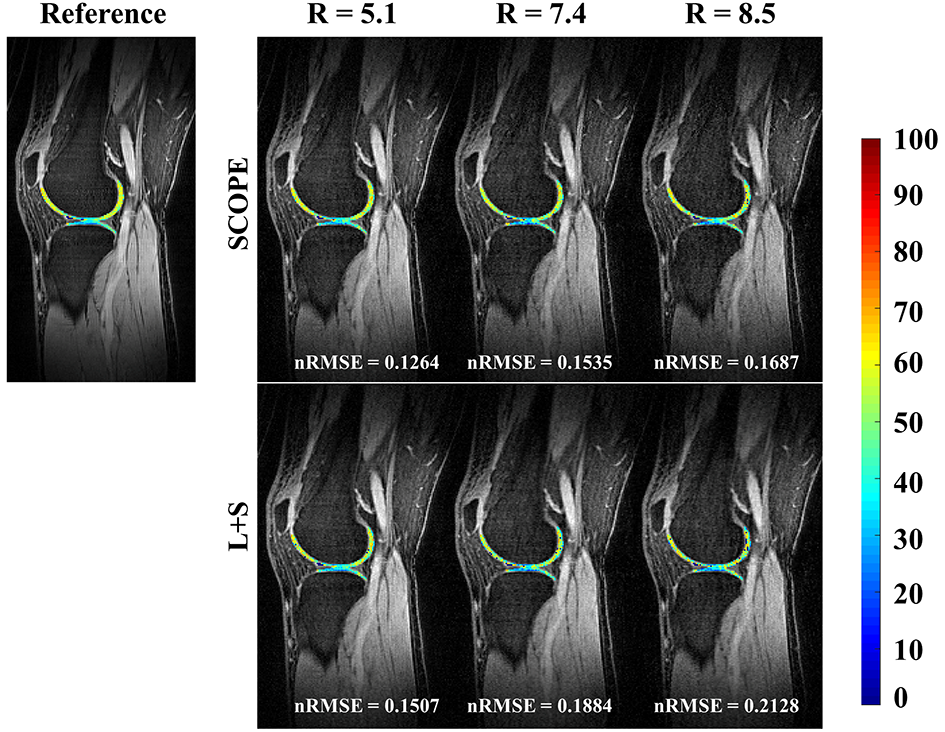
Figure
2. The
estimated T1ρ parameter
maps for selected ROI overlaid on the reconstructed T1ρ-weighted images at TSL = 5 ms for R=5.1,7.4 and 8.5 using the SCOPE and
L+S methods for one slice of subject 1.The reference image and T1ρ parameter
map
were obtained from the fully sampled k-space data. The
corresponding nRMSEs of the estimated T1ρ maps for
selected ROI are shown at the bottom of each image.
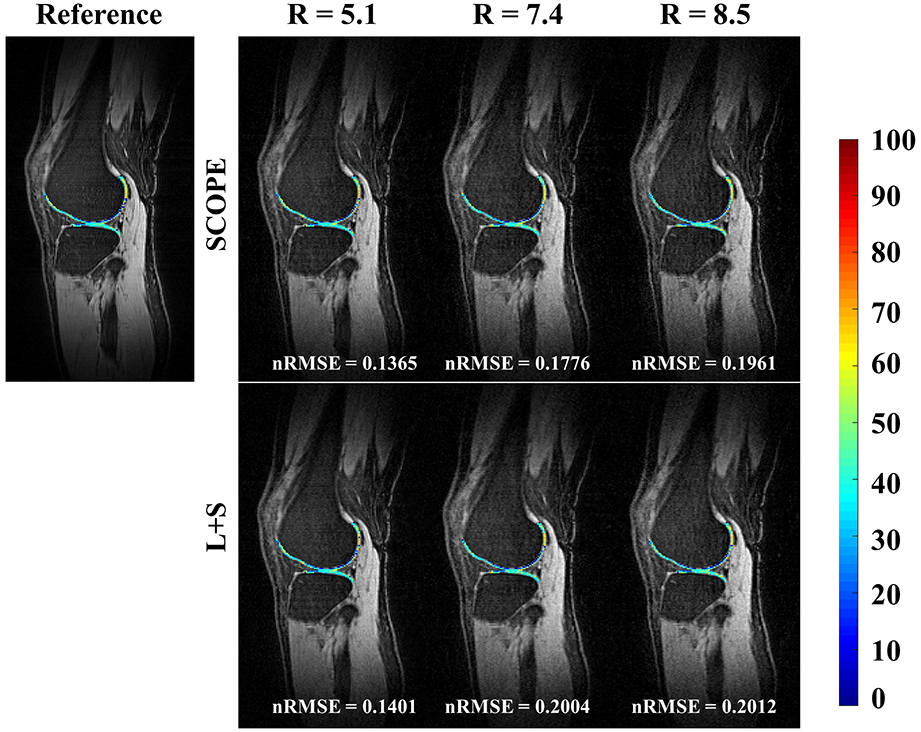
Figure 3. The estimated T1ρ parameter maps for selected ROI overlaid on the reconstructed T1ρ-weighted images at TSL = 5 ms for R=5.1,7.4 and 8.5 using the SCOPE and
L+S methods for one slice of subject 2.The reference image and T1ρ parameter map were obtained
from the fully sampled k-space data. The corresponding nRMSEs of the estimated T1ρ maps for selected ROI are
shown at the bottom of each image.
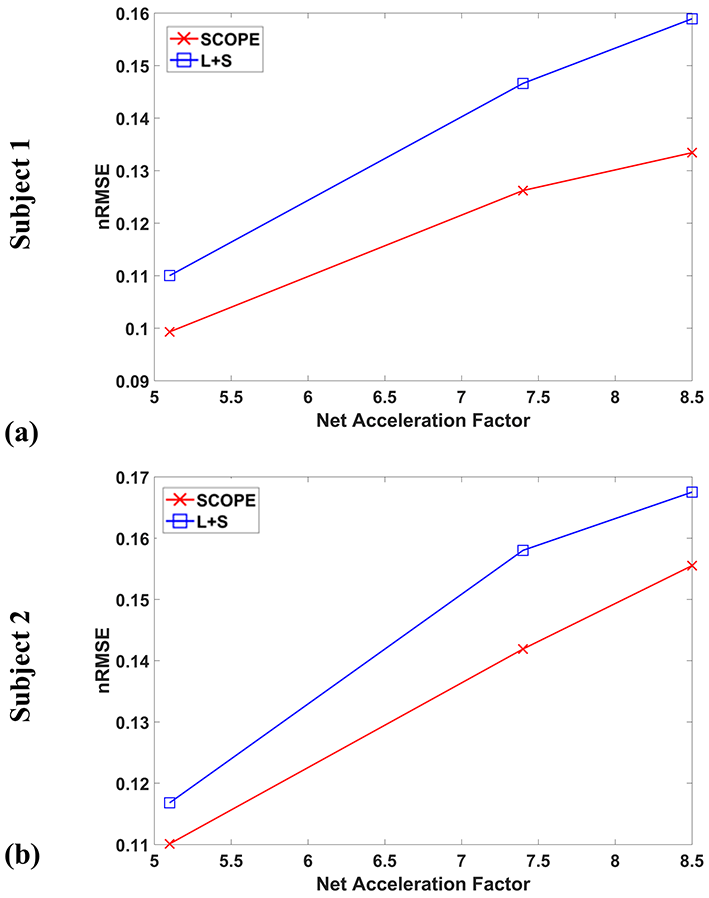
Figure
4. The
nRMSE curves of the reconstructed T1ρ-weighted images for
selected ROI at TSL = 5 ms with R = 5.1,7.4 and 8.5 for the above two
slices in Figure 2 and Figure 3.