2743
Distinguishing Exercise-Induced Compositional Changes in Knee Cartilage with Quantitative MR Relaxation Time Mapping1Department of Radiology, University of Cambridge, Cambridge, United Kingdom, 2Norwich Medical School, University of East Anglia, Norwich, United Kingdom, 3Cambridge University Hospitals NHS Foundation Trust, Addenbrooke’s Hospital, Cambridge, United Kingdom, 4Independent Clinical Imaging Consultant, Munich, Germany, 5GlaxoSmithKline, Clinical Imaging, Philadelphia, PA, United States
Synopsis
We introduce a method to reliably determine changes in healthy knee cartilage composition after joint loading. Ten healthy participants were imaged before and after participant repositioning to determine the test-retest repeatability of T1ρ and T2 relaxation time mapping. Additionally, nine healthy participants were imaged before and after a mild, dynamic stepping exercise. Three-dimensional surface analysis of patellar, femoral, and lateral and medial tibial cartilage was performed. The exercise surface data was thresholded with the determined measurement errors from the T1ρ and T2 repeatability data to highlight cartilage regions experiencing reliable exercise-induced compositional changes.
Introduction
The ability to quantify alterations in articular cartilage water and macromolecular content after static and dynamic joint-loading activities has been supported by developments in compositional magnetic resonance imaging (MRI) techniques.However, with the variability of test-retest repeatability measurements1 being of similar degree as previously reported exercise-induced changes in T1ρ2,3 and T22–6 relaxation times, the utility of these techniques for detecting compositional changes in cartilage remains uncertain.
The aim of this study was to determine if T1ρ and T2 relaxation time mapping techniques are effectively sensitive to measure changes in cartilage composition above measurement error after a mild, dynamic joint loading activity.
Methods
All images were acquired on a 3.0T MRI system (MR750 GE Healthcare, Waukesha, WI, USA) using an 8-channel transmit/receive knee coil. All Participants had no knee pain and no known history of joint disorders. Imaged knees were kept in an unloaded state while participants sat for 15 minutes prior to imaging sessions to minimise short-term loading effects on the cartilage.Nine participants (mean age: 31.6 ± 6.0 years; 5 males, 4 females) were imaged to evaluate cartilage compositional response to a mild, 5-minute stepping activity. The MR protocol before exercise consisted of a three-dimensional fat-saturated spoiled gradient recalled-echo sequence (3D-SPGR FS, matrix size=512x380 zero-filled interpolated to 512x512, voxel size=0.29x0.29x1mm3), T1ρ mapping using a T1ρ-prepared pseudo-steady-state 3D fast spin echo (PSS 3D-FSE) sequence with a rotary-echo spin-lock preparation cluster (TR=1565ms, TSL=1,10,20,35ms, scan time=5:23min) and T2 mapping using a T2-prepared PSS 3D-FSE sequence with a composite 90x - 180y - 90x preparation pulse cluster (TR=1580ms, TE=6.5,13.4,27.0,40.7ms, scan time=5:25min). The following parameters were identical for the T1ρ and T2 pulse sequences: field-of-view=160x144mm , matrix size=320x256 interpolated to 512x512, slice thickness=3mm, number of slices per TSL/TE=72. After exercise, T1ρ and T2 mapping was performed with unchanged pulse sequences as before exercise. The dynamic joint-loading activity involved five minutes of stepping onto a 24cm tall step-stool with one leg and stepping down onto the other side of the step-stool with the leg to be imaged.
To assess the test-retest repeatability of T1ρ- and T2-relaxation mapping of cartilage, a single knee of ten healthy participants (mean age 28.9 ± 5.5 years, 5 males, 5 females) was imaged with a sagittal 3D-SPGR FS sequence, and sagittal T1ρ- and T2-mapping sequences. Following participant and knee repositioning, another set of T1ρ- and T2-mapping acquisitions were performed using the same pulse sequences as before repositioning.
The T1ρ- and T2-maps were calculated by fitting the mono-exponential decay function to the voxel-wise signal intensities using a linearised least squares algorithm.
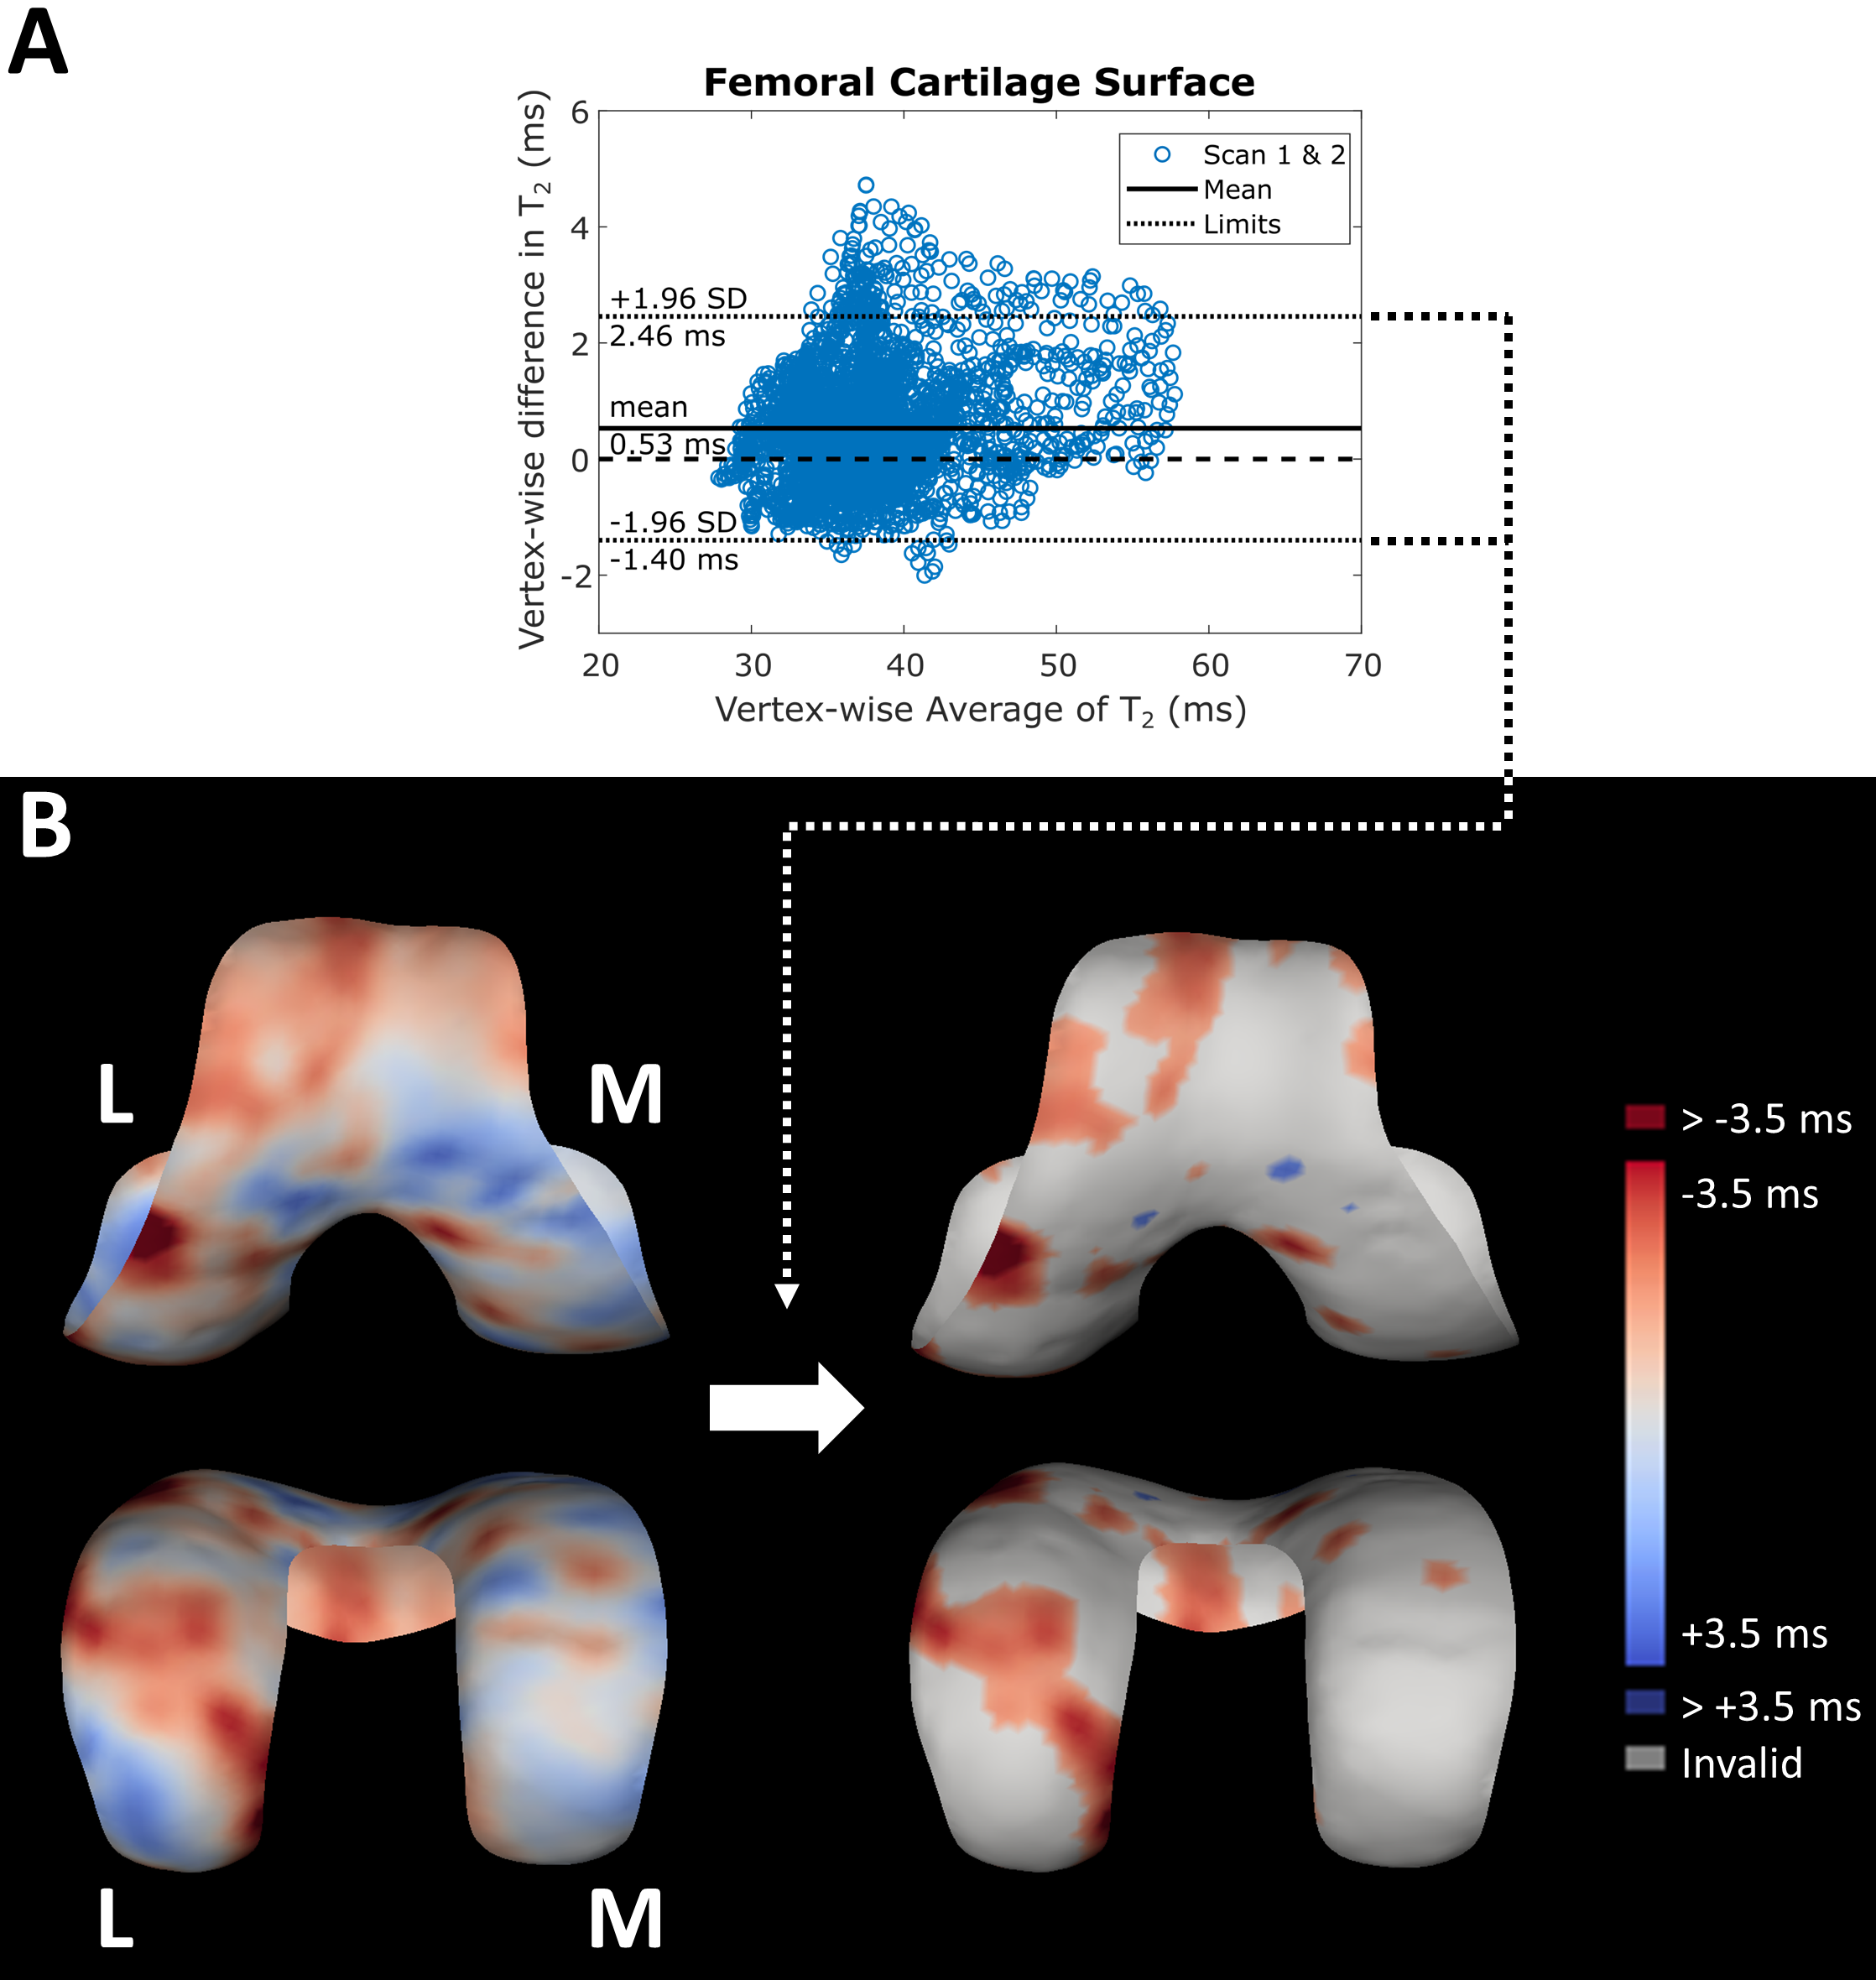
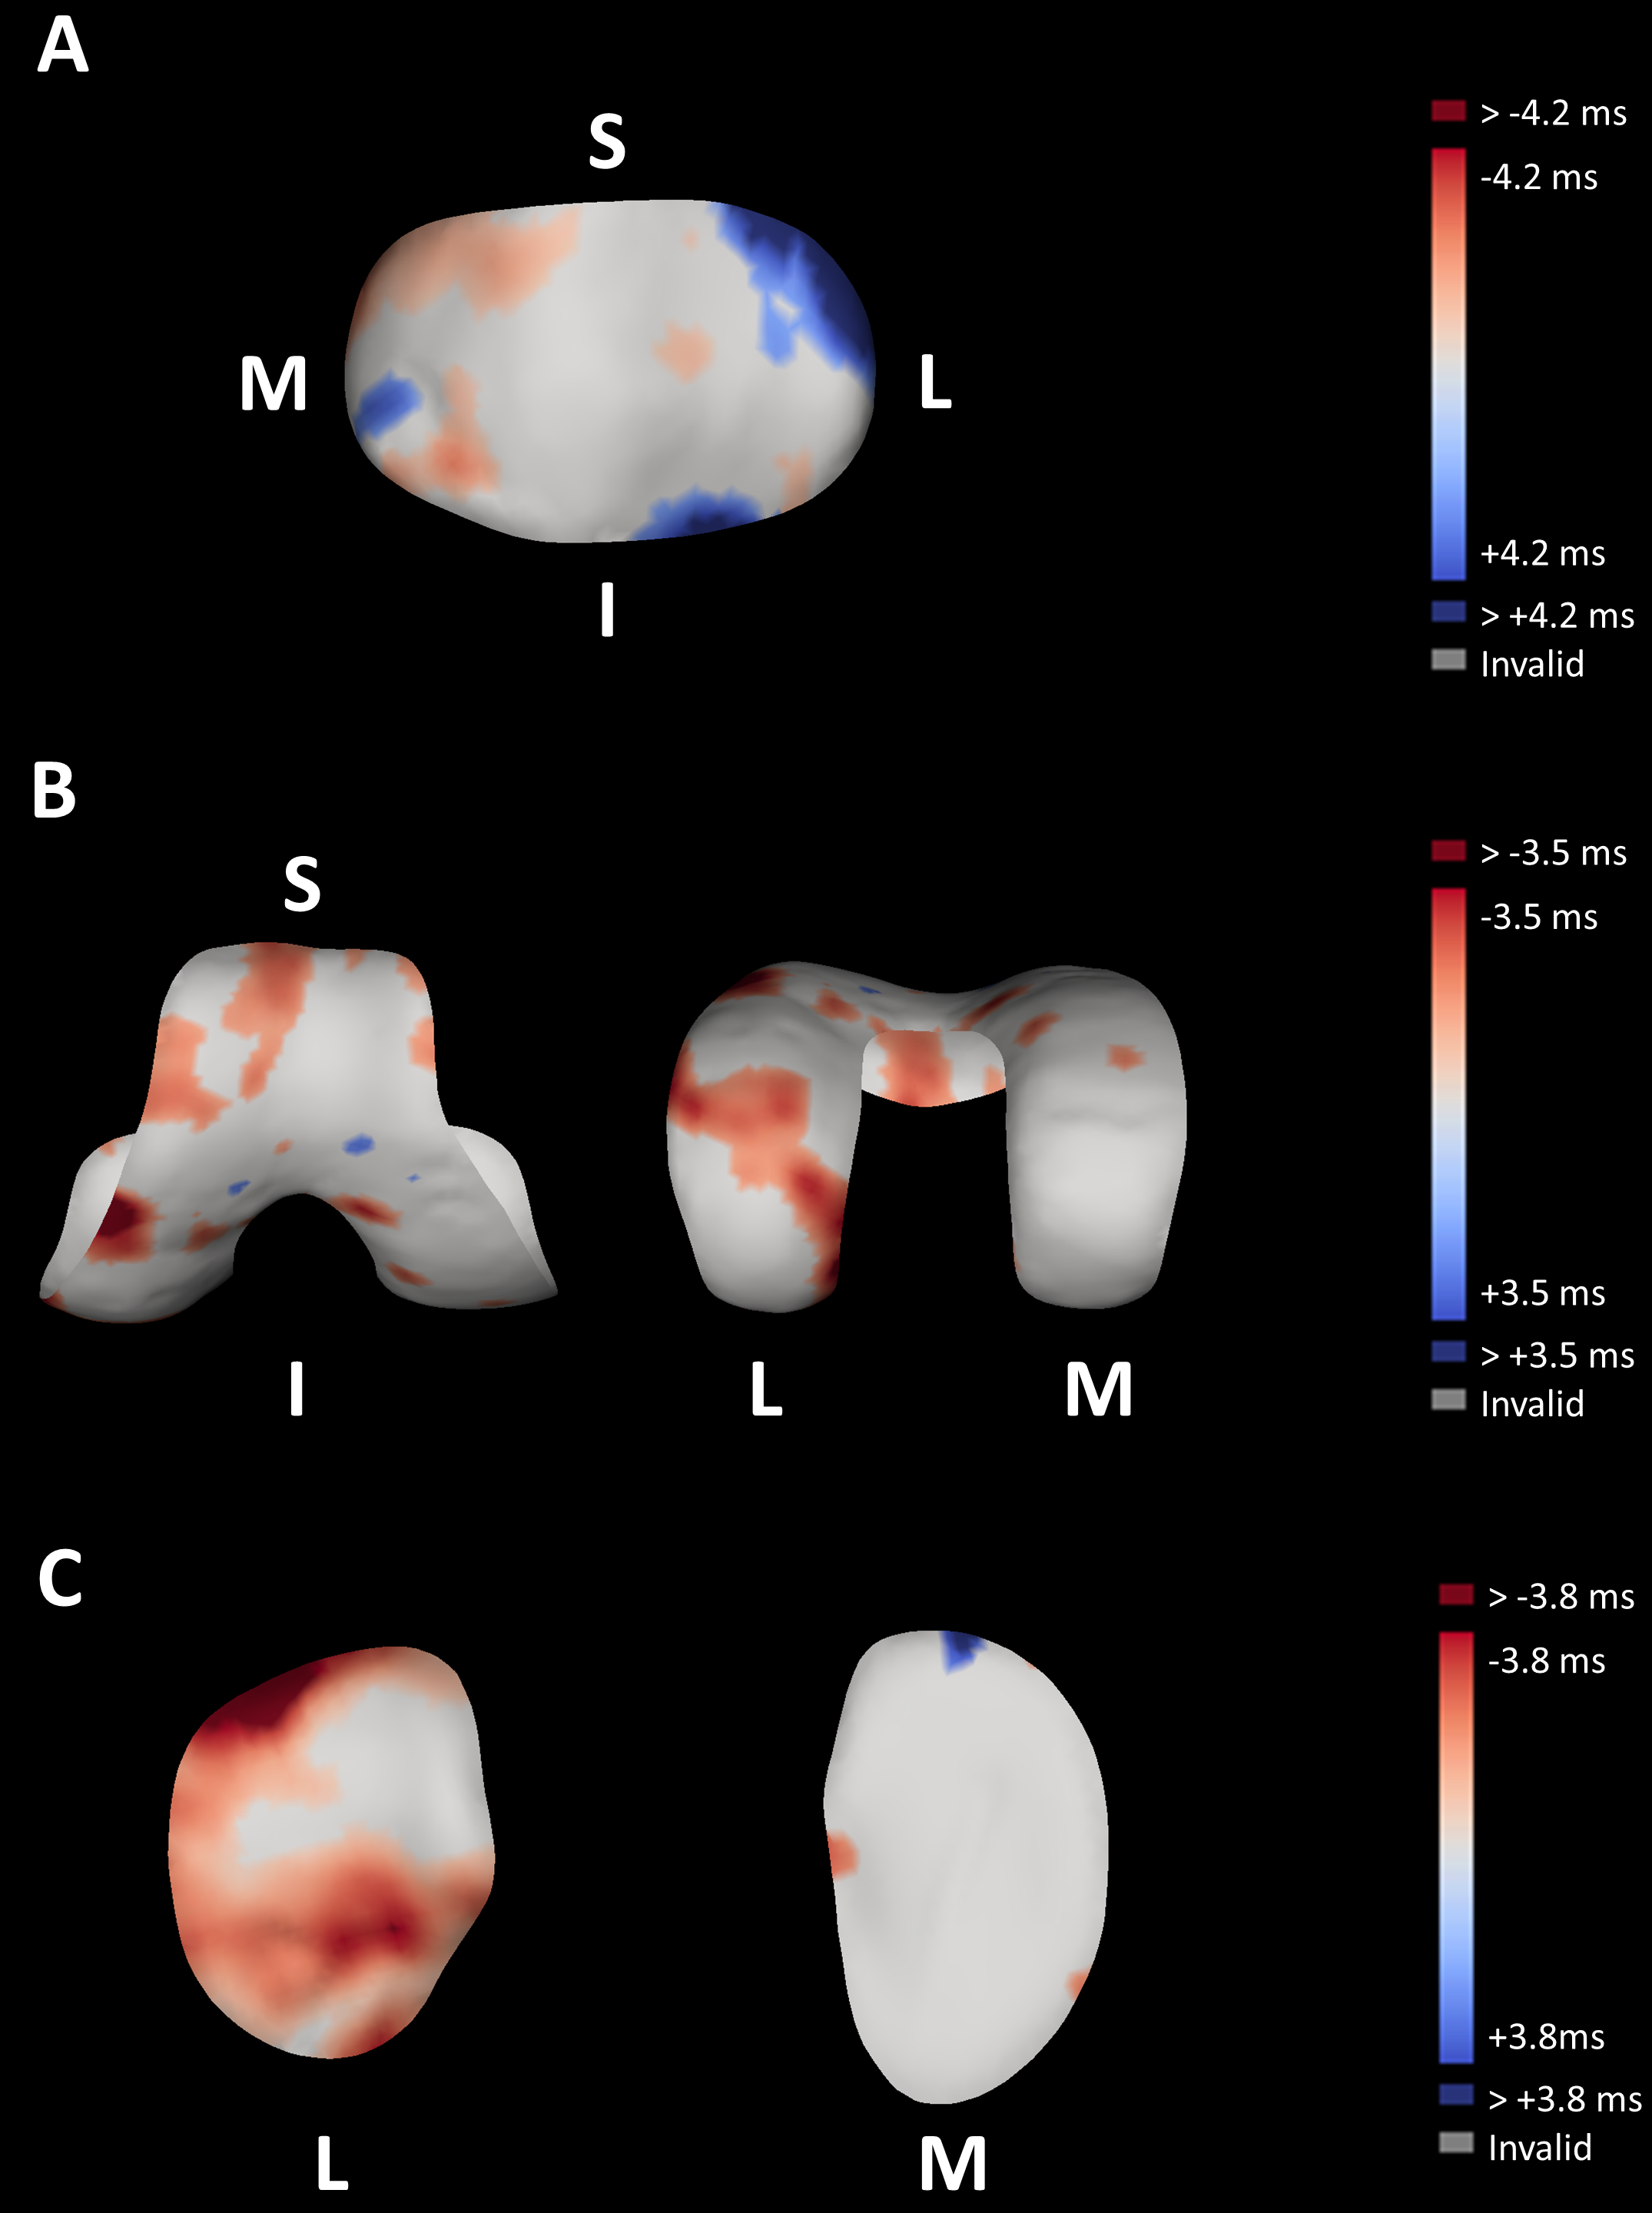
We performed 3D surface-based analysis of cartilage compositional parameters using Stradwin software7. The 3D-SPGR FS datasets were used to perform sparse manual contouring (on every 2nd – 4th sagittal slice) of the patella, tibia, and femur including their surrounding cartilage (Figure 1). Following shape-based interpolation and the generation of unique triangulated surface mesh objects of each cartilage surface (femoral, patellar, medial tibial, lateral tibial) and for each participant, a canonical (average) cartilage surface was calculated. All the quantitative surface data (T1ρ and T2) from both the repeatability and exercise-recovery groups were mapped onto the canonical surface.
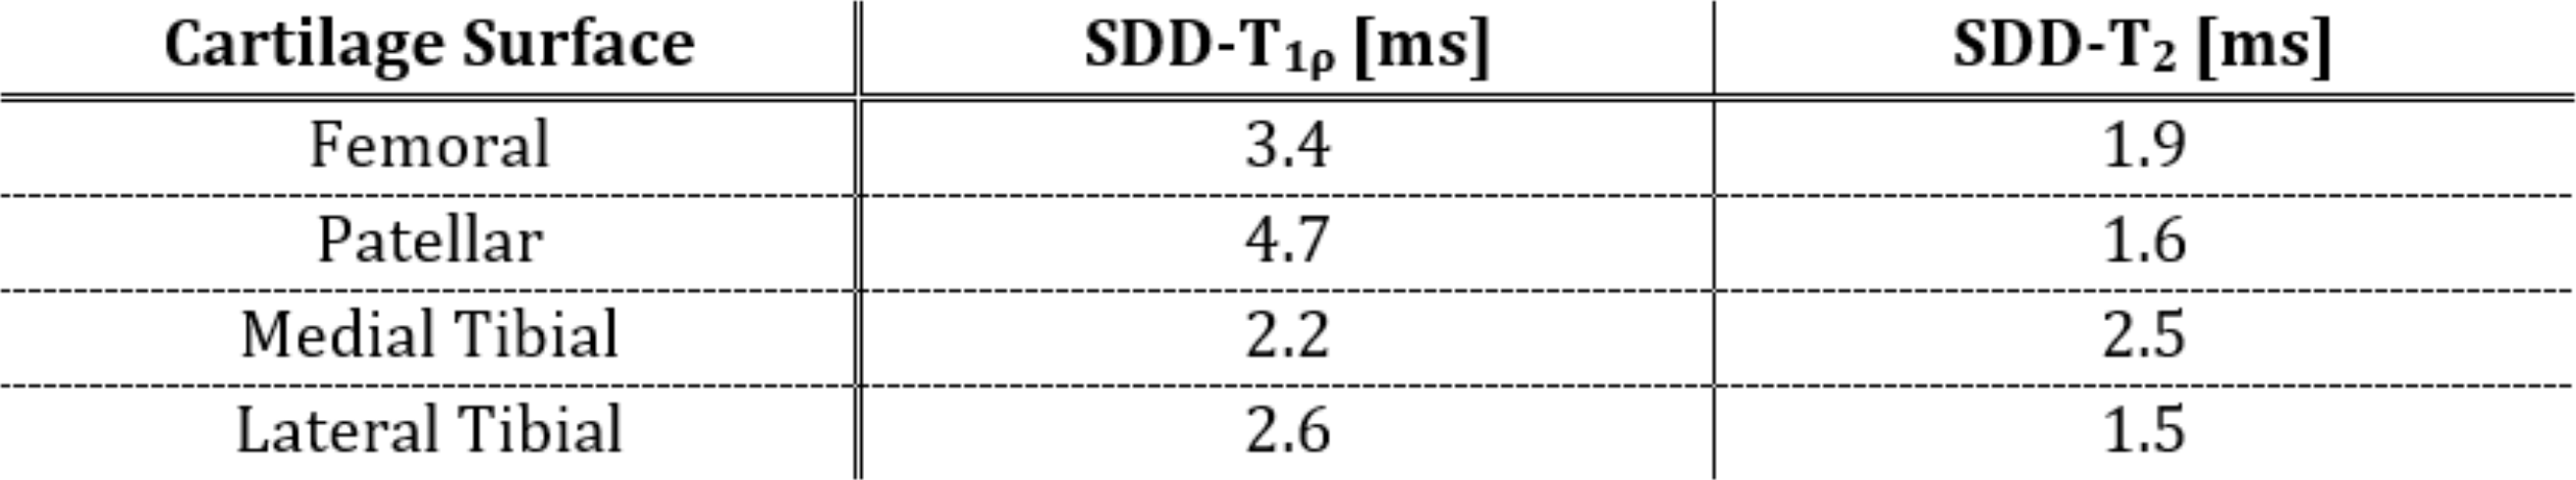
The smallest detectable difference (SDD) was determined from Bland-Altman analysis of the repeatability data for all four cartilage surfaces and for both T1ρ and T2 (Figure 1A). The ±95% confidence intervals of the Bland-Altman plots were used to establish thresholds which were applied to the exercise surface data (Figure 1B). Relaxation time changes after exercise greater than the SDD represent changes which have a 95% chance of being a true change rather than a change due to measurement error.
Results
The determined SDD of test-retest repeatability data for both T1ρ and T2 and all four cartilage surfaces are presented in Table 1.Figures 2 and 3 show the canonical difference maps from all four cartilage surfaces and calculated by subtracting the thresholded pre-exercise measurements from the thresholded post-exercise measurements for T1ρ and T2, respectively.
The largest negative percentage change (normalised change in cartilage relaxation time measurement following exercise) of -25.5% was observed in the patellar cartilage T1ρ followed by -17.3% in femoral cartilage T1ρ. The largest increased percentage change of +28.4% was displayed in the patellar cartilage T2 followed by +15.7% in medial tibial cartilage T2.
Discussion
These results emphasise that T1ρ and T2 relaxation time mapping are sensitive to cartilage compositional variations following exercise.The effects of the mild, dynamic stepping exercise performed in this study highlight the importance of an adequate resting period prior to participant imaging, especially when evaluating clinical imaging studies aimed at determining morphological and compositional differences in healthy and diseased cartilage. Disease-induced variations in cartilage compositional T1ρ8–10 and T28,10 measurements have been shown to be of a similar magnitude and display in similar cartilage regions as exercise-induced changes. Therefore, it is crucial to mitigate these joint-loading effects when conducting clinical OA trials.
Conclusion
The 3D vertex-wise surface analysis performed in this study contributes in spatially localising the cartilage compositional responses to joint loading greater than the measurement error of the quantitative MR method. This analysis could also assist in determining those cartilage regions likely to undergo cartilage degeneration.Acknowledgements
We acknowledge the support by GlaxoSmithKline, Addenbrooke's Charitable Trust, and the National Institute of Health Research Cambridge Biomedical Research Centre.References
1. MacKay JW, Low SBL, Smith TO, et al. Systematic review and meta-analysis of the reliability and discriminative validity of cartilage compositional MRI in knee osteoarthritis. Osteoarthr Cartil 2018; 26: 1140–1152.
2. Chen M, Qiu L, Shen S, et al. The influences of walking, running and stair activity on knee articular cartilage: Quantitative MRI using T1 rho and T2 mapping. PLoS One 2017; 12: 1–15.
3. Subburaj K, Kumar D, Souza RB, et al. The acute effect of running on knee articular cartilage and meniscus magnetic resonance relaxation times in young healthy adults. Am J Sports Med 2012; 40: 2134–2141.
4. Farrokhi S, Colletti PM, Powers CM. Differences in patellar cartilage thickness, transverse relaxation time, and deformational behavior: A comparison of young women with and without patellofemoral pain. Am J Sports Med 2011; 39: 384–391.
5. Cha JG, Lee JC, Kim HJ, et al. Comparison of MRI T2 relaxation changes of knee articular cartilage before and after running between young and old amateur athletes. Korean J Radiol 2012; 13: 594–601.
6. Gatti AA, Noseworthy MD, Stratford PW, et al. Acute changes in knee cartilage transverse relaxation time after running and bicycling. J Biomech 2017; 53: 171–177.
7. Treece G, Prager R, Gee A. http://mi.eng.cam.ac.uk/~rwp/stradwin/.
8. Li X, Ma CB, Link TM, et al. In vivo T1rho and T2 Mapping of Articular Cartilage in Osteoarthritis of the Knee Using 3 Tesla MRI. Osteoarthr Cart 2007; 15: 789–797.
9. Wang L, Chang G, Xu J, et al. T1rho MRI of menisci and cartilage in patients with osteoarthritis at 3T. Eur J Radiol 2012; 81: 2329–2336.
10. Souza RB, Kumar D, Calixto N, et al. Response of knee cartilage T1rho and T2 relaxation times to in vivo mechanical loading in individuals with and without knee osteoarthritis. Osteoarthr Cartil 2014; 22: 1367–1376.
Figures