2742
Quantification of knee cartilage using automated cartilage segmentation prototype software : Clinical validation on volunteers1The third Hospital of Hebei Medical University, Shijiazhuang, China, 2MR Collaboration, Siemens Healthineers Ltd,Shanghai,China, ShangHai, China, 3Siemens Healthcare, Erlangen, Germany., Erlangen, Germany, 4radiology, The third Hospital of Hebei Medical University, Shijiazhuang, China
Synopsis
Manual cartilage segmentation is a time-consuming post-processing procedure, especially for clinical doctors. Automatic cartilage segmentation frees doctors from tedious computer work. Although there have been various automatic segmentation algorithms, accurate automatic segmentation is still a challenge. In this study, we validated the automatic cartilage segmentation results of the knee joint using a 3D high-resolution DESS sequence. We found that the location of cartilage subregions, and the hydrarthrosis and cartilage degeneration may influence the accuracy of the segmentation. In order to derive more accurate results, a manual finetuning of the automatic segmentation was done. Automatic segmentation still saved considerable time.
Introduction
Developments in MRI, such as 3-dimensional (3D) MRI sequences, allow for a high-resolution isotropic imaging of the large joint, providing more detailed morphological information of the cartilage, moreover, quantitative parameters, including cartilage volume and thickness, can be non-invasively obtained combining high-resolution 3D MRI sequences and automated cartilage segmentation methods. These are valuable tools for assessing cartilage quantitatively, and save time in post-processing. Thus, these tools have considerable value in clinical settings. Unfortunately, automated segmentation software may result in errors in segmenting cartilage of some subregions [1]. Among the various cartilage segmentation algorithms, a method using a segmentation hierarchy, proposed by J. Fripp and et al. was proven to be comparable or superior to other published automated algorithms [2]. In a first step, bones are extracted using 3D active shape modelling, followed by a search for the bone cartilage interface and cartilage segmentation using a deformable model. However, this segmentation algorithm relies also on the accurate recognition of the boundary between tissues, which is easily influenced by hydrarthrosis and by the edge blur caused by cartilage degeneration. The clinical validation with regard to the segmentation accuracy of this method remains largely untested. In this study, the accuracy of the automated cartilage segmentation was assessed by manually editing the contours of the knee cartilage and calculating the discrepancy coefficient. The clinical value of this method was also discussed.Methods
We examined the right knees of 12 healthy volunteers, each of whom underwent MR examinations three times. The volunteers included 5 males and 7 females, aged 21 to 37 years. Scans were performed on a 3T MR scanner (MAGNETOM Verio, Siemens Healthcare, Erlangen, Germany). Images were acquired using a dedicated 8-channel knee coil, and sagittal images were obtained using a 3D high-resolution Double-Echo in Steady-State (DESS) sequence with selective water excitation. The imaging parameters were the following: voxel size 0.63×0.67×0.67 mm3, TR 14.45 ms, TE 5.17 ms, flip angle 25°, slice thickness 0.68 mm, field of view: 160×160 mm2, matrix: 256x240. A senior-level radiologist evaluated the extent of cartilage degeneration and hydrarthrosis, blinded to the volunteers' clinical information. Cartilage score criteria were obtained using the Whole-Organ Magnetic Resonance Imaging Score (WORMS), and ranged from 0 to 2. Knee cartilage was automatically segmented to 21 subregions [3] using post-processing prototype software (Siemens MR Chondral Health, version 2.1, Siemens Healthcare, Erlangen, Germany). Quantitative measures of cartilage thickness and volume were respectively acquired by both automated segmentation and manual segmentation. All errors made by automated segmentation software (including false positives and false negatives) were counted as false layers. The number of total layers divided by the number of error layers is discrepancy coefficient. Levels of hydrarthrosis and a cartilage score were calculated to analyse the influence of the location of subregions.Results
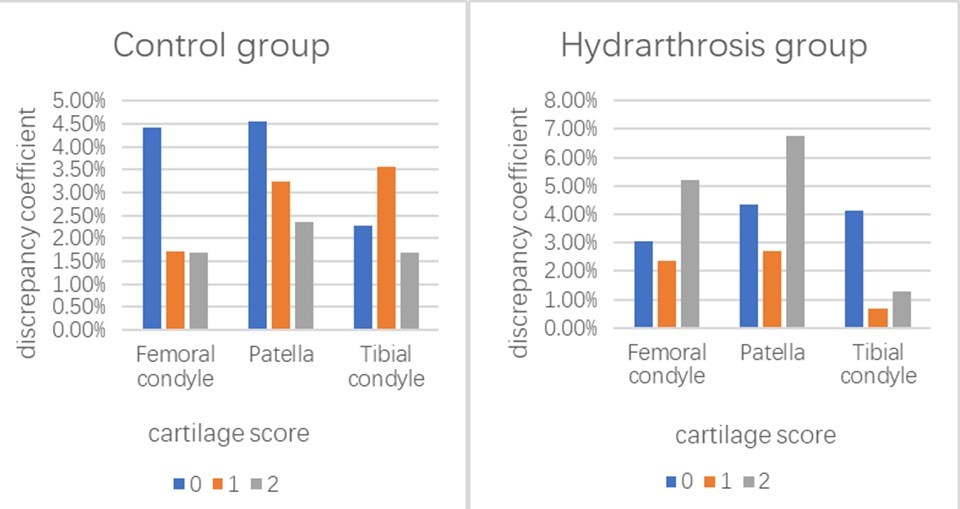
The femoral condyle subregions with higher discrepancy coefficients (>5%) resulting from automated segmentation included the medial anterior (5.7%), the trochlea central (6.6%), and the trochlea lateral (7.7%) . The patella subregions with higher discrepancy coefficients included the medial inferior (7.2%) and the medial central (8.5%) . The medial anterior of the tibia condyle subregion had a discrepancy coefficient of 5.2% (Figure 1).With the increase of joint effusion, the discrepancy coefficient of the patella increased somewhat, but without statistical significance. The femoral condyle and patella had the highest discrepancy coefficients (4.4% and 4.6%) when the cartilage score was 0 in the control group. The femoral condyle and patella had the highest discrepancy coefficients (5.2% and 6.7%, respectively) when the cartilage score was 2 in the hydrarthrosis group (Figure 2). The average time for the automated segmentation software to complete cartilage segmentation was 6 minutes and 14 seconds, while the average time for manual modification was 27 minutes and 23 seconds.Discussion
These results suggest that the use of automated segmentation software results in a low discrepancy coefficient, less than 10%. The location of subregions, the extent of hydrarthrosis, and the level of cartilage degeneration are the most important factors affecting error rates. Under the influence of hydrarthrosis, the discrepancy coefficients of automated segmentation of the femoral condyle and patellar cartilage are significantly increased when the cartilage score is 2. An additional manual correction step based on the results of the automated segmentation was done to improve the accuracy of the quantitative data. Although some subregions required manual correction after automated segmentation was used, automated segmentation saves time. The time involved for manual modification was greater than four times that of automated cartilage segmentation time. In general, the automated cartilage segmentation software has a low discrepancy coefficient and can accurately evaluate the thickness and volume of cartilage. It can provide quantitative information of cartilage morphology within an acceptable time range.Conclusions
Automated segmentation software has a low discrepancy coefficient and can provide accurate quantitative information of cartilage in a short period of time.Acknowledgements
No acknowledgement found.References
1. Lee JG, Gumus S, Moon CH, Kwoh CK, Bae KT: Fully automated segmentation of cartilage from the MR images of knee using a multi-atlas and local structural analysis method. Med Phys 2014, 41:092303.
2. Fripp J, Crozier S, Warfield SK, Ourselin S: Automatic segmentation and quantitative analysis of the articular cartilages from magnetic resonance images of the knee. IEEE Trans Med Imaging 2010, 29:55-64.
3. Surowiec RK, Lucas EP, Fitzcharles EK, Petre BM, Dornan GJ, Giphart JE, LaPrade RF, Ho CP: T2 values of articular cartilage in clinically relevant subregions of the asymptomatic knee. Knee Surg Sports Traumatol Arthrosc 2014, 22:1404-1414.
Figures