2741
Assessment of short-term and mid-term knee cartilage changes before and after marathon running using T2* mapping images
Xiaoshuai Chen1, Ranxu Zhang1, Xiaoyue Zhou2, Esther Raithel3, and Jian Zhao1
1The third Hospital of Hebei Medical University, Shijiazhuang, China, 2Siemens Healthineers Ltd, Shanghai, China, 3Siemens Healthcare, Erlangen, Germany
1The third Hospital of Hebei Medical University, Shijiazhuang, China, 2Siemens Healthineers Ltd, Shanghai, China, 3Siemens Healthcare, Erlangen, Germany
Synopsis
Once articular cartilage is damaged it cannot be readily repaired. However, to what extent marathon running causes cartilage damage to the knees is unclear. We quantitatively assessed the morphologic and T2* value changes in the knee cartilage of marathon runners using an automatic cartilage segmentation method. The cartilage volume, thickness, and T2* values of 21 sub-regions were quantitatively assessed. The results showed that the T2* value of knee cartilage increased right after running and recovered two months later, suggesting that the knee joint cartilage showed a degree of reversible change after marathon running.
Introduction
Among the marathon runners, the annual incidence of muscle and bone injury is as high as 90%, for which the knee joint is most frequently injured. At present, scholars have different views on the impact of marathon running on knee cartilage. Some believe that repeated excessive stress during marathon running and training could exceed knee joint cartilage load capacities, resulting in cartilage injury and secondary knee osteoarthritis, while others believe that the knee joint can withstand the high impact force of marathon running with no cartilage loss[1]. The knee joint contains hyaline cartilage that does not easily repair. A marathon runner might suffer knee cartilage damage from a high-impact long-distance race, leading to biochemical or morphologic cartilage changes. Magnetic resonance imaging (MRI) is a safe and noninvasive method to image knees, and when combined with post-processing, can quantitatively assess articular cartilage thickness, morphology, and biochemical components changes. Changes in T2* values reflect the combined changes of transverse relaxation time and magnetic field non-uniformities and is sensitive to collagen fiber anisotropy and water content in articular cartilage. Therefore, this method is often used to study early cartilage matrix composition changes. In this study, we assessed the extent to which knee cartilage can be damaged in the marathon runners using T2* mapping and high-resolution 3D MRI. Then, we quantitatively investigated the morphologic changes and biochemical components of knee cartilage.Methods
We recruited 15 non-professional marathon runners for this study. At last 8 runners (4 males, 4 females) were included. The participants were between 21 and 37 years of age and had a mean body mass index (BMI) of 17.6 -27.2 kg/m2. Inclusion criteria were (1) age between 18- 40 years, (2) a BMI< 28 kg/m2; (3) no history of knee joint trauma, surgery, or infections, and (4) no history of chronic diseases requiring long-term drug therapy. The exclusion criteria were (1) knee joint trauma occurring during the study period; (2) pre-competition images showing morphologic injury of the articular cartilage; (3) knee joint pain or other positive sign; and (4) MRI contraindications. The right knee joint of each participant was examined using a 3 Tesla (3T) MR scanner (MAGNETOM Verio, Siemens Healthcare, Erlangen, Germany) one week before, and 12 hours and 2 months after a race. A 2D gradient multi-echo sequence was used for the T2*mapping. A 3D-double echo steady-state (DESS) sequence was used for high-resolution morphologic imaging. The knee joint cartilage was segmented and divided into 21 subregions using prototypic software (MR Chondral Health, version 2.1, Siemens Healthcare, Erlangen, Germany). The results from the automatic segmentation were manually fine tuned .The subregions are shown in Figure 1, and segmented cartilage partitions are shown in Figure 2. The T2* value and cartilage volume and thickness of each subregion were derived accordingly. A paired t-test was used to compare the cartilage before and after marathon running. P-values<0.05 were considered statistically significant.Results
A significant difference in the cartilage thickness of the FLC and TLC was found between before and 12 hours after running (P<0.05; Figure 3). The cartilage volume was significantly different in the TLP between before and 12 hours after running (P<0.05; Figure 4). And there is a significant difference in the volume of the FLA and TMA between before and 2 months after running (P<0.05; Figure 4).A significant difference in the T2* value for the FMC, FMA, FLP, FLC, FLA, PLC, PLS,PMI, PMC,PMS, and TMC between before and 12 hours after running (P<0.05; Figure 5). Moreover, a significant difference in the T2* values of the FTM, FLP, and TMA were found between before and 2 months after running (P<0.05; Figure 3).Discussion
From the results, we found that the significant statistical differences of cartilage volume and thickness was smaller than that of T2* value, maybe indicating that changes in the T2* value were more obvious than volume and thickness measurements when evaluating cartilage. When T2* values were compared before, and 12 hours after marathon running, most values increased, indicating that the water content of the cartilage and the direction of the collagen fibers changed during marathon running[2]. However, by comparing the T2* values before and 2 months after running, we found that most cartilage returned to pre-race levels two months after marathon running and that to a certain degree, changes in cartilage after long-distance running could be recovered. According to our study, the cartilage changes caused by marathon running may be recovered after 2 months resting.Conclusions
Biochemical imaging is more sensitive than morphologic examinations to study early changes in cartilage. We found that the T2* value of knee cartilage in marathon runners showed a trend of "first rising and then decreasing," suggesting that articular cartilage showed a degree of reversible change during marathon running.Acknowledgements
None.References
[1] Hohmann E, Wortler K, Imhoff A B. MR imaging of the hip and knee before and after marathon running[J]. Am J Sports Med, 2004, 32(1): 55-9. [2] Morgan P, Nissi M J, Hughes J, et al. T2* Mapping Provides Information That Is Statistically Comparable to an Arthroscopic Evaluation of Acetabular Cartilage[J]. Cartilage, 2018, 9(3): 237-240.Figures
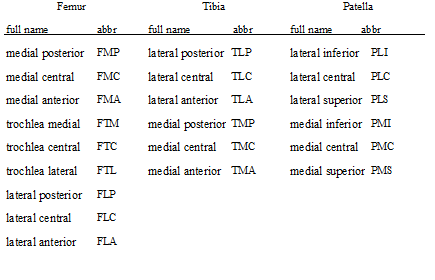
Figure 1: 21 Cartilage subregions with the full names and abbreviations (abbr)
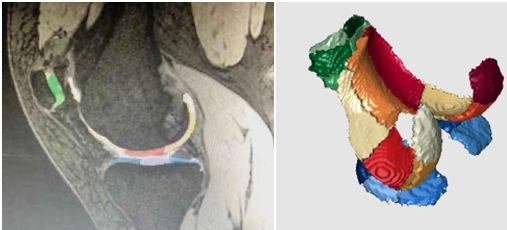
Figure 2: The
software operating interface and cartilage partition display
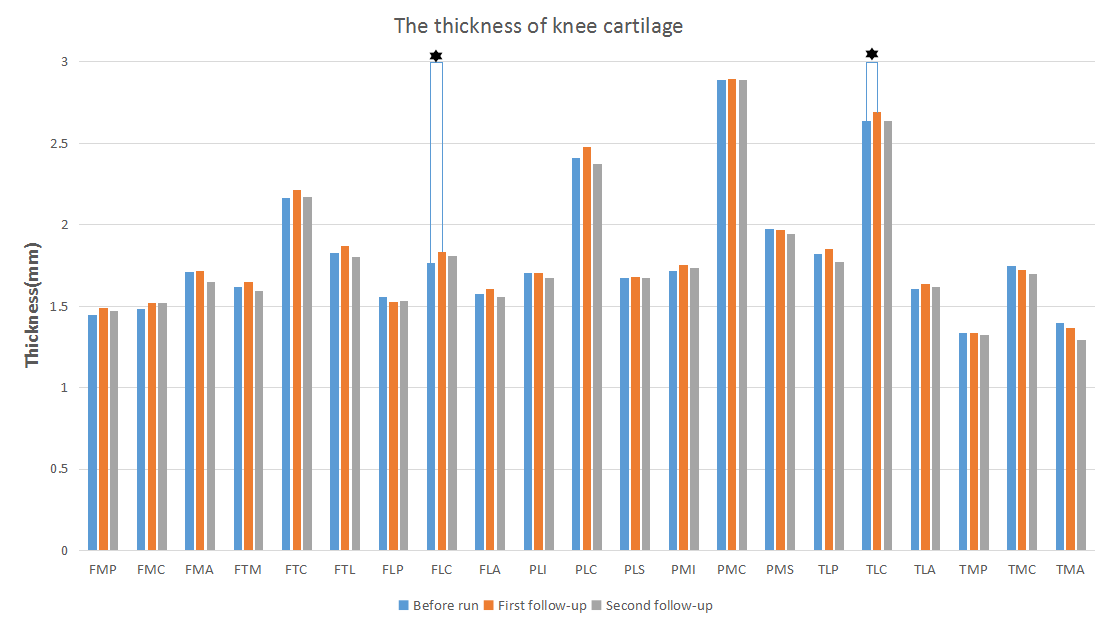
Figure 3: Changes in the thickness
of each cartilage subregion. Asterisks indicate significant differences (See Figure
1 for the abbreviation definitions)
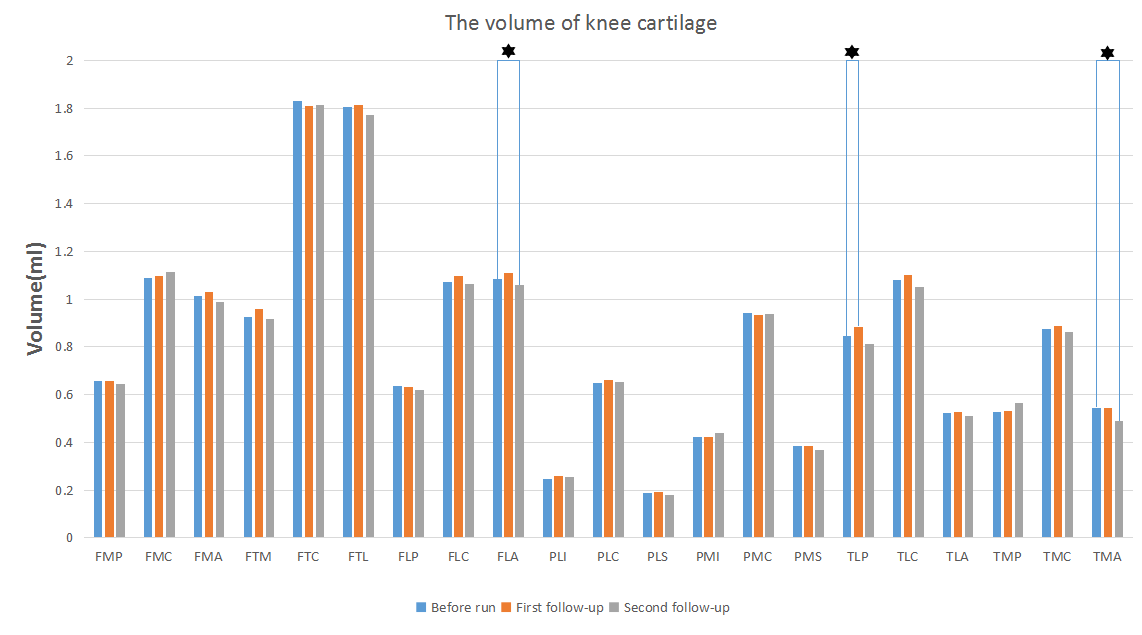
Figure 4: Changes in the volume of each cartilage subregion. Asterisks indicate significant differences (See Figure 1 for the abbreviation definitions)
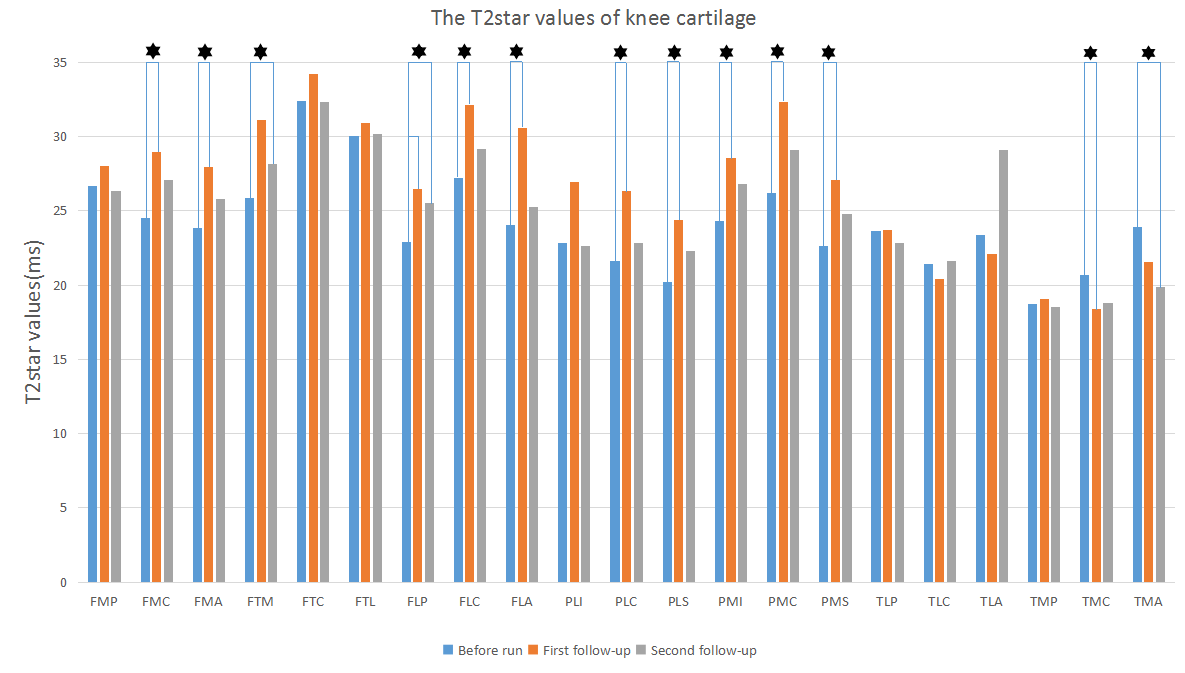
Figure 5: Changes in the T2star values of each cartilage subregion. Asterisks indicate significant differences (See Figure 1 for the abbreviation definitions)