2739
Multiparametric MRI Predicts Articular Cartilage Proteoglycan Content and Collagen Fiber Orientation1Research Unit of Medical Imaging, Physics and Technology, University of Oulu, Oulu, Finland, 2Medical Research Center, University of Oulu and Oulu University Hospital, Oulu, Finland, 3Department of Diagnostic Radiology, Oulu University Hospital, Oulu, Finland, 4Department of Applied Physics, University of Eastern Finland, Kuopio, Finland
Synopsis
In this study, multiparametric MRI was used to predict cartilage proteoglycan content and collagen fiber orientation, as measured by quantitative microscopy. Twenty osteochondral samples were obtained from stifle joints of ten Shetland ponies. Measurements of 14 different MRI parameters, including T1, T2, continuous wave T1rho, adiabatic T1rho and T2rho, and TRAFF were performed at 9.4 T. Three ensemble-based regression models (Gradient Boosting, Random Forest and Extra Trees) were used and the highest coefficients of determination (r2) were 0.77 for collagen orientation and 0.62 for proteoglycan content. These findings show that multiparametric MRI can be used to non-invasively estimate cartilage histology.
Introduction
Quantitative MRI (qMRI) methods have been investigated extensively to detect early changes in articular cartilage1. Established qMRI parameters, such as T1, T2 and T1rho, have been shown to reflect, each to a different extent, the macromolecular content and structural organization of cartilage2-4. However, accurate tissue characterization remains challenging due to limited specificity of qMRI parameters to single cartilage matrix components. Multiparametric approaches have shown improved performances in estimating cartilage degradation5,6. The aim of this study was to use different ensemble regression models to predict compositional and structural properties of articular cartilage, i.e. proteoglycan (PG) content and collagen fiber orientation from combined use of multiple qMRI parameters (T1, T2, continuous wave T1rho, adiabatic T1rho, adiabatic T2rho and TRAFF).Methods
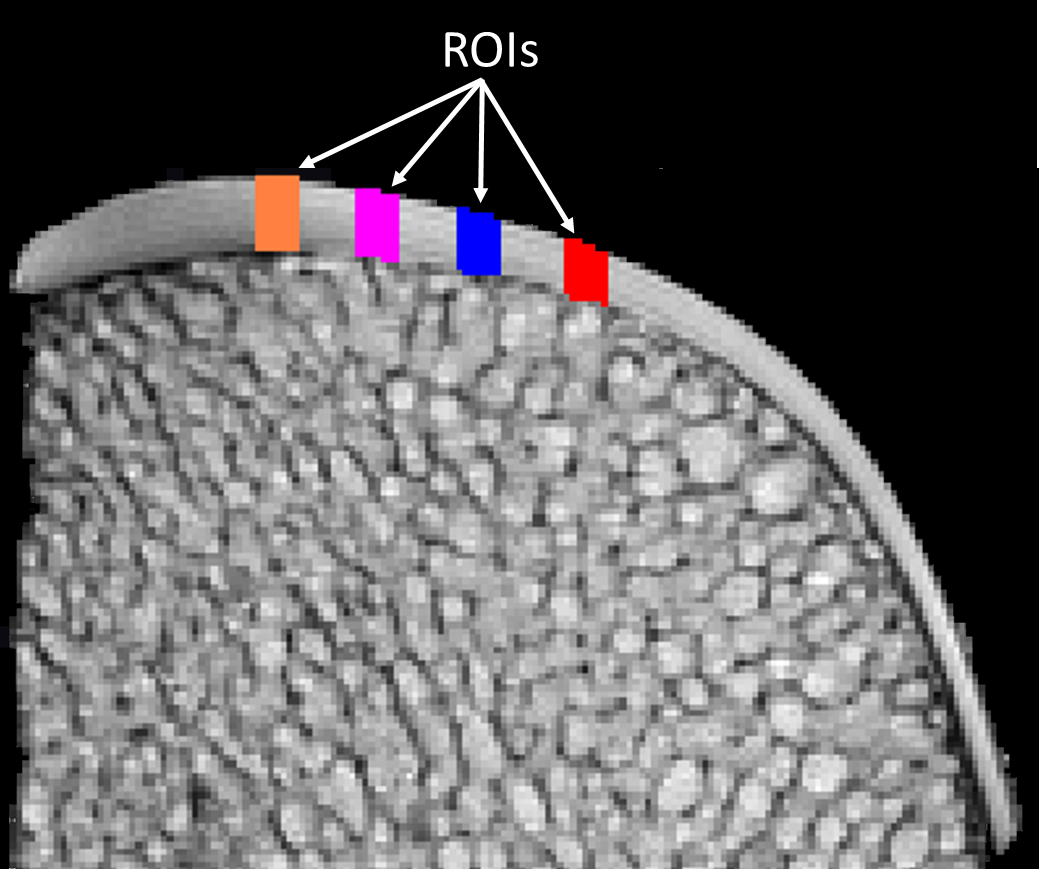
The study had been approved by the local ethical committee of Utrecht University in compliance with the Dutch Act on Animal Experimentation. Mildly osteoarthritic and control samples (n=20) were obtained from the stifle joints of Shetland ponies (N=10). The imaging was performed at 9.4 T using a 19-mm quadrature RF transceiver (RAPID Biomedical GmbH, Rimpar, Germany). qMRI relaxation time measurements for T1, T2, CWT1rho at varying spin-lock amplitudes (γB1 = 100, 200, 300, 400, 500, 600, 800, 1000 and 2000 Hz), adiabatic T1rho, adiabatic T2rho and TRAFF were measured by coupling a preparation block to a fast spin-echo readout (TR = 5 s, ETL = 8, TEeff = 4.2 ms, matrix size = 192×192, slice = 1 mm, FOV = 19.2×19.2 mm2).For the analysis, four full-thickness cartilage regions of interest (ROIs) were defined for each sample (Figure 1), and then the qMRI relaxation time maps in the ROIs were calculated using MATLAB script. The relaxation time values across cartilage thickness (20 depth-wise points) obtained from the ROIs, were concatenated throughout all samples, creating a vector of 1600 points (20 depth-wise points x 4 ROIs x 20 samples = 1600 data points) for each qMRI parameter. For each ROI, corresponding regions from digital densitometry (DD), indicative of PG content, and polarized light microscopy (PLM), indicative of collagen fiber orientation, were utilized.
Sklearn package in Python and SPSS (version 25) were used to build the machine learning pipeline and conduct statistical analysis. Three ensemble-based regressors were developed: Gradient Boosting Regressor (GBR), Random Forest Regressor (RFR) and Extra Trees Regressor (ETR). To test the regressors, 20 percent of the independent variables (qMRI parameters) and dependent variables (PLM and DD) were extracted randomly. To avoid over-fitting and optimize hyper-parameters, cross-validated grid-search object was implemented in the training phase. To evaluate the performance of the models, regression metrics in testing phase were used: mean absolute error, median absolute error and coefficient of determination (r2). In addition, Pearson correlation coefficients (r) were calculated for all regressors. To compare contribution of each qMRI parameter, feature importance attribute, based on mean decrease in impurity, was used. In addition, ANOVA filter procedure, calculation of F-score between each independent and dependent variable, was performed as a baseline feature selection method. Feature-importance values of the regressors and F-scores were normalized.
Results
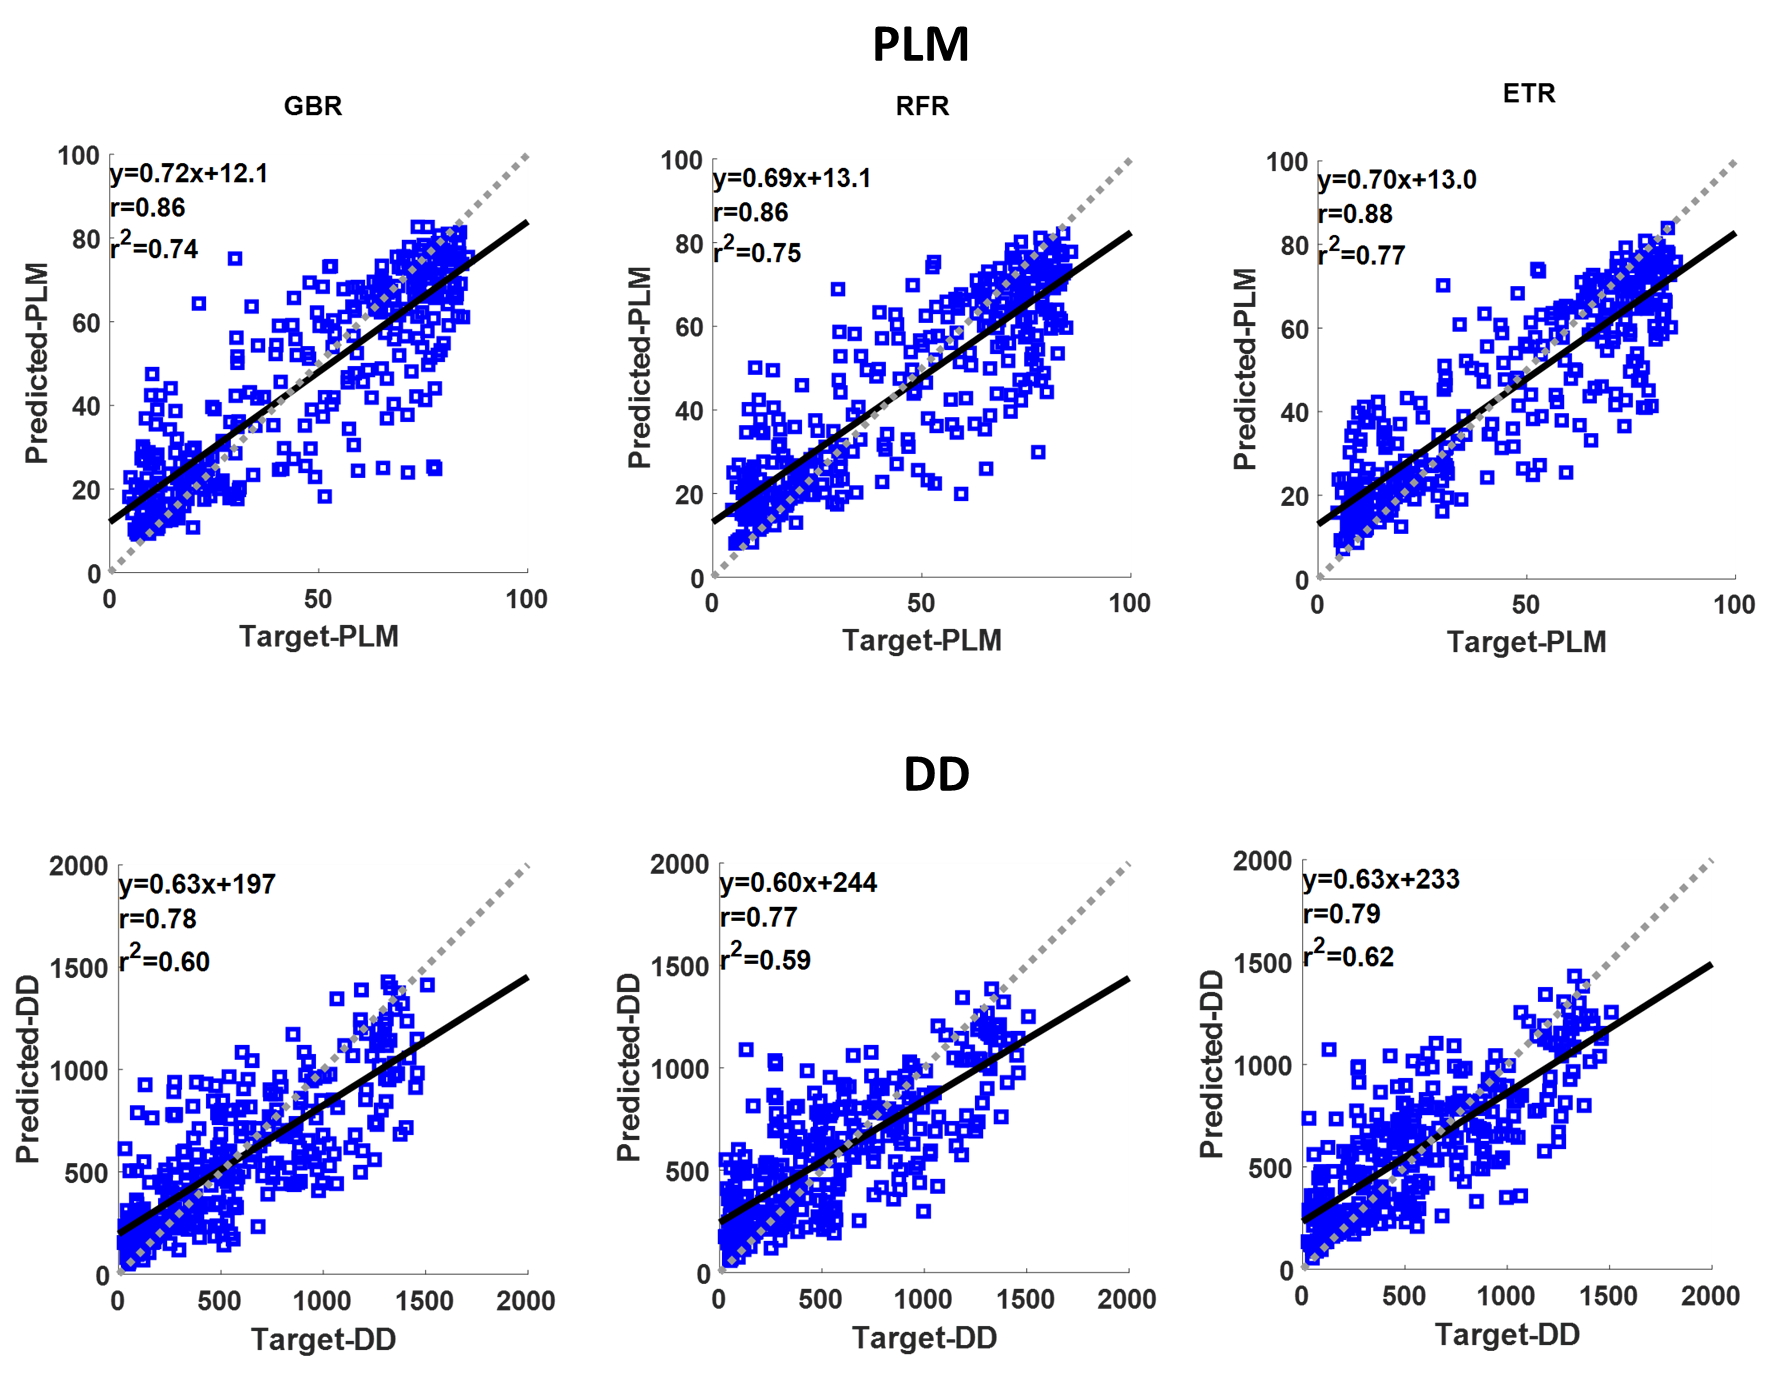
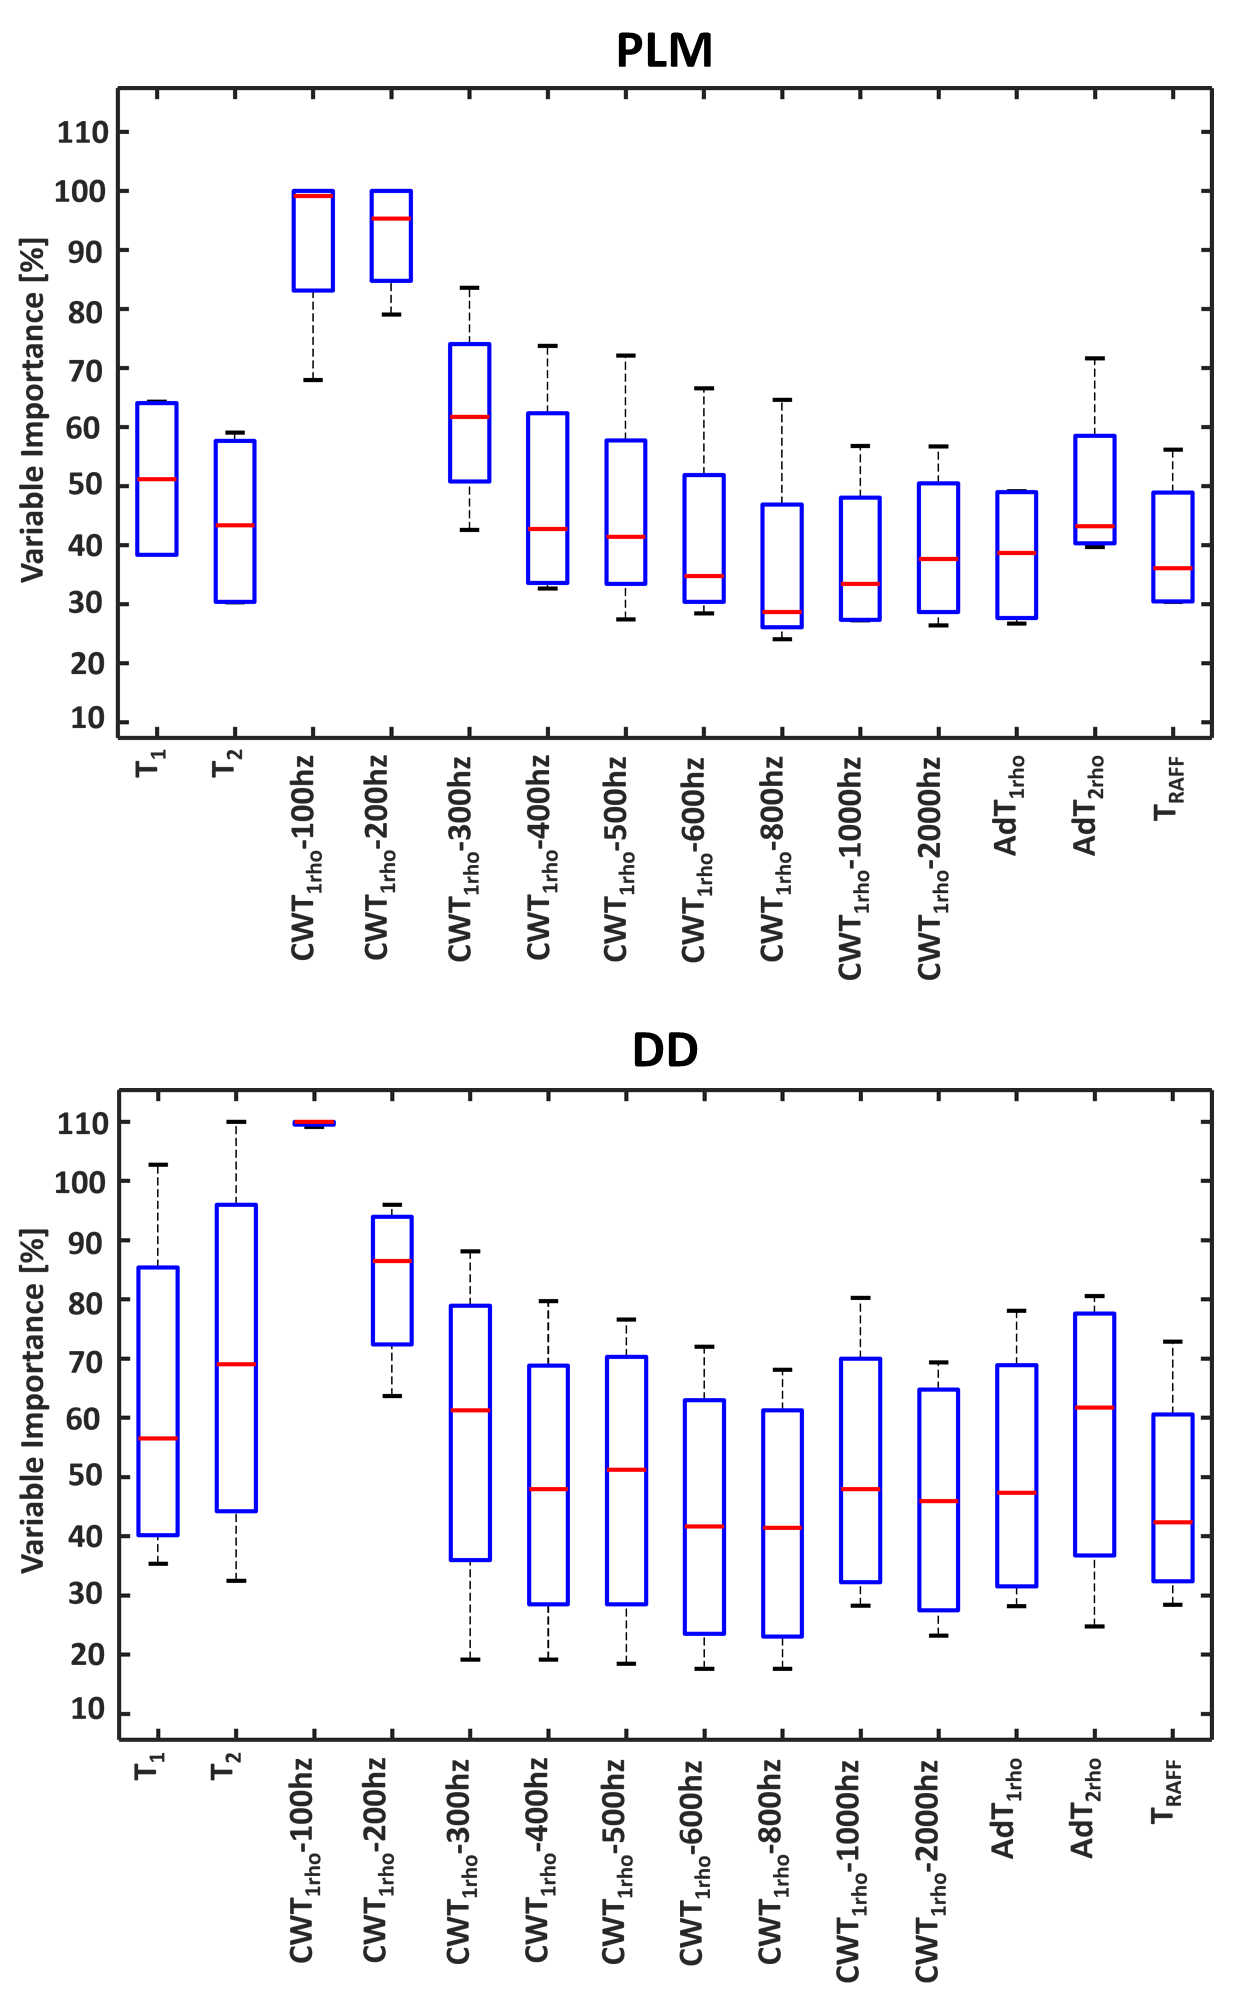
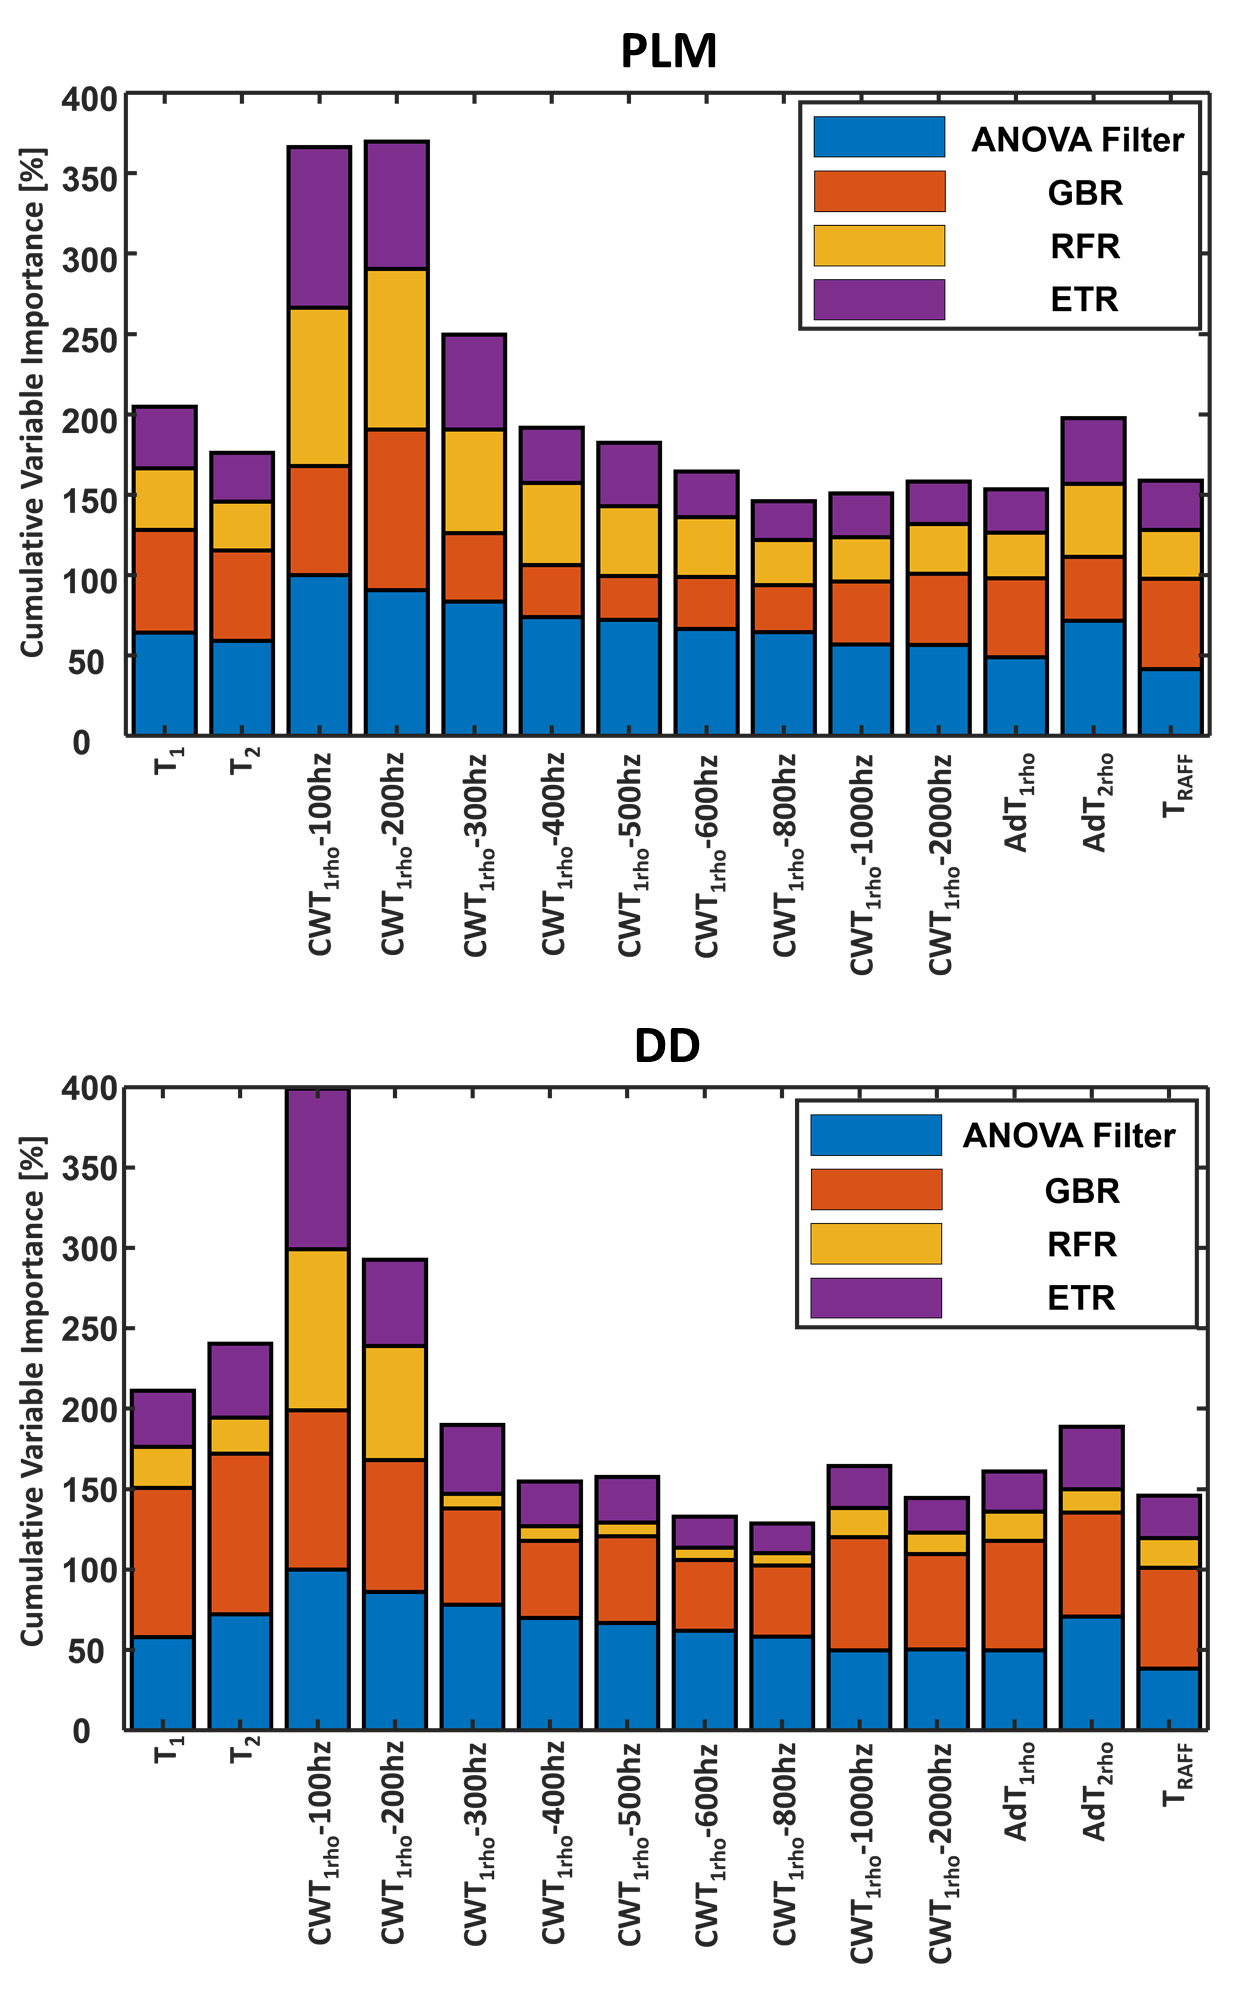
ETR outperformed GBR and RFR regressors in terms of lower mean absolute error and median absolute error, and higher r2. ETR was found to have the highest prediction accuracy for both PLM (r2=0.77, p<0.01) and DD (r2=0.62, p<0.01), as compared to GBR and RFR (Figure 2). Strong correlations were observed between the predicted and actual PLM, and between the predicted and actual DD with all regressors (p<0.01) (Figure 2). ANOVA filter, ETR, GBR and RFR indicated that CWT1rho at (γB1=100 Hz) and (γB1=200 Hz) had the greatest variable importance to PLM and to DD prediction (Figures 3-4).Discussion
In the current study, multiparametric MRI was able to explain 77% of the variance embedded into PLM and 62% in DD. Previously, models based on the combination of 2 to 4 qMRI parameters measured at 9.4 T have shown the ability to distinguish between immature and mature engineered cartilage7. Furthermore, different combinations of the same qMRI parameters have demonstrated high accuracy to classify degenerated tissue and strong correlations with tissue hydration and sGAG (PG) content in bovine nasal cartilage5,6. Similarly at 3 T, combinations of 2 to 4 qMRI parameters have shown high accuracy in detecting histological degeneration in human articular cartilage8. Significant correlations have been determined with PLM (r = 0.68) and DD (r =0.67) using combined T2* and quantitative susceptibility maps from the same specimens as those used in this study9. In the present study, 14 combined qMRI parameters were strongly correlated with collagen fiber orientation (r = 0.86-0.88) and PG content (r = 0.77-0.79). Analyzing the variable importance of each parameter, CWT1rho at low spin-lock amplitudes (γB1=100, 200 Hz) was found to be the most important predictor for collagen fiber orientation and PG content.Conclusion
These findings show that multiparametric MRI can be used for non-invasive prediction of quantitative histology of cartilage tissue. CWT1rho at low spin-lock amplitudes (γB1=100-200 Hz) appeared as the most important qMRI parameter to predict collagen orientation and proteoglycan content in articular cartilage.Acknowledgements
Support from Jane and Aatos Erkko Foundation, and the Academy of Finland (grants #285909, #293970, #319440 and #297033) is gratefully acknowledged.References
1. Guermazi A, Alizai H, Crema M, et al. Compositional MRI techniques for evaluation of cartilage degeneration in osteoarthritis. Osteoarthr cartil. 2015;23:1639-1653.
2. Berberat JE, Nissi MJ, Jurvelin JS et al. Assessment of interstitial water content of articular cartilage with T1 relaxation. Magn Reson Imaging. 2009;27:727-732.
3. Nissi MJ, Rieppo J, Toyras J, et al. T(2) relaxation time mapping reveals age- and species-related diversity of collagen network architecture in articular cartilage. Osteoarthr Cartil. 2006;14:1265-1271.
4. Akella SV, Reddy Regatte R, Gougoutas AJ, et al. Proteoglycan‐induced changes in T1ρ‐relaxation of articular cartilage at 4T. Magn Reson Med. 2001;46:419-423.
5. Lin P, Reiter DA & Spencer RG. Classification of degraded cartilage through multiparametric MRI analysis. J Magn Reson Imaging. 2009;201:61-71.
6. Lin P, Irrechukwu O, Roque R, et al. Multivariate analysis of cartilage degradation using the support vector machine algorithm. Magn Reson Med. 2012;67:1815-1826.
7. Reiter DA, Irrechukwu O, Lin P, et al. Improved MR‐based characterization of engineered cartilage using multiexponential T2 relaxation and multivariate analysis. NMR Biomed. 2012;25:476-488.
8. Lukas VA, Fishbein KW, Lin P, et al. Classification of OARSI Scored Human Articular Cartilage Explants Through Multiparametric MRI Analysis at 3T. Magn Reson Med. 2012;67:1086-1096.
9. Nykänen O, Sarin JK, Ketola JH, et al. T2* and quantitative susceptibility mapping in an equine model of post-traumatic osteoarthritis: assessment of mechanical and structural properties of articular cartilage. Osteoarthr Cartil. 2019;27:1481-1490.
Figures