2738
Detecting Early Changes in ACL-Reconstructed Knees: Cluster Analysis of T2 Relaxation Times from 3 Months to 18 Months Post-Surgery1Radiology, Stanford University, Stanford, CA, United States, 2Mechanical Engineering, Stanford University, Stanford, CA, United States, 3Massachusetts General Hospital, Boston, MA, United States, 4Mechanical Engineering, University of Saskatchewan, Saskatoon, SK, Canada, 5Bioengineering, Stanford University, Stanford, CA, United States, 6Electrical Engineering, Stanford University, Stanford, CA, United States
Synopsis
There is a need to detect and quantify early osteoarthritic changes for the development of treatments for osteoarthritis progression. ACL-injured subjects are at an increased risk of developing osteoarthritis, and T2 is sensitive to the structure and composition of cartilage, including osteoarthritic change. This study used a quantitative DESS acquisition to obtain T2 maps in 10 subjects 3-weeks, 3-months, 9-months, and 18-months after ACL reconstruction surgery and 10 controls at matched times. Our results show that T2 cluster analysis was able to detect changes to the ACL-reconstructed cartilage as early as 3-months post-surgery and these differences persisted at 18-months.
Introduction
Anterior Cruciate Ligament (ACL) tears put individuals at a significantly elevated risk of developing osteoarthritis (OA), whether the ACL has been surgically reconstructed or not1,2. T2 relaxation time mapping has been shown to detect differences between healthy and ACL-injured knee cartilage within a year post-surgery in femoral cartilage using a cluster analysis method that detects local areas of elevated T2, rather than averaging the entire cartilage3,4. Superficial and deep layers of cartilage have different compositions and are affected differently during OA development; thus, analyzing these layers separately may allow for additional sensitivity to changes that may otherwise be undetected using full-thickness cartilage analysis. The objective of this study was to evaluate if changes in deep and superficial cartilage following ACL-reconstruction surgery can be observed using a cluster analysis approach that detects elevated T2 relaxation times over a longitudinal analysis.Methods
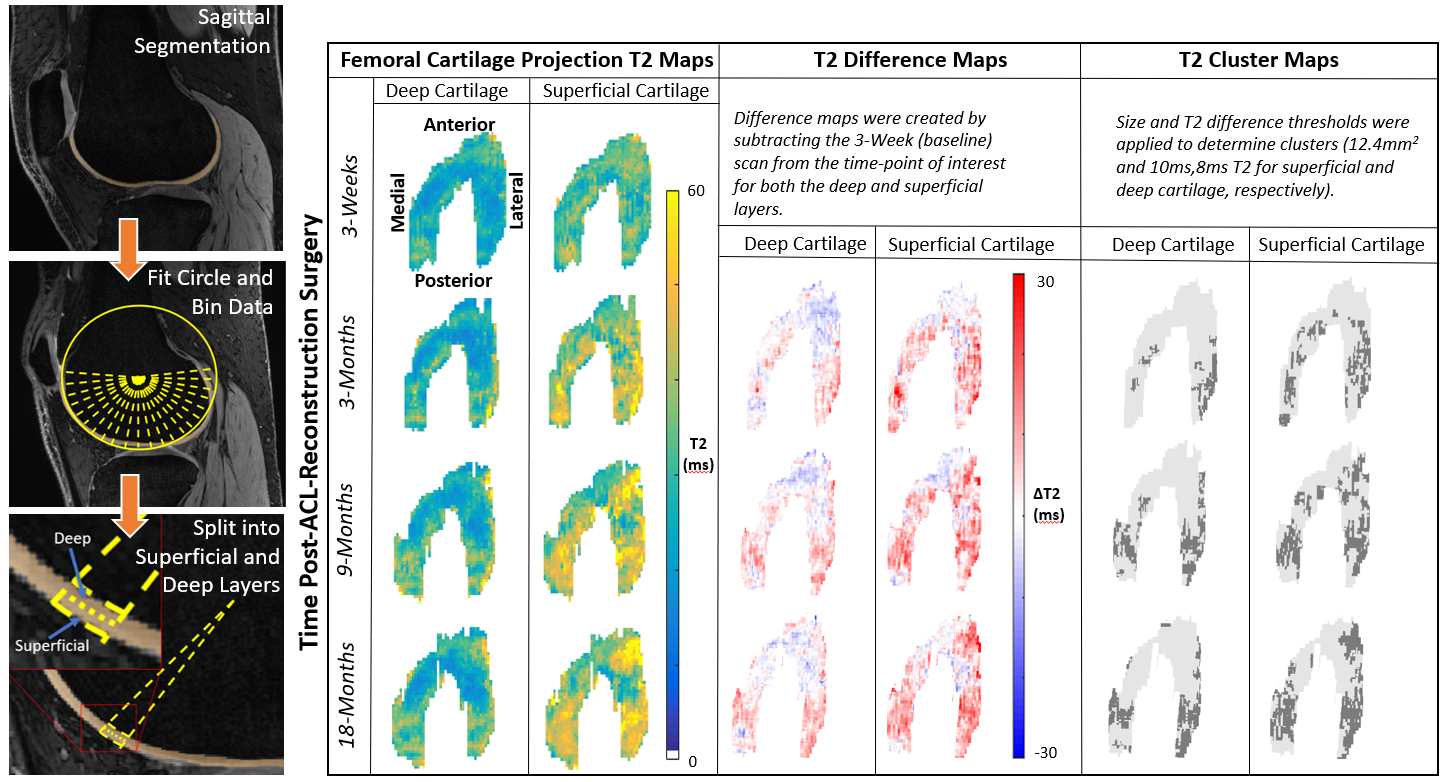
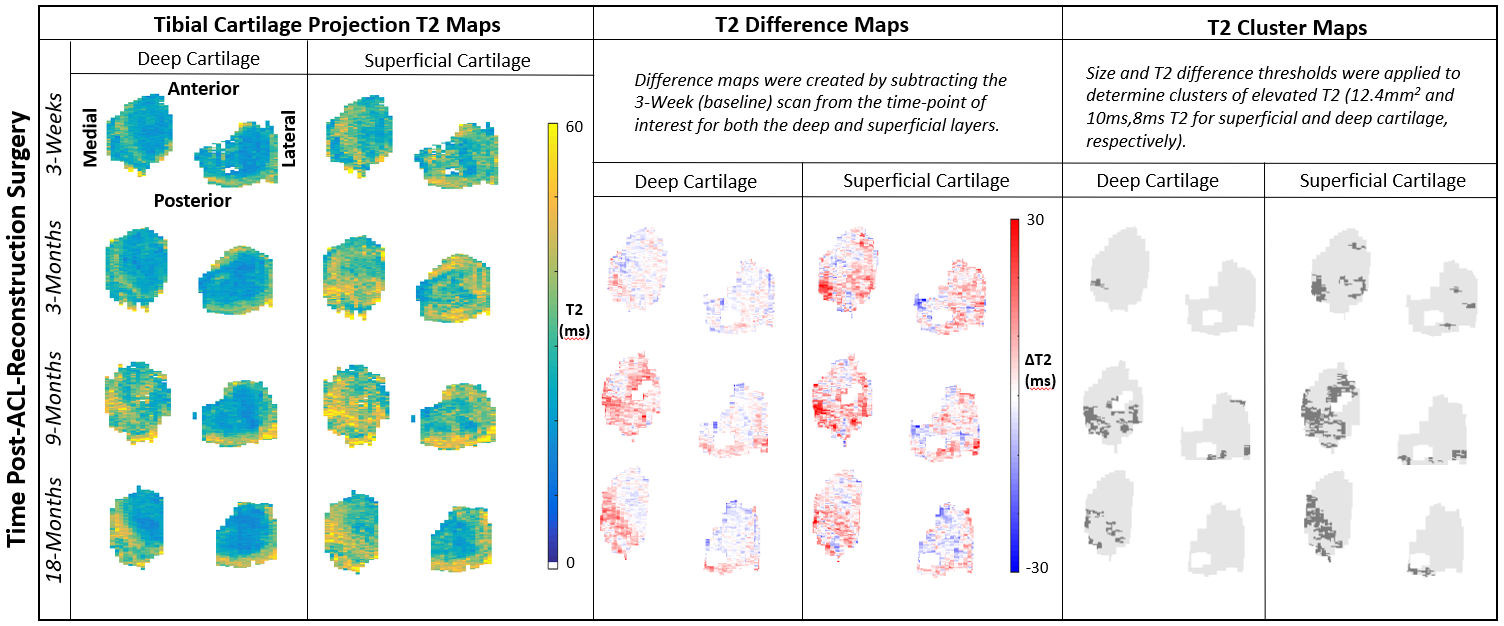
10 ACL-injured subjects undergoing ACL-reconstruction surgery (5W/5M, 39±12 years, BMI: 23 ± 1.5) and 10 matched controls (5W/5M, 37±13 years, BMI: 23 ± 1.5) were included in this study. The ACL-reconstructed and contralateral knees of the ACL-reconstructed subjects, and the right knee of the control subjects were scanned in a 3T MRI scanner using a quantitative double-echo in steady-state (qDESS) sequence (5-minute scan-time per knee) at 4 time-points: 3-weeks (baseline), 3-months, 9-months, and 18-months post-ACL-reconstruction.Two qDESS echoes were used to calculate T2 with a simple analytical model5. The femoral and tibial cartilage were manually segmented slice-by-slice in the sagittal plane. Femoral cartilage T2 projections were created by fitting a cylinder (axis medial-to-lateral) to the segmentations and radially projecting the data into angular bins3 (Figure 1), and tibial cartilage projections were created by axially projecting the tibial cartilage segmented T2 values. Cartilage maps were further separated into superficial and deep layers based on the midpoint of cartilage thickness. Femoral and tibial cartilage T2 projections were registered to the baseline time point for each knee using Elastix6, and difference maps were created by subtracting the baseline projection from each of the 3-,9-, and 18-month projections (for both superficial and deep T2 maps separately) (Figure 1 and 2). Clusters in these difference maps were quantified as a contiguous set of pixels with an area greater than 12.4mm2 consisting of values greater than twice the standard deviation of the control subjects’ difference maps: 10ms for superficial cartilage, 8ms for deep cartilage (Figure 1 and 2)3. Our outcome was reported as the change in T2 percent cluster area (ΔT2%CA), defined as the combined area of all clusters of pixels that meet the defined thresholds divided by the total cartilage area. We used a general linear model with Bonferroni’s correction to test for differences in ΔT2%CA between ACL-reconstructed, contralateral, and control knees (α<0.05).
Results
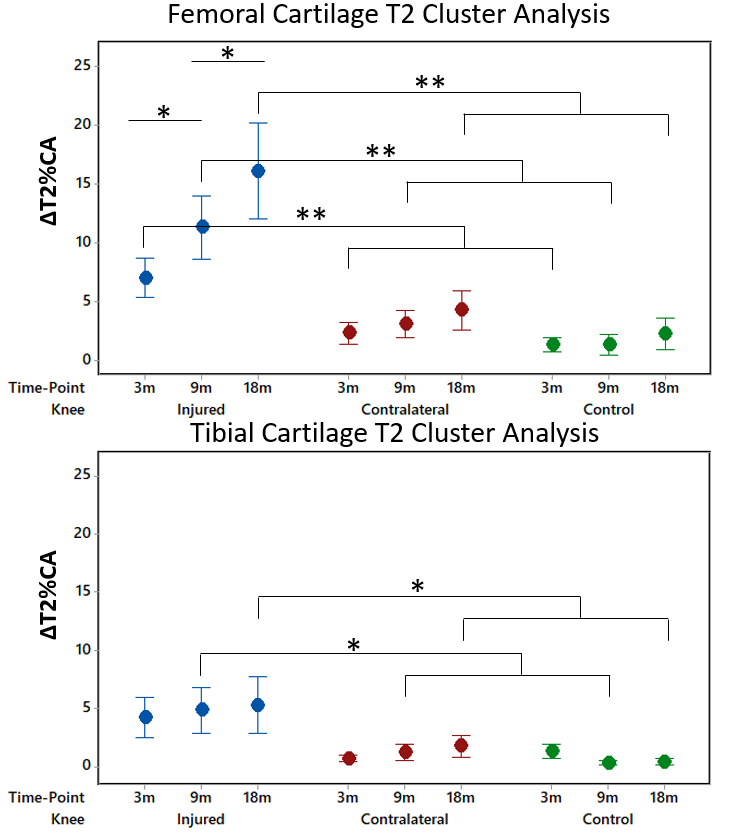
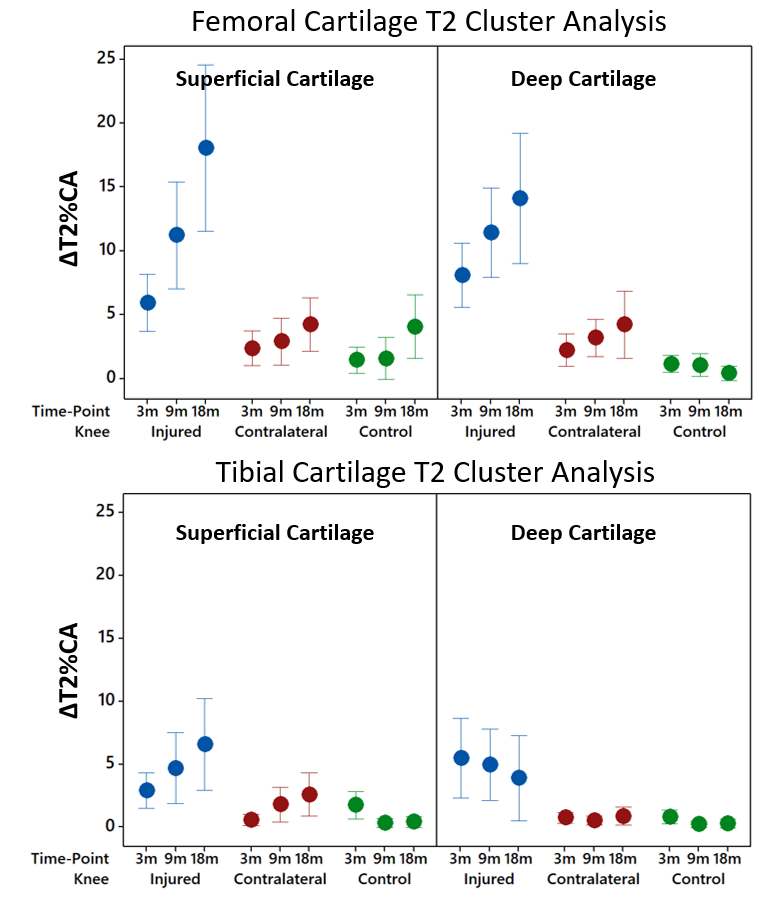
The ACL-reconstructed knee’s ΔT2%CA progressively increased in the femoral cartilage (combined superficial and deep layers). Even 3-months following surgery, the cluster analysis method could detect an increase in ΔT2%CA in femoral cartilage that was significantly higher than that of both the contralateral knee (P=0.001) and the control knee (P<0.001). At 9 months, the femoral cartilage ΔT2%CA for the ACL-reconstructed knee had increased significantly (P=0.006) from the 3-month time-point by 4%, and increased another 4% from the 9-month to 18-month time-point (P=0.006) (Figure 3).While ΔT2%CA in tibial cartilage did not significantly differ from that of controls at 3-months (P=0.692), by 9-months the ΔT2%CA was significantly higher than the control (P=0.007), and this significant difference persisted between the injured and control knee at 18-months (P=0.010) (Figure 3). Trends in the deep vs superficial zones were apparent, including slightly decreasing ΔT2%CA in the tibial superficial layer over time, as opposed to progressively increasing ΔT2%CA in the deep zone (Figure 4).
Discussion
Cluster analysis to detect local elevated T2 relaxation times in cartilage shows excellent potential as a method for tracking degenerative changes, based on its ability to detect differences in cartilage merely 3 months following ACL-reconstruction surgery that persist at the 18-month post-surgery time-point. These elevated ΔT2%CA for ACL-reconstructed compared to the contralateral and control knees is indicative of potentially early osteoarthritic changes following ACL-reconstruction surgery. The ΔT2%CA is representative of local, elevated T2 and could represent specific areas within cartilage where degeneration initiates, as T2 is considered to be indicative of collagen and water content7. Early detection of cartilage changes is necessary to stop the progression of OA, and the T2 cluster analysis method may be ideal for detecting early cartilage degeneration, and monitoring the effect of disease modifying treatments.Conclusion
ACL-reconstructed knees show early elevations in ΔT2%CA that also persist 18 months following surgery. This non-invasive and objective method may allow detection of the earliest changes in osteoarthritis degeneration and have the potential to track the effect of disease modifying treatments on cartilage health. Importantly, the 5-minute scan-time needed to acquire the qDESS images also makes this method feasible for large population studies of osteoarthritis.Acknowledgements
NIH R01 AR0063643-05, NIH R01 EB002524-14, NIH K24 AR062068-07, GE Healthcare.References
1. D. Simon, R. Mascarenhas, B.M. Saltzman, M. Rollins, B. R. Bach Jr., and P.MacDonald, “The Relationship between Anterior Cruciate Ligament Injury and Osteoarthritis of the Knee,” Advances in Orthopedics, vol. 2015, Article ID 928301, 11 pages, 2015.
2. D.E. Meuffels, M.M. Favejee, M.M. Vissers, et al, “Ten year follow-up study comparing conservative versus operative treatment of anterior cruciate ligament ruptures. A matched-pair analysis of high level athletes,” British Journal of Sports Medicine 2009;43:347-351.
3. U.D. Monu, C.D. Jordan, B.L. Samuelson, B.A. Hargreaves, G.E. Gold, E.J. McWalter, “Cluster analysis of quantitative MRI T2 and T1ρ relaxation times of cartilage identifies differences between healthy and ACL-injured individuals at 3T”, Osteoarthritis and Cartilage, Volume 25, Issue 4, 2017, Pages 513-520, ISSN 1063-4584.
4. Black M, Yoon D, Young K, Chaudhari AS, Kogan F, Gold GE, Levenston ME, Hargreaves B. “Detecting early changes in ACL-reconstructed knee cartilage: Cluster analysis of T2 relaxation times in superficial and deep cartilage and ADC analysis”. 27th Annual Meeting of ISMRM, Montreal 2019, p. 1322.
5. B. Sveinsson, A.S. Chaudhari, G.E. Gold, B.A. Hargreaves, “A simple analytic method for estimating T2 in the knee from DESS”, Magnetic Resonance Imaging, Volume 38, 2017, Pages 63-70, ISSN 0730-725X.
6. S. Klein, M. Staring, K. Murphy, M.A. Viergever and J.P.W. Pluim, "elastix: a toolbox for intensity based medical image registration," IEEE Transactions on Medical Imaging, vol. 29, no. 1, pp. 196 - 205, January 2010.
7. S. J. Matzat, J. van Tiel, G. E. Gold GE, E. H. G Oei (2013) “Quantitative MRI techniques of cartilage composition”. Quant Imaging Med Surg 3:162–174.
Figures