2737
qDESS ADC as a Biomarker for Early Degeneration in Femoral Cartilage of Post-Reconstruction ACL Tear Patients and Correlation with DWI-EPI ADC1Mechanical Engineering, Stanford University, Stanford, CA, United States, 2Radiology, Stanford University, Stanford, CA, United States, 3Massachusetts General Hospital, Boston, MA, United States, 4Mechanical Engineering, University of Saskatchewan, Saskatoon, SK, Canada, 5Bioengineering, Stanford University, Stanford, CA, United States, 6Electrical Engineering, Stanford University, Stanford, CA, United States
Synopsis
This study evaluates apparent diffusion coefficient (ADC)
as measured by a quantitative double echo steady state (qDESS) sequence as a
biomarker for early osteoarthritis detection in articular cartilage in the femur
and its correlation with ADC from a diffusion weighted echo planar (DWI-EPI) scan. 9 injured knees and contralateral knees of patients
undergoing reconstruction surgery following anterior cruciate ligament tears
were scanned with qDESS and DWI-EPI sequences up to 18 months post surgery.
There were no consistent patterns of qDESS ADC change on a global or
regional basis in the femoral cartilage.
qDESS ADC did not correlate with DWI-EPI ADC.
Introduction
Osteoarthritis (OA) is an expensive1, painful, and progressive joint disease. The ACL tear population is commonly used to study early changes related to osteoarthritis, due to their elevated risk of developing disease. Recently, a method for generating ADC measurements in articular cartilage using a quantitative double echo steady state (qDESS) sequence was introduced2,3, which could have benefits over traditional ADC measurement sequences due to the lack of distortion and ability to simultaneously measure other quantitative parameters such as T2 relaxation time. ADC has been associated with the structural integrity of the collagen matrix in cartilage4, and therefore could be a useful diagnostic biomarker. In this study, qDESS ADC is tracked longitudinally in a group of ACL tear patients post reconstruction surgery and compared to diffusion weighted echo planar (DWI-EPI) ADC as a preliminary investigation into the utility of qDESS ADC as a biomarker for early OA detection.Methods
9 ACL tear patients’ (Age: 38.9±12.0 years, BMI: 23.6±1.3, 5F, 4M) injured and contralateral knees and 9 age, BMI, and sex-matched control knees (Age: 40.1±10.8 years, BMI: 23.2±1.5, 5F, 4M) were scanned at a 3T GE SIGNA Premier scanner using a 16-channel flex knee coil with both qDESS (512x512 pixels, 160x160mm FOV, 1.5mm slice thickness, 22.152ms TR, 6.268ms TE) and DWI-EPI (256x256 pixels, 160x160mm FOV, 3mm slice thickness, 1000ms TR, 70ms TE) sequences. The qDESS data were manually segmented slice by slice. A rigid registration was performed in Elastix5 to correct misalignments between the first and second DESS scans required for ADC calculation. ADC was computed by comparing the ratios of the DESS echo signals acquired with a high diffusion gradient and one with a low diffusion gradient to theoretical models2,3. DWI-EPI scans were registered to qDESS anatomical scans using a non-rigid registration in Elastix5. ADC was calculated by monoexponential fitting of the signal intensity at 4 different B-values (0, 200, 400, 600 s/mm2). 2D projection maps of the femoral cartilage6 were generated for each scan. Each projection map was subdivided into six regions of full thickness cartilage. qDESS data were analyzed with a multi-factor repeated measures ANOVA with significance at p<0.05 and Bonferroni’s test for pairwise comparisons to investigate the effects of knee type (injured, contralateral, or control), time point post surgery (3 weeks, 3 months, 9 months, 18 months), and cartilage region (medial/lateral, anterior/central/posterior), on calculated ADC. Linear regression was used to compare qDESS ADC and DWI-EPI ADC regional averages for all scans of all knees.Results
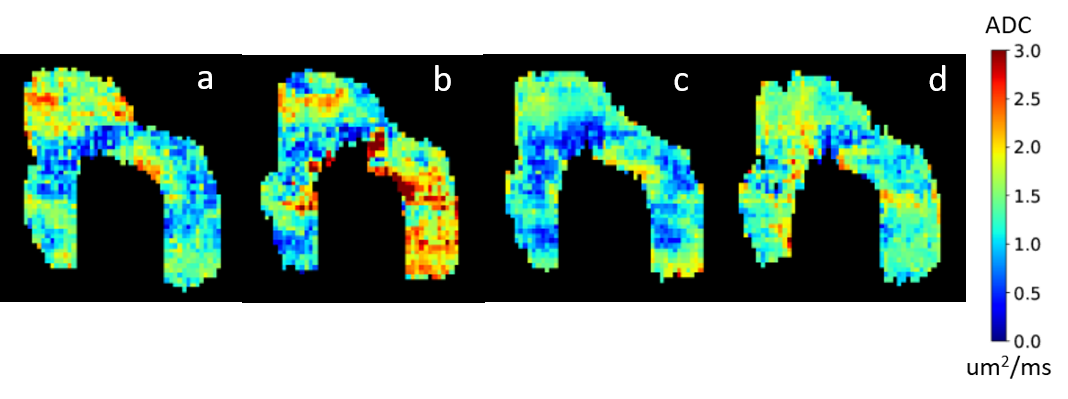
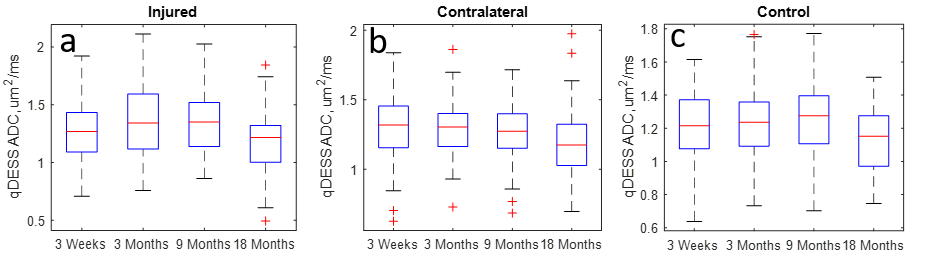
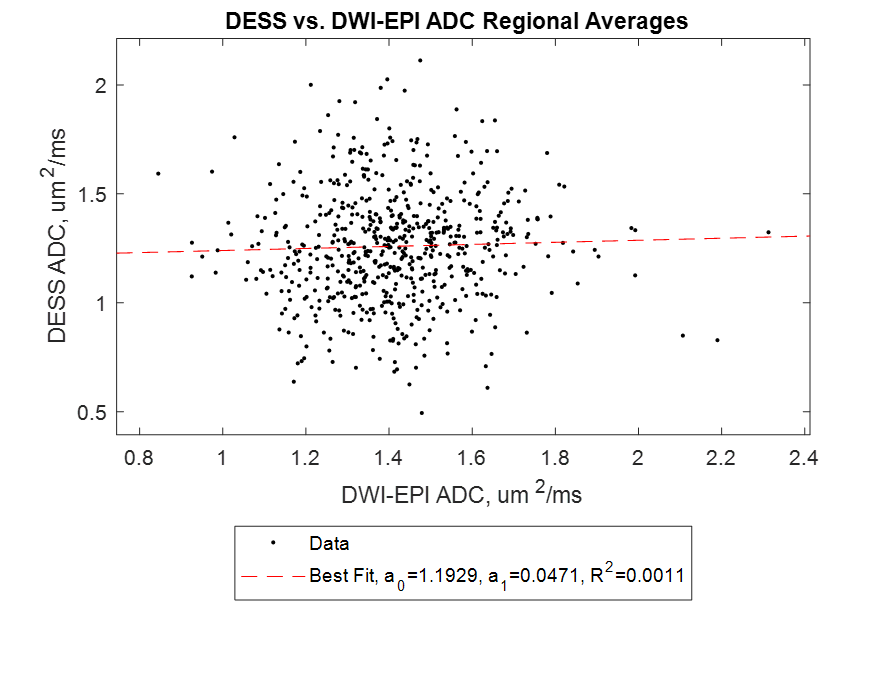
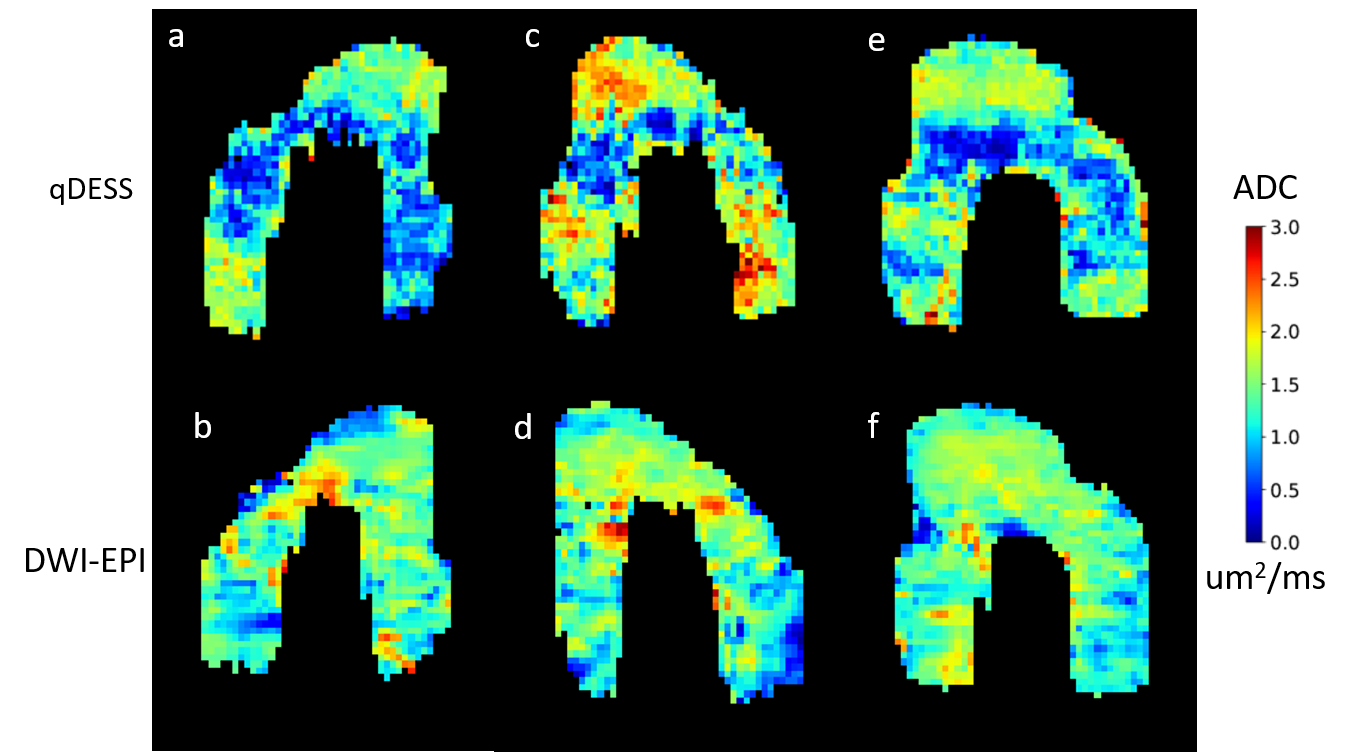
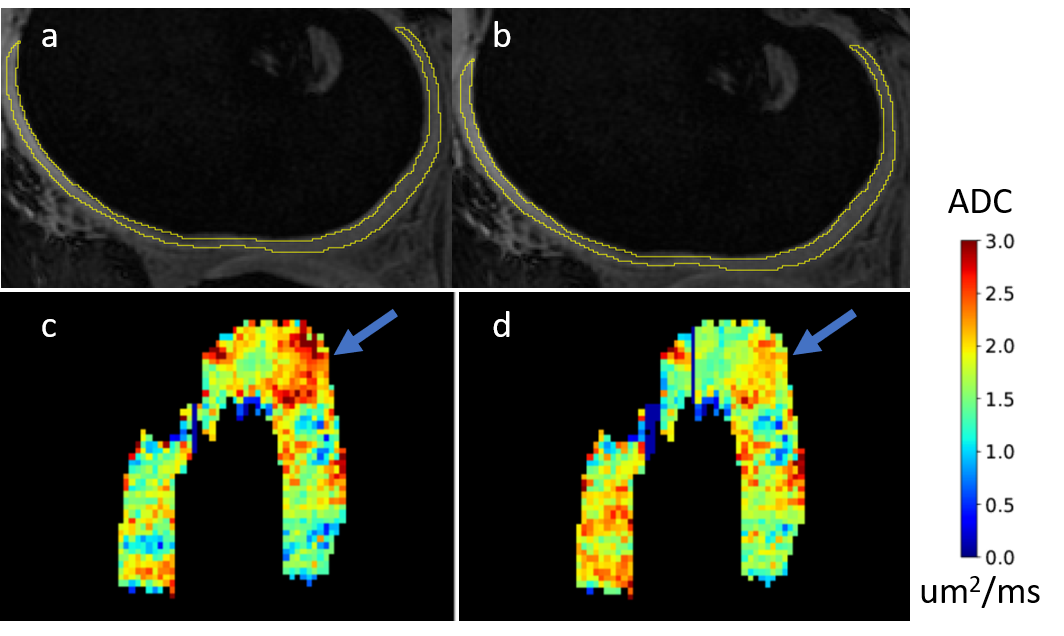
A time series of representative projection maps show longitudinal variation in ADC (Figure 1). There were no consistent patterns of significant differences between time points or between control, contralateral, and injured knees at different time points, either globally or in each specific region of cartilage. Box plots for overall qDESS ADC values at each time point for control, contralateral, and injured knees are shown in Figure 2. qDESS ADC and DWI-EPI ADC were not correlated (R2 = 0.0011) in this population when full thickness regional averages from the same scans were compared using linear regression (Figure 3). Examination of individual projection maps confirm this lack of correlation (Figure 4). Registration of the first qDESS scan to the second removed patches of high ADC in some areas of the resulting projection maps (Figure 5).Discussion
There were no consistent patterns ndicating that qDESS ADC can detect changes related to OA up to 18 months post ACL reconstruction surgery. The fact that no significant effects on qDESS ADC were observed up to the 18 month time point could be an indication that the collagen matrix has not changed enough for there to be detectable ADC changes. The earliest changes in cartilage related to OA tend to be proteoglycan loss which is more strongly associated with other quantitative MRI parameters such as T2 and T1ρ4. The lack of correlation between qDESS ADC and DWI-EPI ADC was surprising. Given that they are very different sequences, ADC values were expected to be different, but correlated. This could be because ADC, regardless of how it is measured, is not sensitive to cartilage degradation this early on, causing a poor, noise-dominated correlation. qDESS ADC is a parameter that is still under development and both acquisition and postprocessing could be further optimized. In addition, registration of scans with distortion such as DWI-EPI for small areas such as cartilage can be error prone.Conclusion
More research is needed to optimize qDESS ADC to use as a biomarker for early OA detection, but this may not be feasible due to minimal collagen matrix changes at time points this early. While there were differences between injured and control groups in some areas of the cartilage at some time points, the lack of correlation between qDESS ADC and DWI-EPI ADC could indicate that the two sequences are actually measuring different things, and what qDESS ADC represents needs to be fully understood to use it as a diagnostic effectively.Acknowledgements
Research Support from GE
Healthcare, NIH R01-EB002524-14, NIH K24-AR062068-07,
NIH
R01-AR063643-05, Stanford Bio-X
References
1. Bitton, Ryan. "The economic burden of osteoarthritis." The American journal of managed care 15.8 Suppl (2009): S230-5.
2. Sveinsson, Bragi, et al. "SNR‐weighted regularization of ADC estimates from double‐echo in steady‐state (DESS)." Magnetic resonance in medicine 81.1 (2019): 711-718.
3. Bieri, Oliver, Carl Ganter, and Klaus Scheffler. "Quantitative in vivo diffusion imaging of cartilage using double echo steady‐state free precession." Magnetic resonance in medicine 68.3 (2012): 720-729.
4. Raya, José G. "Techniques and applications of in vivo diffusion imaging of articular cartilage." Journal of Magnetic Resonance Imaging 41.6 (2015): 1487-1504.
5. S. Klein, M. Staring, K. Murphy, M.A. Viergever, J.P.W. Pluim, "elastix: a toolbox for intensity based medical image registration," IEEE Transactions on Medical Imaging, vol. 29, no. 1, pp. 196 - 205, January 2010.
6. Monu, Uchechukwuka D., et al. "Cluster analysis of quantitative MRI T2 and T1ρ relaxation times of cartilage identifies differences between healthy and ACL-injured individuals at 3T." Osteoarthritis and cartilage 25.4 (2017): 513-520.
Figures