2732
Functional Gradient Indices for the Early Detection and Prediction of Osteoarthritis: Data from Human Explants and the OAI Database1Mechanical Engineering, University of Colorado Boulder, Boulder, CO, United States, 2Ecology and Evolutionary Biology, University of Colorado Boulder, Boulder, CO, United States, 3Mechanical Engineering, University of Connecticut, Storrs, CT, United States, 4Biomedical Engineering, University of Connecticut, Storrs, CT, United States
Synopsis
Spatial gradients in articular cartilage structure trend toward homogeneity with onset and progression of osteoarthritis (OA). Exploiting MRI, we compared heterogeneous variations in tissue structure, and the corresponding function, to OA severity through the use of spatial first derivatives, herein termed functional gradient indices (FGIs), providing new biomarkers indicating tissue state. We evaluated FGI maps of MRI data visualizing osteochondral human explants and OAI subjects for relationships to OA severity. FGI data correlated significantly with tissue health, while traditional metrics did not. The sensitivity and versatility of FGI analysis suggests a novel biomarker with improved detection of early disease pathogenesis.
Introduction
Tissue heterogeneity has long been considered a surrogate of tissue health. In articular cartilage, the heterogeneity in structure and the corresponding functional response suggest tissue integrity which evolves in the progression of osteoarthritis (OA), the most common degenerative disease [1]. Magnetic resonance imaging (MRI), with the ability to quantitively image cartilage with excellent soft tissue contrast, is a promising modality for early OA detection. However, conventional MRI has limited sensitivity to the subtle structural changes of early-stage OA [2]. Both spatial texture [3] and zonal [4] analysis of quantitative MRI (qMRI) data have promising correlations between image metrics and OA progression, but unfortunately not at the level of the single patient, and at the cost of time and potential user bias. Here, we exploit textural alterations in structural and functional MRI data both ex vivo, with previously characterized osteoarthritic explants [5], and in vivo, with images from the OAI database, to explore the utility of FGIs as a new imaging biomarker for early detection and prediction of OA.Methods
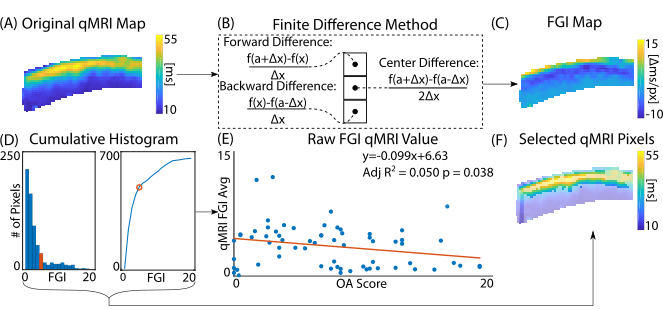
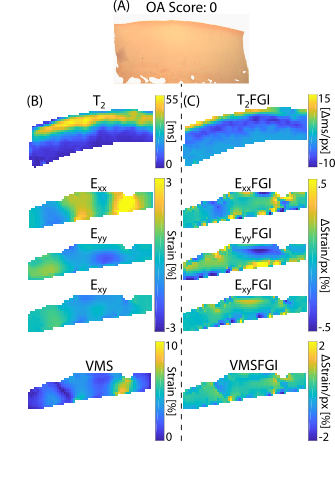
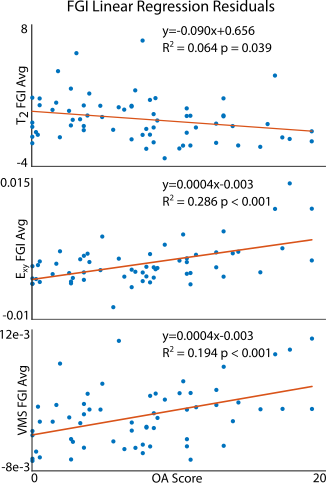
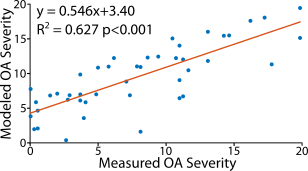
Analyses of human osteochondral explants: We collected high-resolution (14.1T) MRI data on femoral osteochondral explants (n = 61) removed from 16 volunteers receiving total knee replacement surgeries (M/F/Unknown: 8/2/4, age: 68.1±9.6) following IRB approval. We collected RARE (TR/TE: 3000/8.92 ms, FOV: 100×100 μm2, matrix size: 256×256 pixels2, slice thickness: 1 mm, flip angle: 180°, RARE factor: 16) and FISP (TR/TE: 3.7/1.85 ms, NA: 4, flip angle: 25°) imaging sequences for morphology analyses (e.g. sample thickness and surface angle) followed by T2 relaxometry maps (TE: [10, 30, 50, 70, 90] ms, TR: 1000 ms, FOV = 2.56×2.56 cm2). We also calculated transverse, axial, shear, and Von Mises strain fields using a DENSE-FISP imaging sequence [6]. Following MRI acquisition, we assessed explants histologically for OA severity [7]. We evaluated voxel-level, depth-dependent alterations in the qMRI maps perpendicular to the superficial zone via a finite difference scheme resulting in spatial first derivative (i.e. FGI) maps (Figure 1A-C, Figure 2). We then subjected each FGI map to an absolute value cumulative histogram threshold to capture relatively high voxel values (~30% of the pixels), while removing potential human selection bias, and we averaged selected values per FGI (Figure 1D-F).Prediction of histologically-assessed OA severity: We evaluated correlations among FGIs and OA severities via simple linear regressions and assessed model residuals using a mixed-effects model (Figure 3). We also developed a mixed-effects FGI-OA prediction model to compare with the original MRI-OA prediction model [5] (Figure 4) (p<0.05).
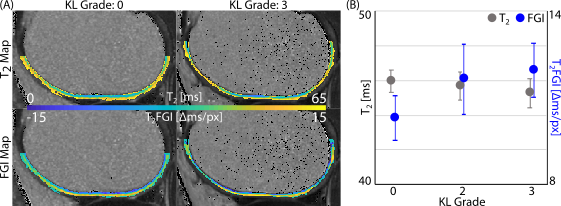
Analysis of subjects from the OAI dataset: We selected four subjects demonstrating radiographic OA onset (change in Kellgren-Lawrence (KL) grade 0 to 3) from the OAI database for in vivo FGI analysis. We constructed and averaged T2 relaxometry maps (3T, TE/TR: 10/2700 ms, FOV: 120×120 mm2, matrix size: 384×384 pixels2) of the medial femoral cartilage [8] (Figure 5). We generated T2 relaxometry maps through the thickness of the tissue (i.e. normal to the deep zone boundary and extending through the superficial zone) using a B-spline interpolation scheme. We calculated FGI values at each pixel location, enabling a direct registration and comparison of FGI and original qMRI data (Figure 5A). We selected FGI pixels via an absolute value cumulative histogramming threshold and averaged per FGI (Figure 5B).
Results
Functional gradient indices resulted in new texture-based, spatial first derivative qMRI maps correlating with OA severity (Figure 2). The correlation between voxel-wise T2 relaxometry and OA score improved greatly with FGI calculation (p=0.038) compared to previous studies (p=0.906 [5]) even when controlling for covariates (Figure 3). All raw dualMRI [5] and FGI dualMRI averages correlated significantly with OA when accounting for covariates. Regressions of predicted OA scores from the mixed-effects FGI-OA model, which capitalized on the spatial variations in tissue structure and function (Figure 4), considerably improved fits in comparison to our previous prediction model (R2=0.482 [5] to R2=0.627). FGI averages of OAI subjects indicated an increase in FGI score with rising Kellgren-Lawrence (KL) grade, which was most apparent in the change in KL grade 0 to 2.Discussion
FGI analyses revealed new relationships between structure-function heterogeneity and integrity in articular cartilage. The improved correlation of ex vivo T2 FGI values over T2 relaxometry with OA severity demonstrates the sensitivity of our FGI method to increasing homogeneity in the superficial zone of diseased tissue. Additionally, the remaining correlation between functional data and OA score demonstrates the versatility of FGI analyses. Improvements in the multiparametric prediction of OA severity illustrate the power of FGIs as a possible noninvasive imaging diagnostic for single patients. Interestingly, OAI analyses of subjects suggests an increasing gradient with increased KL grade. The in vivo relationship was inverse of that observed for ex vivo data, which was likely due to differences in the spatial resolution resulting in a loss of distinct in vivo data pixels representing the superficial zone alone. The use of FGI analysis may be of interest to the noninvasive imaging community due to its improved qMRI correlation with OA severity, providing unique insights into in vivo imaging analyses, and novel biomarkers for disease diagnosis and treatment.Acknowledgements
This work was supported, in part, by NIH R01 AR063712 and R21 AR066665, and NSF CAREER 134735.References
[1] J. A. Buckwalter and J. A. Martin, “Osteoarthritis,” Adv. Drug Deliv. Rev., vol. 58, no. 2, pp. 150–167, May 2006.
[2] R. R. Regatte, S. V. S. Akella, A. Borthakur, J. B. Kneeland, and R. Reddy, “Proteoglycan depletion-induced changes in transverse relaxation maps of cartilage: comparison of T2 and T1rho.,” Acad. Radiol., vol. 9, no. 12, pp. 1388–94, Dec. 2002.
[3] K. L. Urish, M. G. Keffalas, J. R. Durkin, D. J. Miller, C. R. Chu, and T. J. Mosher, “T2 texture index of cartilage can predict early symptomatic OA progression: Data from the osteoarthritis initiative,” Osteoarthr. Cartil., 2013.
[4] W. Wirth, S. Maschek, F. W. Roemer, and F. Eckstein, “Layer-specific femorotibial cartilage T2 relaxation time in knees with and without early knee osteoarthritis: Data from the Osteoarthritis Initiative (OAI),” Nat. Publ. Gr., 2016.
[5] A. J. Griebel, S. B. Trippel, N. C. Emery, and C. P. Neu, “Noninvasive assessment of osteoarthritis severity in human explants by multicontrast MRI.,” Magn. Reson. Med., vol. 71, no. 2, pp. 807–14, Feb. 2014.
[6] D. D. Chan and C. P. Neu, “Transient and Microscale Deformations and Strains Measured under Exogenous Loading by Noninvasive Magnetic Resonance,” PLoS One, vol. 7, no. 3, p. e33463, Mar. 2012.
[7] K. P. H. Pritzker et al., “Osteoarthritis cartilage histopathology: grading and staging,” Osteoarthr. Cartil., vol. 14, no. 1, pp. 13–29, Jan. 2006.
[8] E. Schneider and M. Nessaiver, “The Osteoarthritis Initiative (OAI) magnetic resonance imaging quality assurance update.,” Osteoarthr. Cartil., vol. 21, no. 1, pp. 110–6, Jan. 2013.
Figures