2731
Detecting Early Changes in ACL-Reconstructed Knee Cartilage Using Diffusion-Weighted MRI1Stanford University, Stanford, CA, United States, 2Radiology, Stanford University, Stanford, CA, United States, 3Mechanical Engineering, Stanford University, Stanford, CA, United States, 4Electrical Engineering, Stanford University, Stanford, CA, United States, 5Bioengineering, Stanford University, Stanford, CA, United States, 6Orthopedic Surgery, Stanford University, Stanford, CA, United States
Synopsis
ACL-injured individuals, despite reconstructive surgery, have an increased risk of developing osteoarthritis and methods to identify early changes in cartilage are needed to allow implementation of treatment. Diffusion-weighted MRI (DWI) has been shown to provide information on femoral cartilage health. This study aims to assess the potential of DWI to detect early degenerative changes in articular cartilage following ACL reconstruction. We found that DWI shows elevated ADC values in both ACL-injured and contralateral knees compared with controls at baseline. DWI did not show significant changes in cartilage over time within 18 months of post-ACL-reconstructive surgery.
Introduction
Anterior cruciate ligament (ACL) tears have been shown to significantly increase the risk of developing osteoarthritis, even if the individual has reconstructive surgery1,2. During the early stages of this osteoarthritis development, the composition and microstructure of articular cartilage (primarily water, proteoglycan, and collagen) is altered3. Since apparent diffusion coefficient (ADC) values in cartilage have been shown to correlate with proteoglycan content4, analyzing diffusion-weighted MRI (DWI)-measured ADC values may help provide information on femoral cartilage health. The objective of this study was to determine if regional and local changes in ADC values could be detected using echo-planar-imaging-based DWI (DWI-EPI) over 18 months post-ACL-reconstructive surgery.Methods
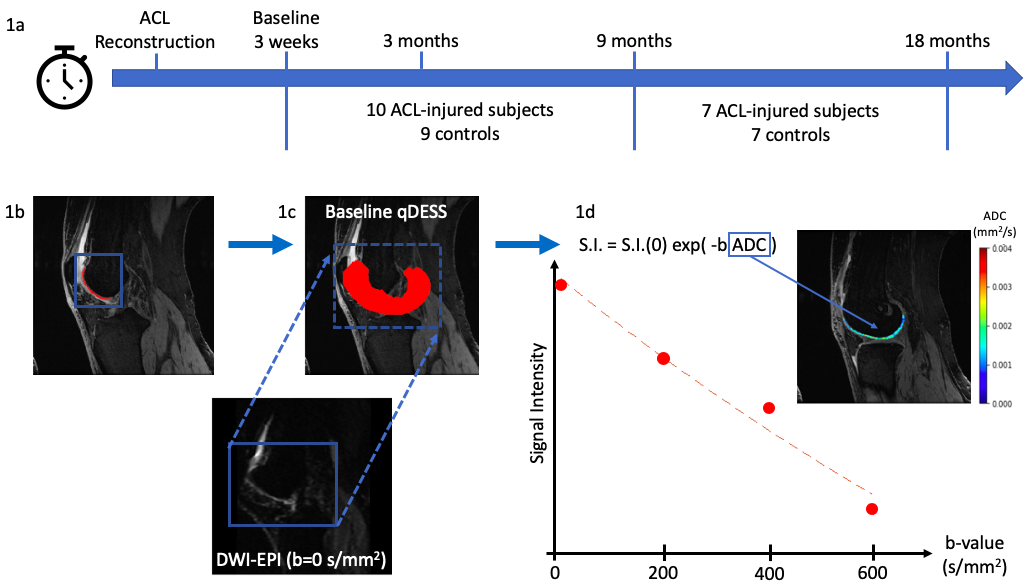
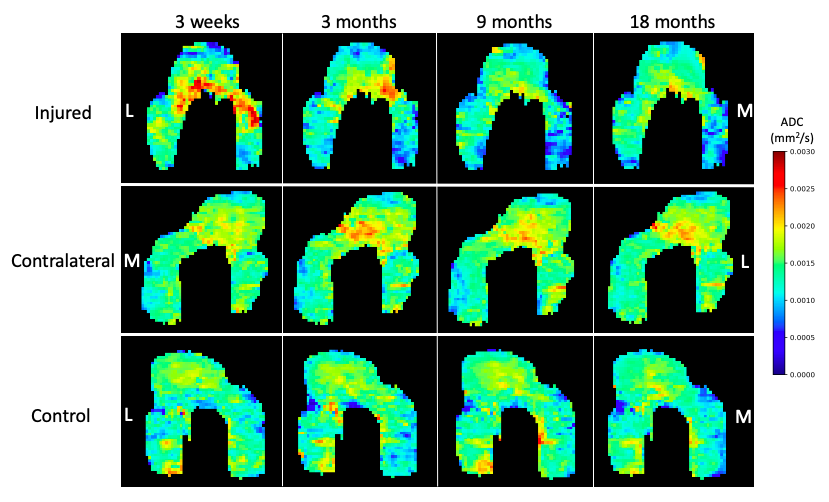
This study included 19 subjects: 10 ACL-injured patients that had undergone ACL-reconstructive surgery (5 women, 5 men, age: 39 ± 12 years, BMI: 23 ± 1.5) and 9 sex, age, and BMI matched controls (5 women, 4 men, age: 39 ± 13 years, BMI: 24 ± 1.4 ). The injured and contralateral knees of each patient and right knee of controls were scanned on a 3T MRI scanner using two methods: 2 quantitative double-echo in steady state (DESS) sequences and a DWI-EPI with 4 b-values (0, 200, 400, 600 s/mm2). Scans were taken at 4 time points post-ACL-reconstructive surgery: 3-weeks (baseline), 3 months, 9 months, and 18 months (Fig. 1a).Femoral cartilage was manually segmented in the sagittal plane on DESS images (Fig. 1b). Each subject’s b=0 s/mm2 DWI-EPI image was non-rigidly registered to the baseline DESS image with Elastix5 (Fig. 1c). The registration used two transforms: affine or rigid followed by b-spline. This registration was applied to the other b-values using Transformix5. ADC values were calculated within each cartilage segmentation by fitting signal intensity at each b-value to the Stejskal-Tanner equation6 using an exponential fitting function (Fig. 1d). ADC values greater than expected for articular cartilage (0.003 mm2/s) were excluded. Projection maps of ADC values were then created (Fig. 2) for the purpose of visualization and further calculations by fitting a cylinder to the segmentation and projecting the values into angular bins on a 2D plane7.
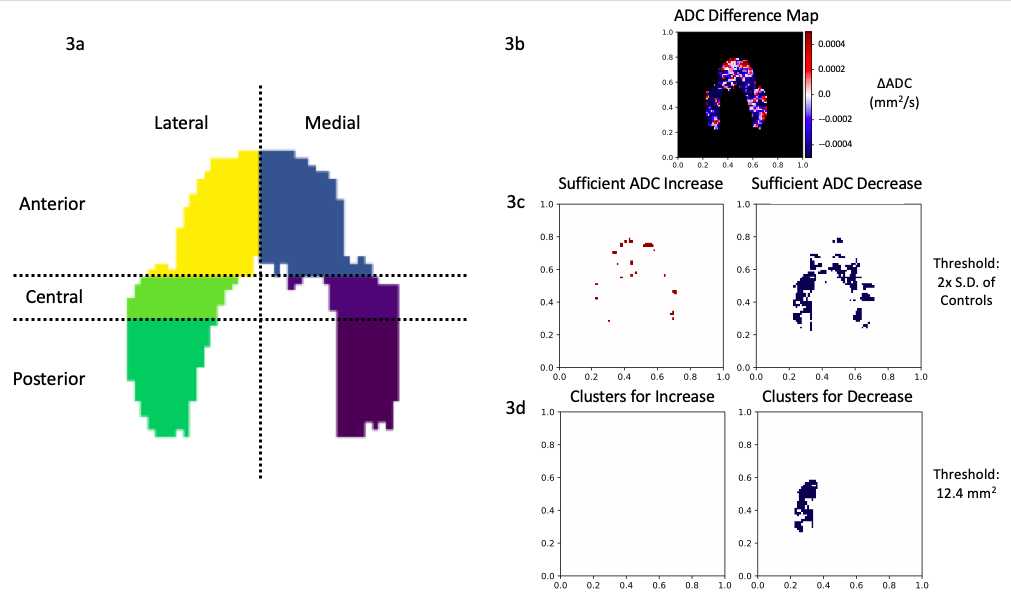
To conduct regional analyses, these projection maps were divided into 6 anatomical regions: anterior, central, and posterior on the medial and lateral sides (Fig. 3a). Mean ADC values of each section were calculated and corresponding regions of injured, contralateral, and control knees were compared using one-way ANOVA (p<0.05) followed by Tukey’s test.
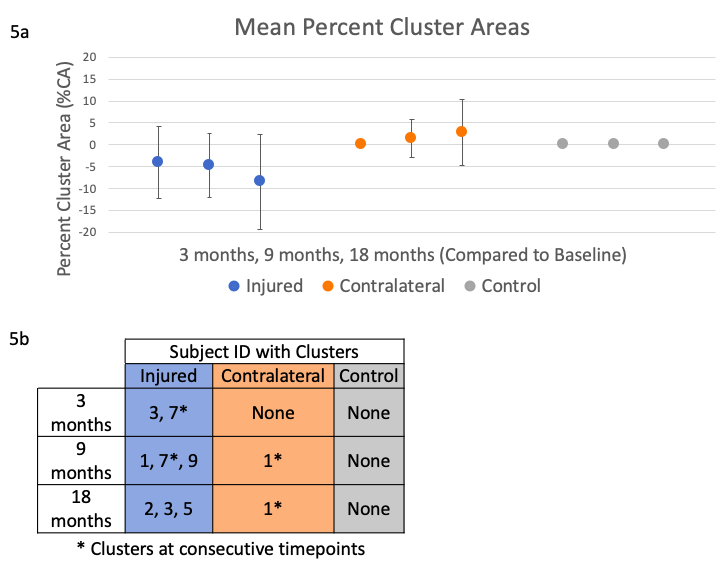
To find local changes in ADC values, a cluster analysis of difference maps was used7. ADC difference maps were created by subtracting the baseline projection map from maps at subsequent time points (Fig. 3b). Clusters were defined as a contiguous set of pixels with an area greater than 12.4 mm2 (Fig. 3c) and values greater than twice the standard deviation of control difference maps7 (Fig. 3d). Percent cluster area (%CA) was calculated as the percentage of the difference maps covered by clusters, and outcomes were reported as %CA for both positive (%CA+) and negative (%CA-) differences.
Results
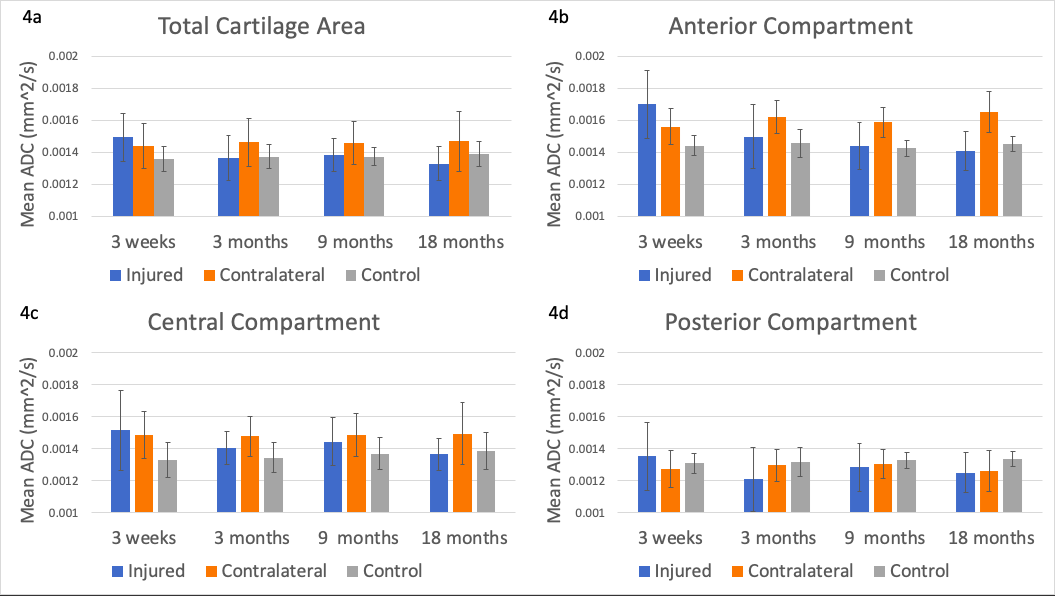
At baseline, ADC values over the total cartilage area were significantly higher in ACL-injured and contralateral knees than in controls (p<0.001 and p=0.0072, respectively) (Fig. 4a). ADC values in the anterior compartment of injured knees at baseline were significantly higher than at all other timepoints (p<0.001) (Fig. 4b).At 3, 9, and 18 months post-surgery, ADC values in injured knees did not vary significantly from controls (p=0.81, p=0.68, and p=0.055, respectively) but were significantly lower than in contralateral knees (p<0.05) (Fig. 4a-d). ADC values in contralateral knees were significantly higher than controls at 3 and 9 months post-surgery (p<0.01), but there was no significant difference between contralateral and control knees at 18 months post-surgery (p=0.052). No significant change in total cartilage area ADC values over 18 months occurred in injured, contralateral, or control knees (Fig. 4a).
Clusters were found in injured (6 knees, %CA- only) and contralateral (1 knee, %CA+ only) knees, but not in control knees (Fig. 5a). Clusters occurred at varying timepoints, with 1 injured and 1 contralateral knee having clusters at consecutive timepoints (Fig. 5b). All clusters were primarily located in the anterior compartment, on both the medial and lateral sides.
Discussion
Elevated ADC values in ACL-reconstructed compared to control knees at baseline indicates that changes in cartilage may occur in the reconstructed knee post-surgery. Interestingly, we found no significant difference between injured and control knees after baseline. Elevated ADC values in contralateral compared to both injured and control knees after baseline may indicate that the injury and recovery has an effect on the contralateral knee.We hypothesized that ADC values would increase over time if cartilage microstructural change was occurring. However, we only identified %CA- for injured knees, likely because clusters were primarily located in the anterior compartment, where injured knee ADC values at baseline were significantly higher than subsequent timepoints. Due to the cluster irregularity across consecutive timepoints, cluster analysis did not indicate local changes in ADC values.
Conclusion
While DWI-EPI showed elevated ADC values in both ACL-injured and contralateral knees compared with controls at baseline, it did not detect significant cartilage change over time in our subjects, within 18 months post-ACL-reconstructive surgery.Acknowledgements
NIH R01 AR0063643, NIH R01 EB002524, NIH K24 AR062068, GE HealthcareReferences
1. Simon D, Mascarenhas R, Saltzman BM, et al. “The Relationship between Anterior Cruciate Ligament Injury and Osteoarthritis of the Knee”, Advances in Orthopedics, 2015, vol. 2015, Article ID 928301, 11 pages.
2. Meuffels DE, Favejee MM, Vissers MM, et al. “Ten year follow-up study comparing conservative versus operative treatment of anterior cruciate ligament ruptures. A matched-pair analysis of high level athletes”, British Journal of Sports Medicine, 2009, 43, pp. 347-351.
3. Raya, JG. “Techniques and Applications of in vivo Diffusion Imaging of Articular Cartilage”, Journal of Magnetic Resonance Imaging, 2015, vol. 41, no. 6, pp. 1487-1504.
4. Raya JG, Melkus G, Adam-Neumair S, et al. “Change of Diffusion Tensor Imaging Parameters in Articular Cartilage With Progressive Proteoglycan Extraction”, Investigative Radiology, 2011, vol. 46, no. 6, pp. 401-409.
5. Klein S, Staring M, Murphy K, et al. "elastix: a toolbox for intensity based medical image registration," IEEE Transactions on Medical Imaging, 2010, vol. 29, no. 1, pp. 196-205.
6. Stejskal EO and Tanner JE. “Spin Diffusion Measurements: Spin Echoes in the Presence of a Time Dependent Field Gradient”, Journal of Chemical Physics, 1965, vol. 42, no. 1, pp. 288-292.
7. Monu UD, Jordan CD, Samuelson BL, et al. “Cluster analysis of quantitative MRI T2 and T1ρ relaxation times of cartilage identifies differences between healthy and ACL-injured individuals at 3T”, Osteoarthritis and Cartilage, 2017, vol. 25, issue 4, pp. 513-520.
Figures