2730
Scan-Rescan Variability and Left-Right Knee Asymmetry of Cartilage Morphometry Assessed with Rapid MRI in a Harmonized Multi-Vendor Study1Stanford University, Stanford, CA, United States, 2Philips, San Francisco, CA, United States, 3Paracelsus Medical University, Salzburg, Austria, 4Chondrometrics GmbH, Ainring, Germany
Synopsis
Changes in cartilage morphology have shown to predict and monitor osteoarthritis progression with great sensitivity. However, the lack of a rapid and inexpensive MRI technique for imaging cartilage that can be implemented across vendors is a challenge in large multi-site clinical studies. In this work, we evaluate multi-vendor and scan-rescan reliability and explore left-right knee asymmetries of cartilage morphology measured using a rapid, 4-minute quantitative double-echo steady-state (qDESS) sequence. We demonstrate qDESS harmonization across vendors, which can produce high scan-rescan repeatability and high repeatability of left-right knee asymmetry of cartilage volume, surface area, and thickness metrics.
Introduction
Cartilage loss is a primary hallmark of osteoarthritis, and changes in cartilage morphometric parameters have been shown to be predictive and sensitive to osteoarthritis progression1,2. Large studies such as the Osteoarthritis Initiative extensively studied cartilage morphology, however, the high-resolution double-echo steady-state (DESS) acquisition required 11 minutes of scan time per knee and was only performed on MRI scanners from a single vendor3. Future studies and clinical trials for disease modifying drugs will benefit from rapid sequences for morphometric analysis that can be harmonized across MRI vendors4. The quantitative DESS (qDESS) sequence is an ideal candidate for this as it has previously been validated for accurate cartilage morphometry and T2 relaxometry5,6. Towards this end, we evaluate multi-vendor and scan-rescan reliability and explore left-right knee asymmetries of cartilage morphology measured using qDESS.Methods
Both knees of 5 healthy subjects were imaged with a 4-minute qDESS sequence separately, resulting in 10 MRI acquisitions. After the first scan per knee, the subject was taken outside the scanner and the coil was repositioned for the second scan to evaluate sequence test-retest precision. This process was repeated on the same day to scan volunteers on MRI scanners from two different vendors - a 3T Signa Premier (GE Healthcare, Waukesha, Wisconsin) with an 18 channel transmit/receive coil and a 3T Philips Ingenia (Philips, Netherlands) with a 16 channel transmit/receive coil. Care was taken to ensure minimal physical activity at the day of the imaging and the day prior. qDESS resolution, flip angle, readout bandwidth, and spoiler areas were set equally on both scanners, and minimal dead time was added to match the repetition and echo times. The imaging parameters, example images, and overall study schematic are shown in Figure 1.Cartilage morphometric analysis of the femorotibial cartilage plate was performed by Chondrometrics GmbH (Ainring, Germany) using customized software and manual segmentations by experienced readers, with quality control being applied before and after cartilage segmentation7. The joint surface area was segmented into four cartilage plates: medial tibia, lateral tibia, central (weight-bearing) medial femoral condyle, and central lateral femoral condyle. The segmented regions were used to calculate the cartilage volume (in mm3), surface area (in cm2), and mean cartilage thickness over the total area of the subchondral bone (in mm)8.
Scan-rescan variability, inter-vendor variability, and left-right knee asymmetry in the three cartilage morphology metrics (volume, surface area, and thickness) were evaluated. Concordance coefficient correlations (CCC) and Pearson correlation coefficients (PCC) were used to quantify the variability. A root-mean-square error coefficient of variation percentage (RMSE-CV%) was evaluated to compare the variation with previously established results. Non-parametric Wilcoxon-signed rank tests were used to assess scan-rescan and inter-vendor systematic offsets (α=0.05).
Results
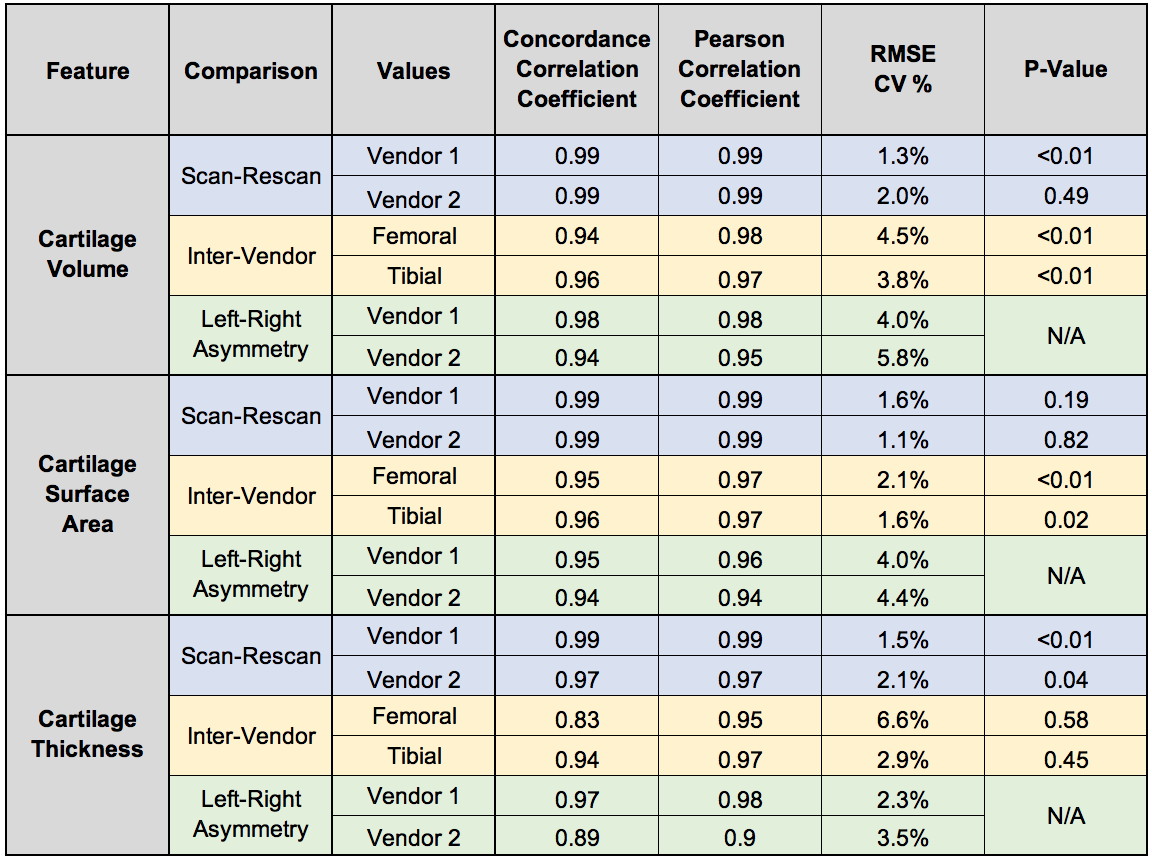
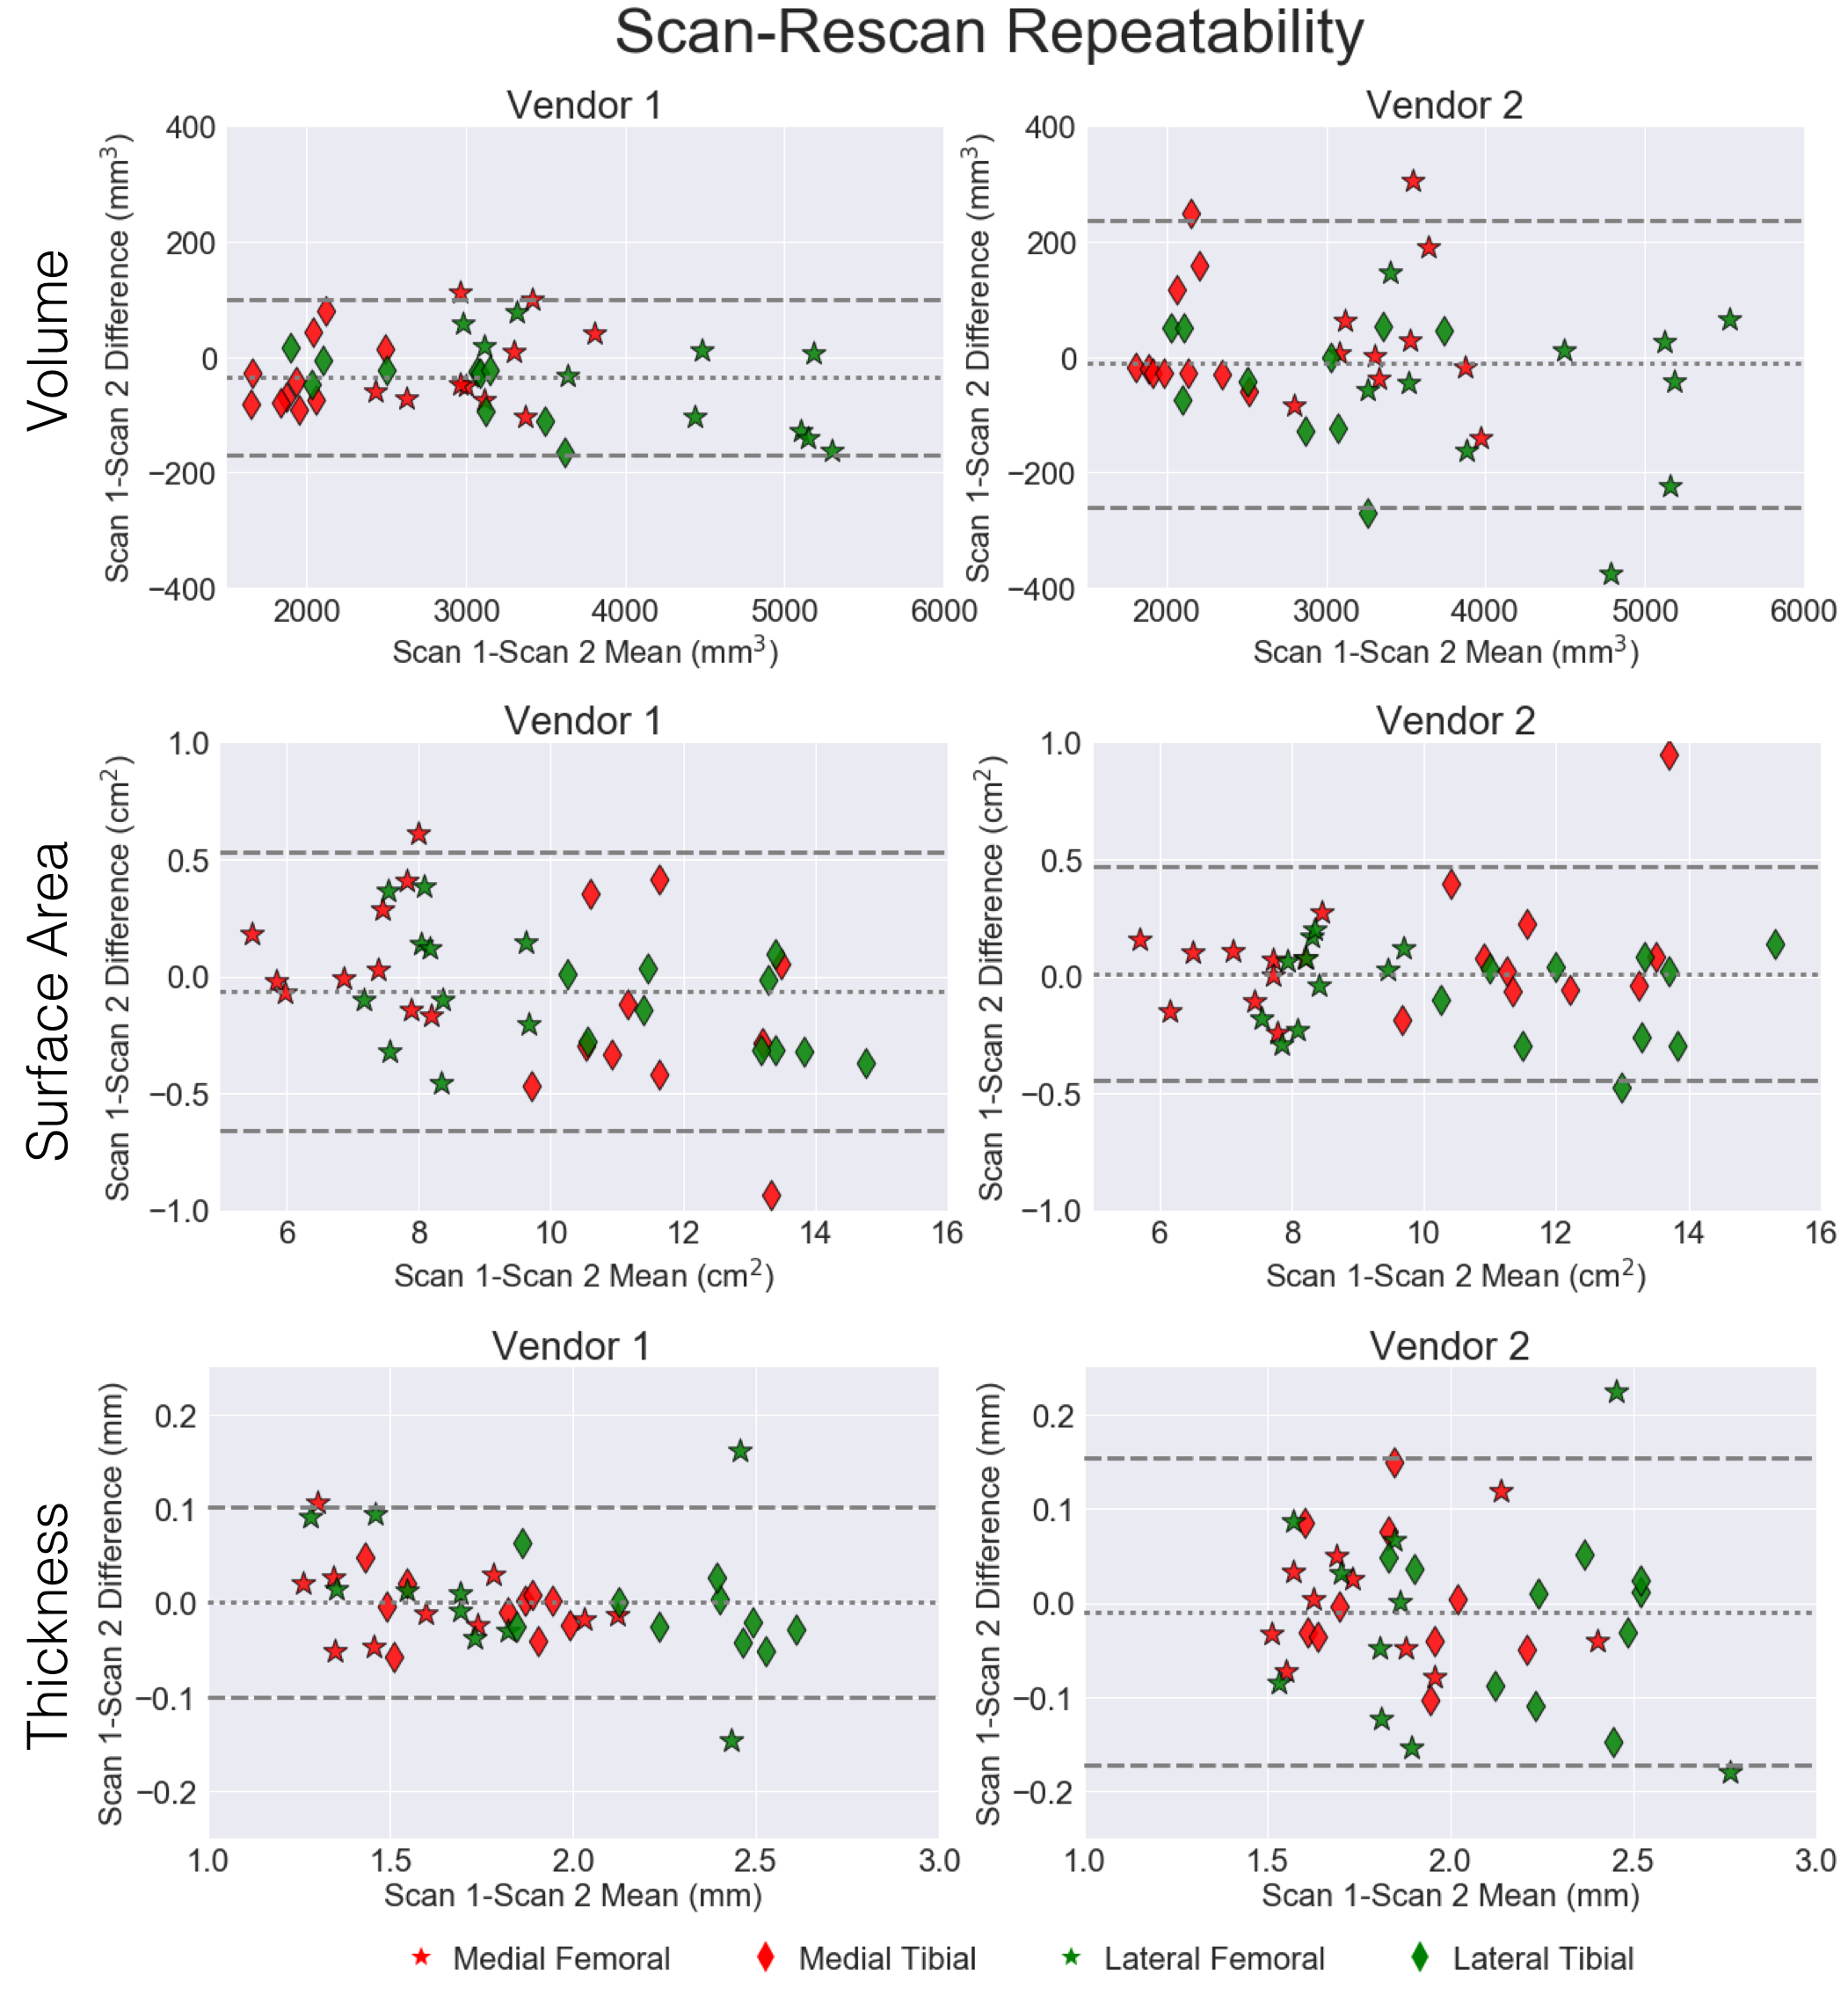
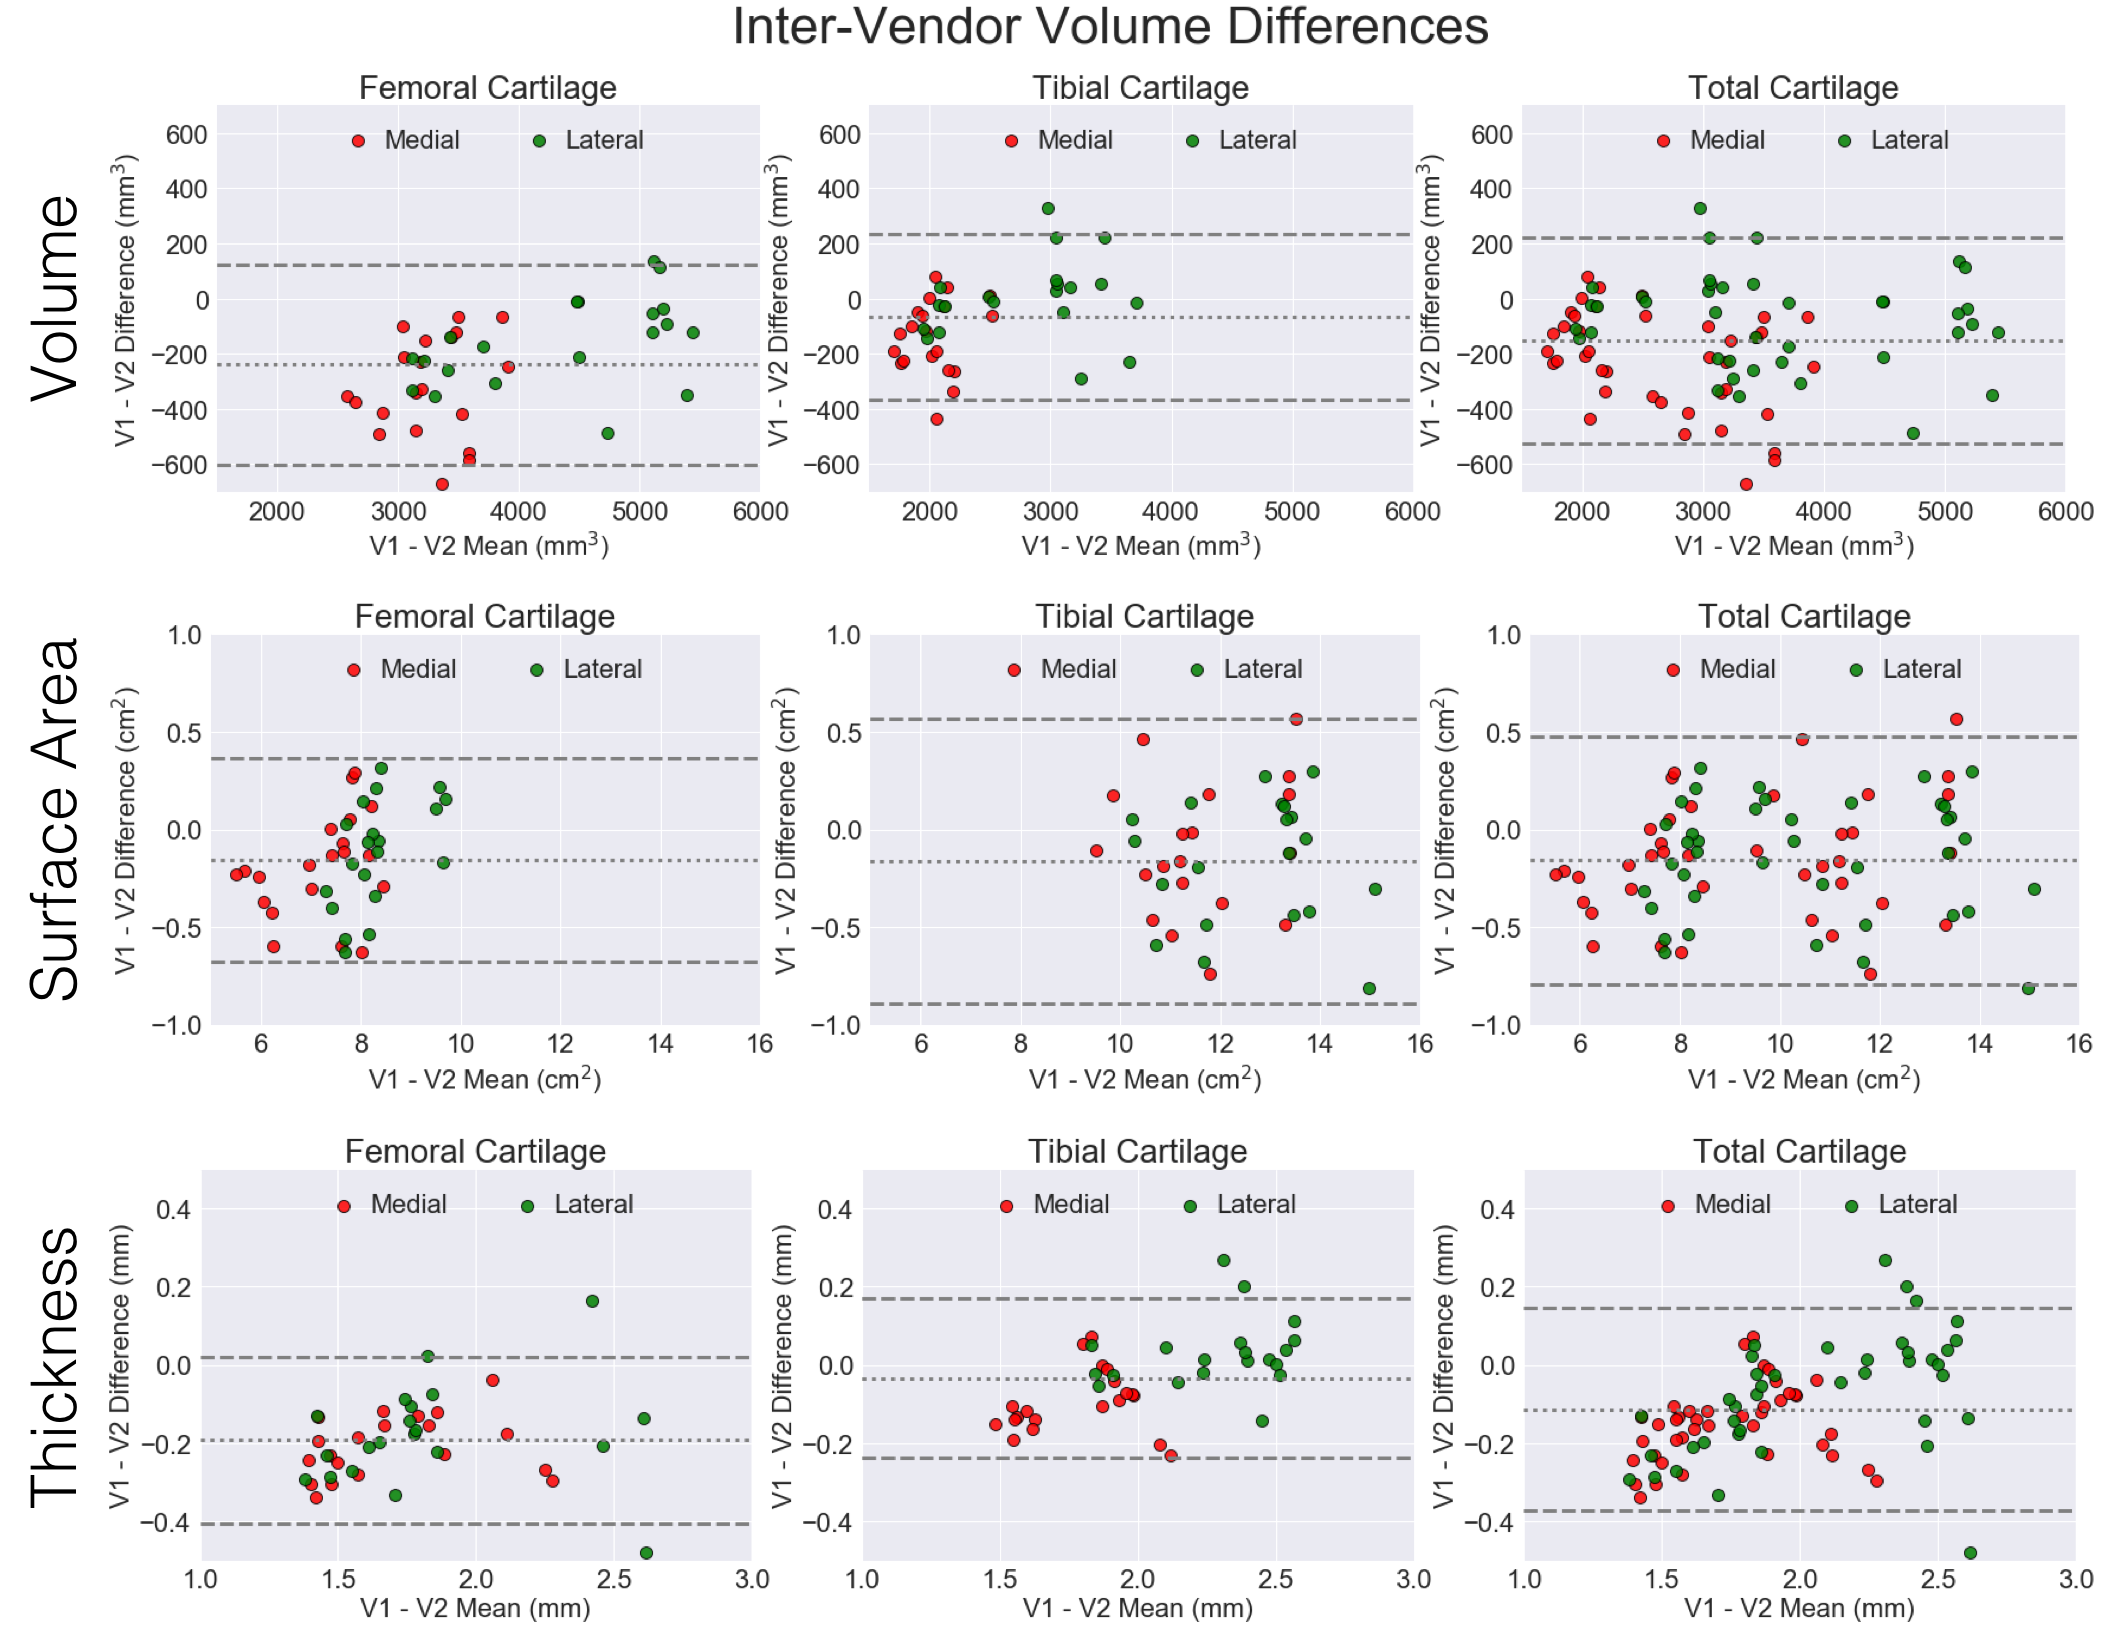
Variability metrics for cartilage morphology across repeated scans, vendors, and knees are provided in Figure 2. Scan-rescan repeatability was high for all metrics with a maximum RMSE-CV of 2.1%. For inter-vendor repeatability, cartilage surface area had the least variation amongst all three metrics (RMSE-CV of 2.1%), while femoral condyle cartilage thickness had the most variation (RMSE-CV of 6.6%). Bland-Altman plots for cartilage volume, surface area, and thickness depicting scan-rescan (Figure 3) and inter-vendor (Figure 4) showed excellent repeatability of all metrics.Asymmetry between the left and right knees (Figure 5) was lowest for cartilage thickness and highest for cartilage volume. Surface area left-right knee asymmetry was the most repeatable metric across the two scanners (CCC=0.86, PCC=0.87, p-value=0.69), followed by volume (CCC=0.73, PCC=0.82, p-value=0.70), and thickness (CCC=0.42, PCC=0.48, p-value=0.79).
Discussion
In this study, we demonstrated the utility of a rapid qDESS pulse sequence implemented across different MRI vendors with harmonized sequence parameters to evaluate knee articular cartilage morphology. Both vendors exhibited high scan-rescan repeatability of the volume, surface area, and thickness findings, which was comparable or better than previous studies9,10. Inter-vendor repeatability of the metrics was slightly lower, especially for femoral cartilage thickness (CCC=0.83 and CV%=6.6%), however, the Pearson coefficient was still high (PCC=0.95) suggesting that there may be systematic differences that could be accounted for retrospectively. Even for the metrics that were significantly different, the RMSE-CV was low, which suggests systematic but minimal biases. Cartilage thickness may have lower repeatability due to partial volume effects of 3mm thick slices. In future studies, thinner slices could be acquired with parallel imaging without increasing scan time.No considerable left-right asymmetry in cartilage metrics was expected amongst this cohort (all healthy volunteers). There were no statistically significant variations between vendors for left-right asymmetry suggesting that the asymmetry is consistently depicted across both scanners. Future studies could implement simultaneous bilateral knee MRI to further study left/right asymmetries without increasing MRI scan time11. In addition to the cartilage thickness data analyzed in this study, future studies could also analyze quantitative T2 relaxation times that qDESS can automatically generate12.
Conclusion
We demonstrated a rapid pulse sequence that can be implemented across different MRI vendors with harmonized parameters for cartilage morphometric analysis. This acquisition and analysis demonstrated high scan-rescan repeatability for both vendors, moderate inter-vendor repeatability, and high consistency of left-right knee asymmetry across the vendors.Acknowledgements
We would like to acknowledge our funding sources: National Institutes of Health (NIH) grant numbers NIH R01 AR063643, R01 EB002524, K24 AR062068, and P41 EB015891. GE Healthcare, Philips, and Stanford Medicine Precision Health and Integrated Diagnostics.References
1. Eckstein, F. et al. Quantitative MRI measures of cartilage predict knee replacement: A case-control study from the Osteoarthritis Initiative. Ann. Rheum. Dis. 72, 707–714 (2013).
2. Wirth, W. et al. Predictive and concurrent validity of cartilage thickness change as a marker of knee osteoarthritis progression: data from the Osteoarthritis Initiative. Osteoarthr. Cartil. 25, 2063–2071 (2017).
3. Peterfy, C. G., Schneider, E. & Nevitt, M. The osteoarthritis initiative: report on the design rationale for the magnetic resonance imaging protocol for the knee. Osteoarthr. Cartil. 16, 1433–1441 (2008).
4. Hochberg, M. C. et al. Effect of Intra-Articular Sprifermin vs Placebo on Femorotibial Joint Cartilage Thickness in Patients With Osteoarthritis. Jama 322, 1360 (2019).
5. Chaudhari, A. S. et al. Five-minute knee MRI for simultaneous morphometry and T 2 relaxometry of cartilage and meniscus and for semiquantitative radiological assessment using double-echo in steady-state at 3T. J. Magn. Reson. Imaging 47, 1328–1341 (2018).
6. Welsch, G. H. et al. Rapid estimation of cartilage T2 based on double echo at steady state (DESS) with 3 Tesla. Magn. Reson. Med. 62, 544–9 (2009).
7. Eckstein, F. et al. Double echo steady state magnetic resonance imaging of knee articular cartilage at 3 Tesla: a pilot study for the Osteoarthritis Initiative. Ann. Rheum. Dis. 65, 433–41 (2006).
8. Eckstein, F. et al. Proposal for a nomenclature for Magnetic Resonance Imaging based measures of articular cartilage in osteoarthritis. Osteoarthr. Cartil. 14, 974–983 (2006).
9. Mosher, T. J. et al. Knee articular cartilage damage in osteoarthritis: analysis of MR image biomarker reproducibility in ACRIN-PA 4001 multicenter trial. Radiology 258, 832–42 (2011).
10. Eckstein, F., Kwoh, C. K. & Link, T. M. Imaging research results from the Osteoarthritis Initiative (OAI): a review and lessons learned 10 years after start of enrolment. Ann. Rheum. Dis. 2006, 1289–1300 (2014).
11. Kogan, F. et al. Simultaneous bilateral-knee MR imaging. Magn. Reson. Med. 80, 529–537 (2018).
12. Sveinsson, B., Chaudhari, A., Gold, G. & Hargreaves, B. A simple analytic method for estimating T2 in the knee from DESS. Magn. Reson. Imaging 38, 63–70 (2017).
Figures