2729
Robust Statistics for T1ρ-Mapping of Knee Cartilage on Mono- and Bi-Exponential Models: Optimal Spin-Lock Times and Fitting Methods1Radiology, NYU, New York, NY, United States
Synopsis
T1ρ-mapping using mono- or bi-exponential models usually require multiple spin-lock times (#TSLs). Choosing the optimal #TSLs for improved SNR, i.e. minimizing the Cramer-Rao lower bound (CRLB), is important. However, Gaussian statistics with CRLB usually lead to the repetition of longer TSLs and the minimum number of shorter TSLs. This choice is non-robust to large data acquisition errors caused by subject motion or other scan related problems that strongly affect quantitative parameters. To alleviate this problem, we propose a robust T1ρ-protocol based on optimized #TSLs using CRLB with robust statistics, and outlier-robust fitting method.
Introduction:
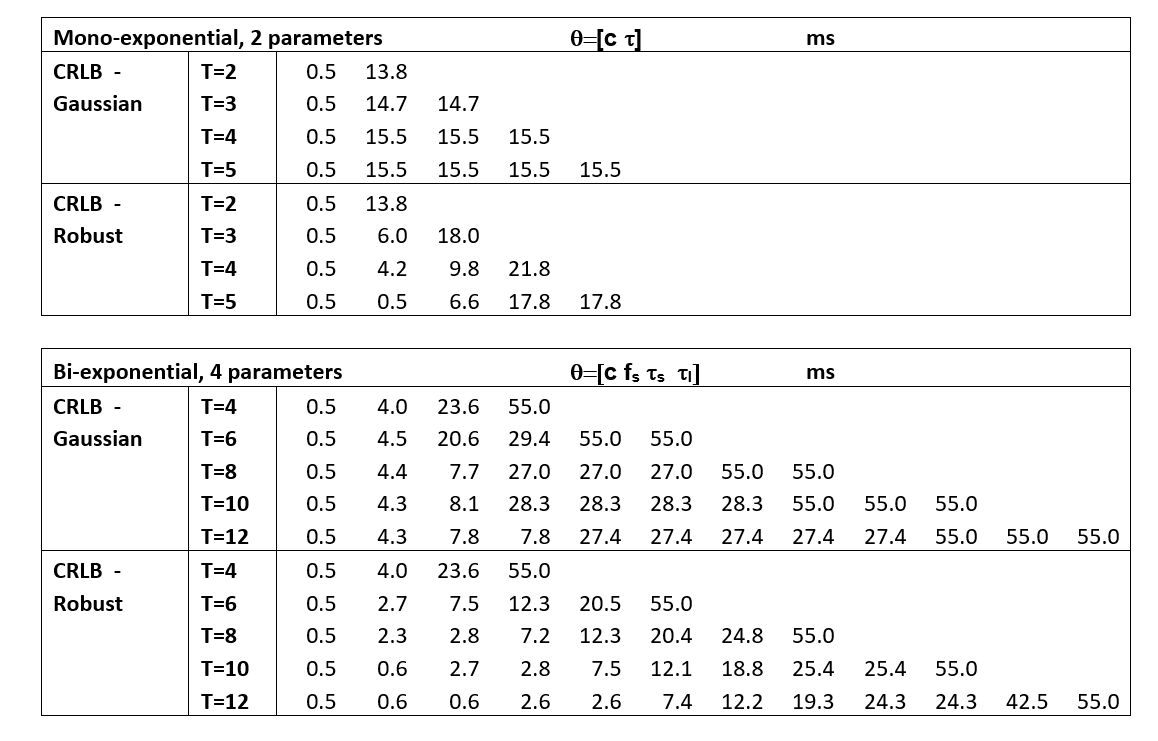
T1ρ-mapping of knee cartilage can provide useful information related to macromolecules such as proteoglycan and collagen [1], and it has been shown to provide greater ability to discriminate osteoarthritis patients from controls [2]. Also, bi-exponential [3] models can provide more information related to the cartilage degeneration, but several T1ρ-weighed images with different spin-lock times (#TSLs) are required to estimate the increased number of free parameters [4], usually using non-linear least squares (NL-LS). Finding the optimal distribution of #TSLs to maximize SNR and increase the precision of the estimated T1ρ parameters for knee cartilage is of utmost importance [5]. Typically, finding the combination that minimizes the Cramer-Rao lower bound (CRLB) can solve this problem, making the best use of the #TSLs for a given model.However, when Gaussian statistics is used in CRLB [6] for the optimization of #TSLs, it usually leads to a minimum number of shorter TSLs and a repetition of longer TSLs (Table 1). This approach is risky, considering that the in-vivo acquisition is subjected to large errors caused by motion or other acquisition-related problems that may affect estimated T1ρ-parameters. In order to make the T1ρ-mapping more robust to these errors, we use robust statistics [7] with CRLB, and an outlier-robust curve-fitting using non-linear least absolute deviation (NL-LAD) [8] to have both: good SNR and robustness to large errors.
Methods:
We considered the following exponential models for T1ρ-relaxation. For mono-exponential relaxation model, we used:$$x(t,n)=c(n) exp\left(\frac{-t}{\tau(n)} \right),$$
where $$$x(t,n)$$$ correspond to the complex-valued voxel at time point $$$t$$$ and spatial position $$$n$$$ described by the exponential with complex-valued coefficient $$$c(n)$$$ with positive real-valued relaxation time $$$\tau(n)$$$.
For bi-exponential model, we used:
$$x(t,n)=c(n) \left( f_s(n)\ exp\left(\frac{-t}{τ_s(n)} \right)+(1-f_s(n))exp\left(\frac{-t}{τ_l(n)}\right) \right),$$
where $$$f_s(n)$$$ and $$$f_l(n)=1- f_s(n)$$$ are fractions of the short and long components, $$$0≤f_s(n),f_l(n)≤1$$$, while $$$τ_s(n)$$$ and $$$τ_l(n)$$$ are T1ρ relaxation times of short and long exponential functions.
We are interested in finding the best #TSLs for improved precision. In order to do this, we make use of the Fisher information matrix (FIM) is given by:
$$\bf I(\mathbf{t},\bf \theta)=E\left[\left(\frac{\partial \log \rho(\mathbf{t},\theta)}{\partial \theta} \right)\left( \frac{\partial \log \rho(\mathbf{t},\theta)}{\partial \theta} \right)^T|\mathbf{t},\theta \right],$$
where the #TSLs are in the vector $$$\mathbf{t}$$$, of size $$$T \times 1$$$, and $$$\theta$$$ is a vector with the parameters of the exponential model. We used $$$\rho(\mathbf{t},\theta)$$$ as Gaussian or a robust probability density functions (PDF) [6]. The Cramer-Rao matrix (CRM) is obtained by:
$$\bf V(\mathbf{t},\theta)=\bf I^{−1}(\mathbf{t},\theta).$$
The CRLB is minimized by finding $$$ \mathbf{t}$$$ that produces the smallest diagonal elements of the CRM. The optimization is done using minimax, with range of values: $$$0.5ms≤t≤55ms$$$; mono-exponential:$$$12ms≤\tau≤70ms$$$, and bi-exponential:$$$2ms≤τ_s≤12ms$$$, $$$30ms≤τ_l≤80ms$$$, and $$$0.2≤f_s(n)≤0.8$$$, corresponding to the range on the knee cartilage [9].
The FIM for Gaussian statistics is straightforwardly computed, as reported in [6]. The robust version is approximately computed by composing several sub-FIM matrices, using fewer #TSLs. The size of $$$\mathbf{t}$$$ in these sub-matrices is smaller than $$$T$$$ and larger than the number of parameters $$$\theta$$$. The CRM of each sub-FIM is computed separately. The final CRLB is the mean of the CRLB of each sub-CRM. This robust approach finds #TSLs that are better distributed over time than the Gaussian assumption does, but only when the number of #TSLs is larger than the number of parameters. The resulting #TSLs for mono- and bi-exponential models are presented in Table 1.
The validation of the results was done using Monte Carlo simulations (MCS). Exponential curves within the aforementioned range of expected T1ρ values were synthetically generated. For robustness evaluation, one outlier was added in a randomly chosen position. The outlier, in this experiment, is a noisy element with SNR=0.5. The other elements received Gaussian noise with smaller standard deviation computed to obtain SNR=25.
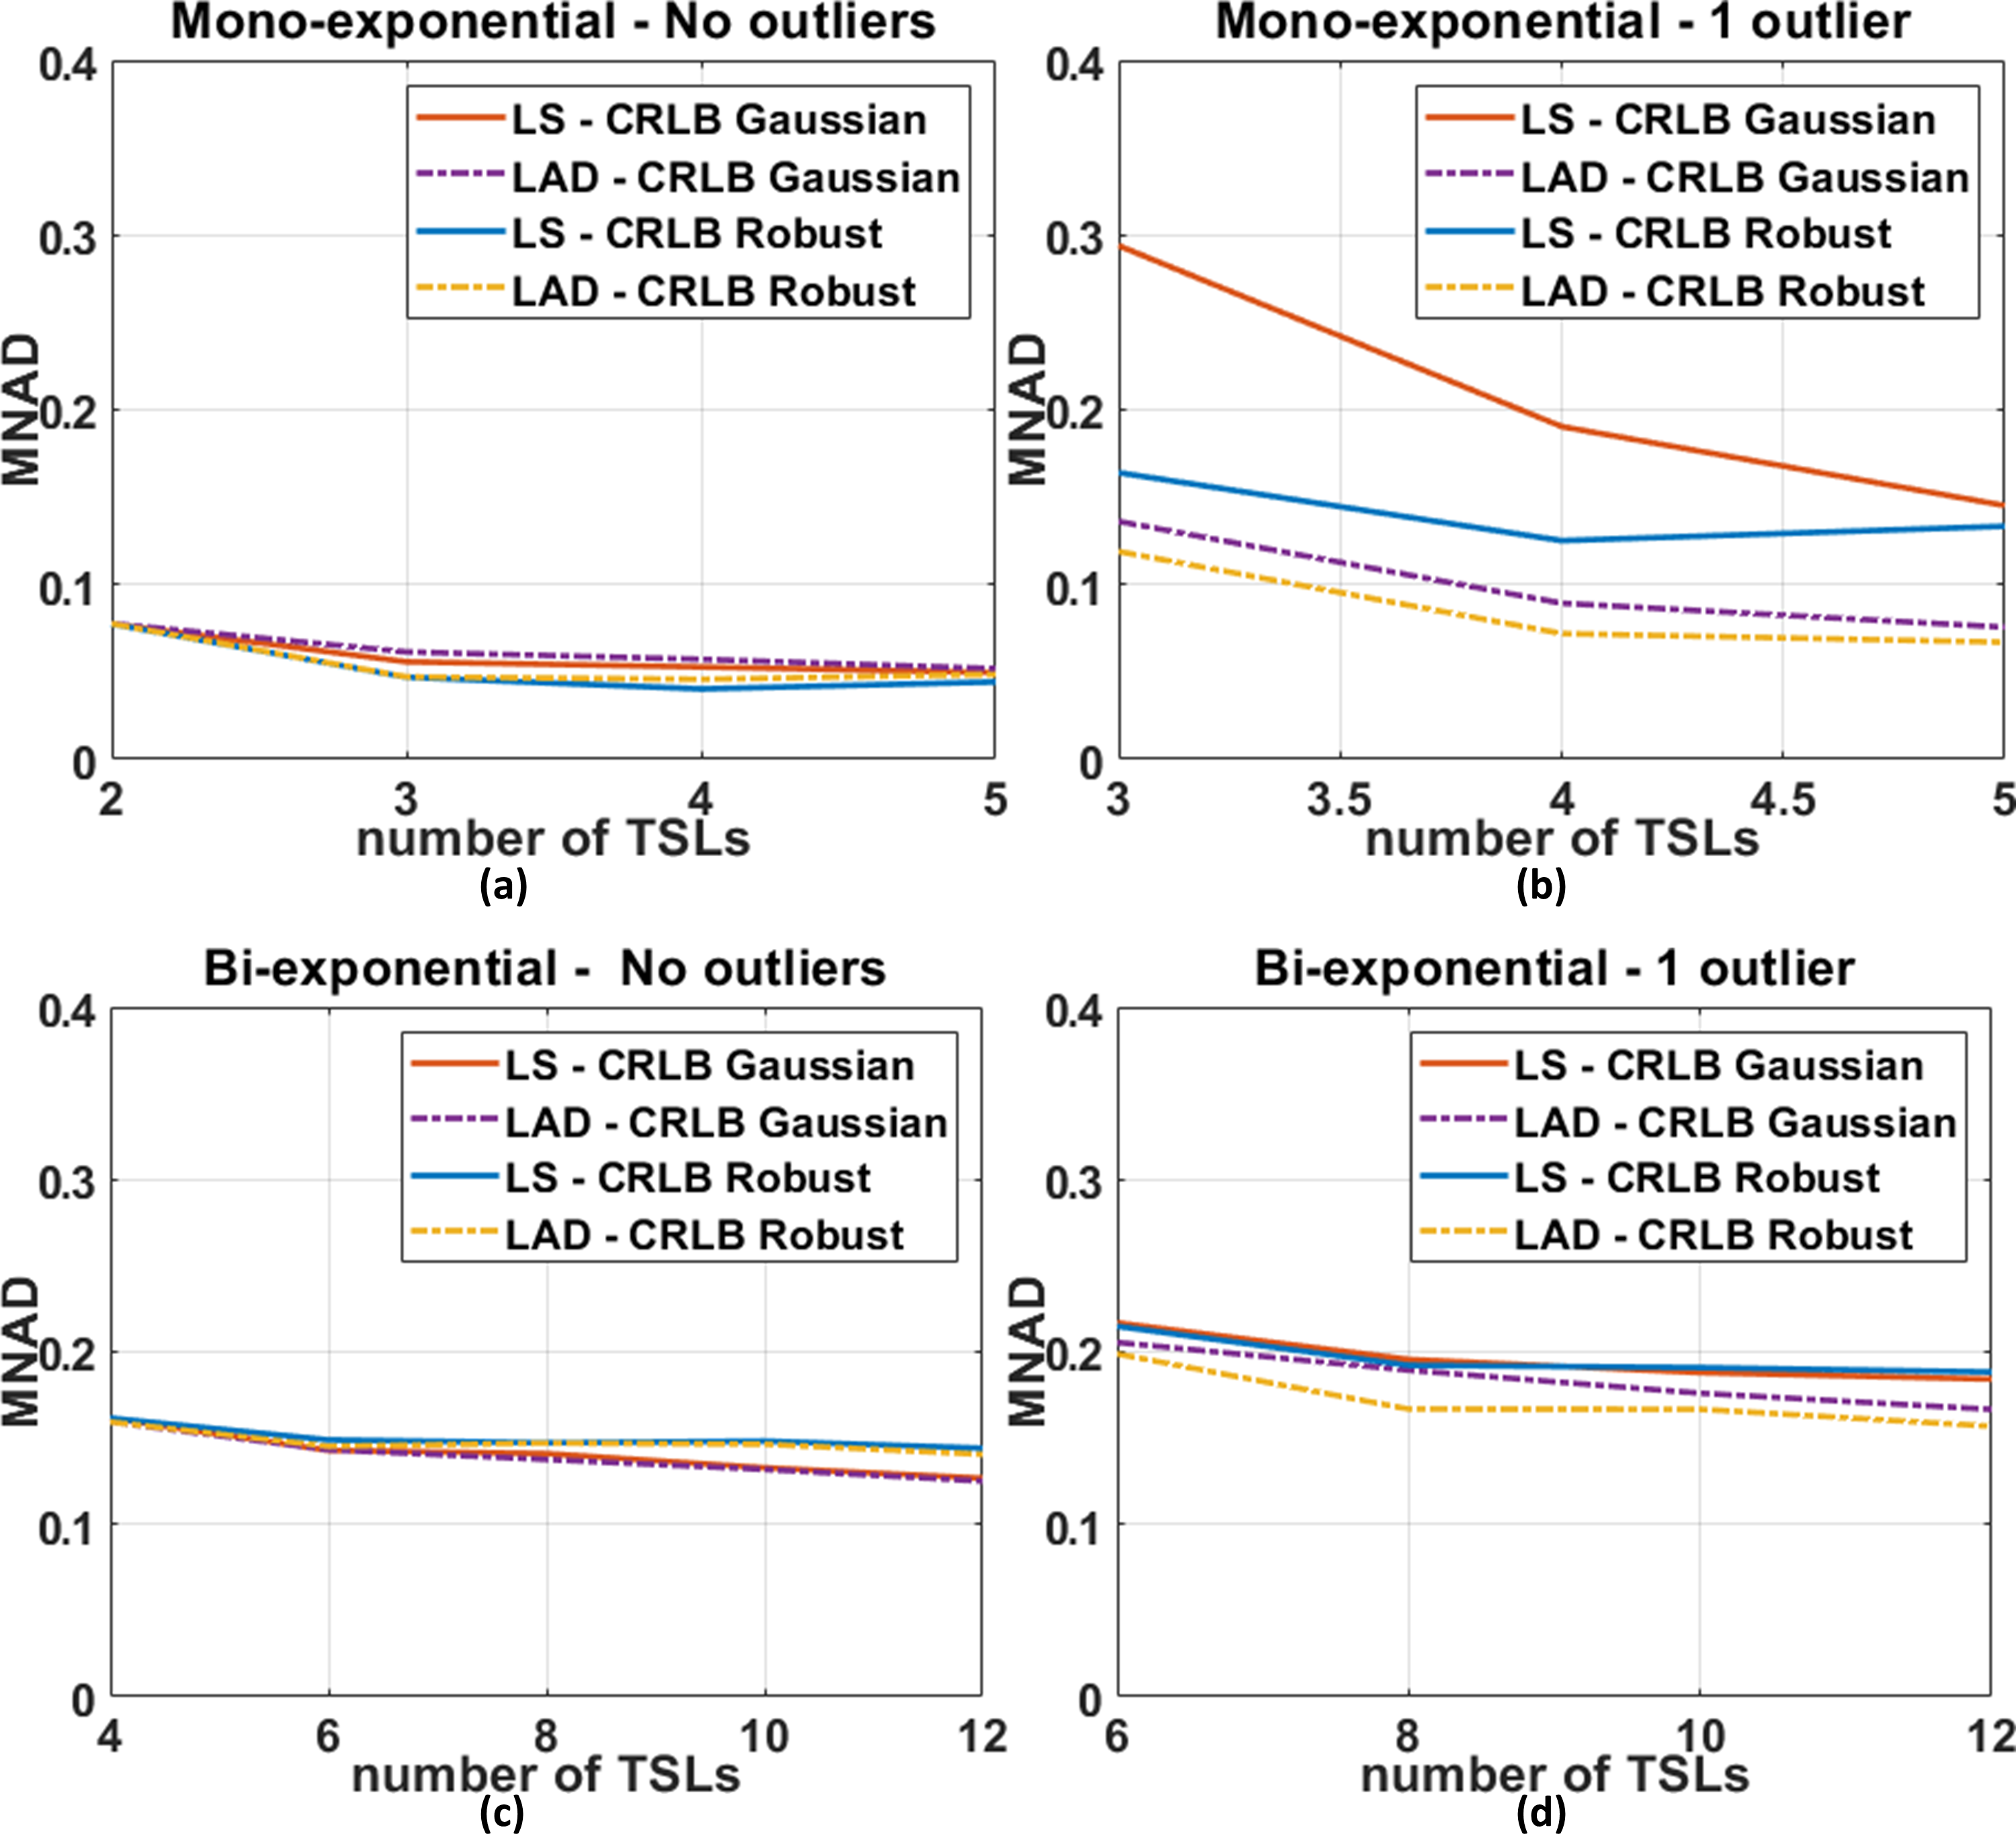
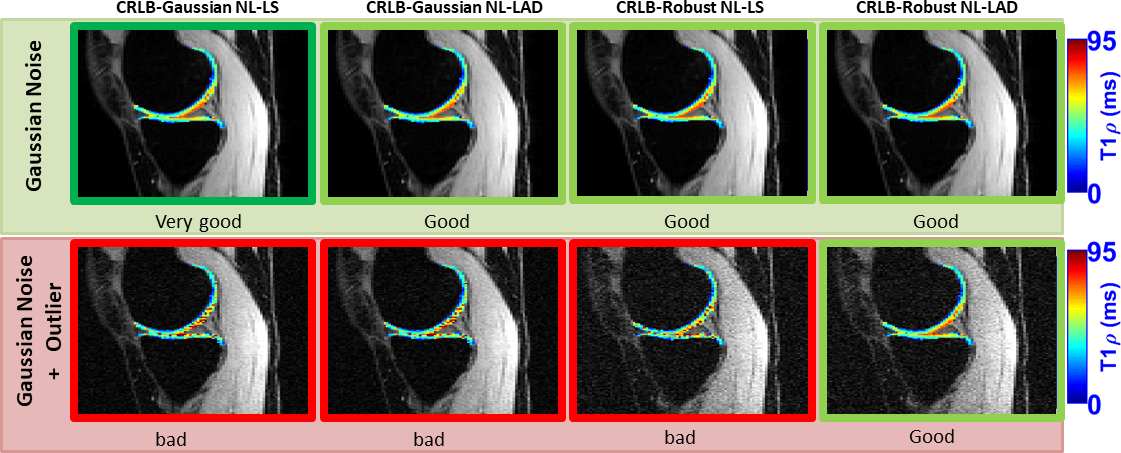
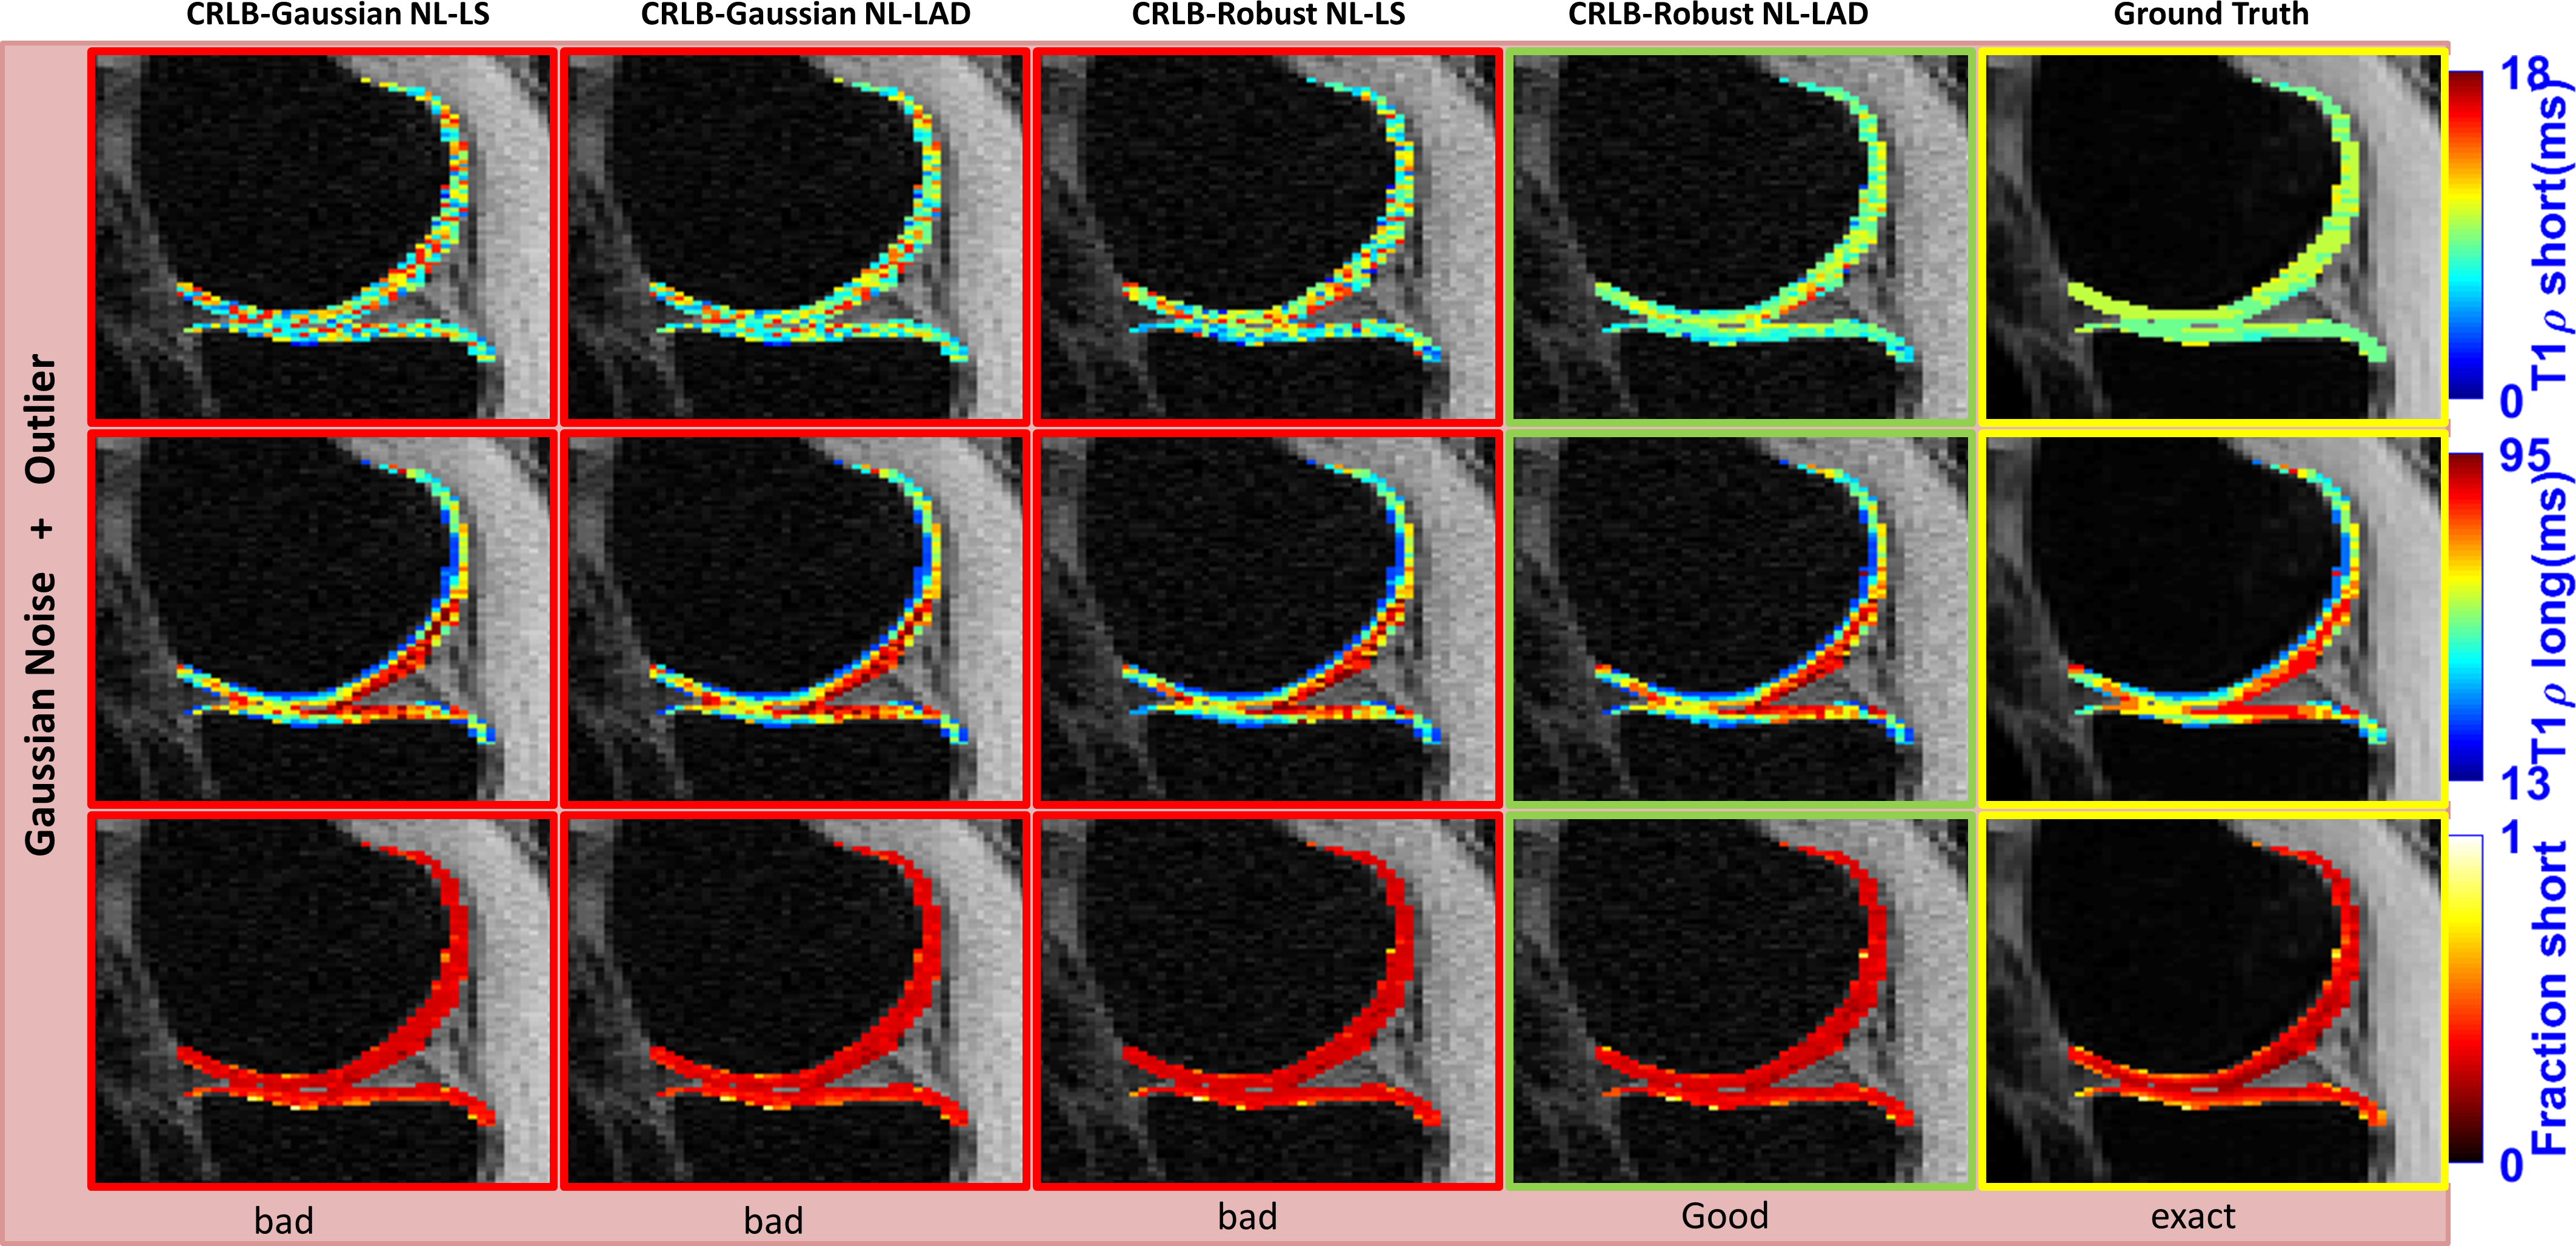
The fitting process was performed with NL-LS and NL-LAD, using all the optimized #TSLs with Gaussian and robust statistics. NL-LS and NL-LAD minimizations were done utilizing conjugate gradient Steihaug’s trust-region (CGSTR) [10]. The errors in the models were evaluated by using the median of the normalized absolute deviation (MNAD) [11]. A synthetic example of the outlier problem with a representative 3D-T1ρ mapping of knee cartilage is illustrated in Figures 3 and 4 for mono- and bi-exponential models respectively.
Results and Discussion:
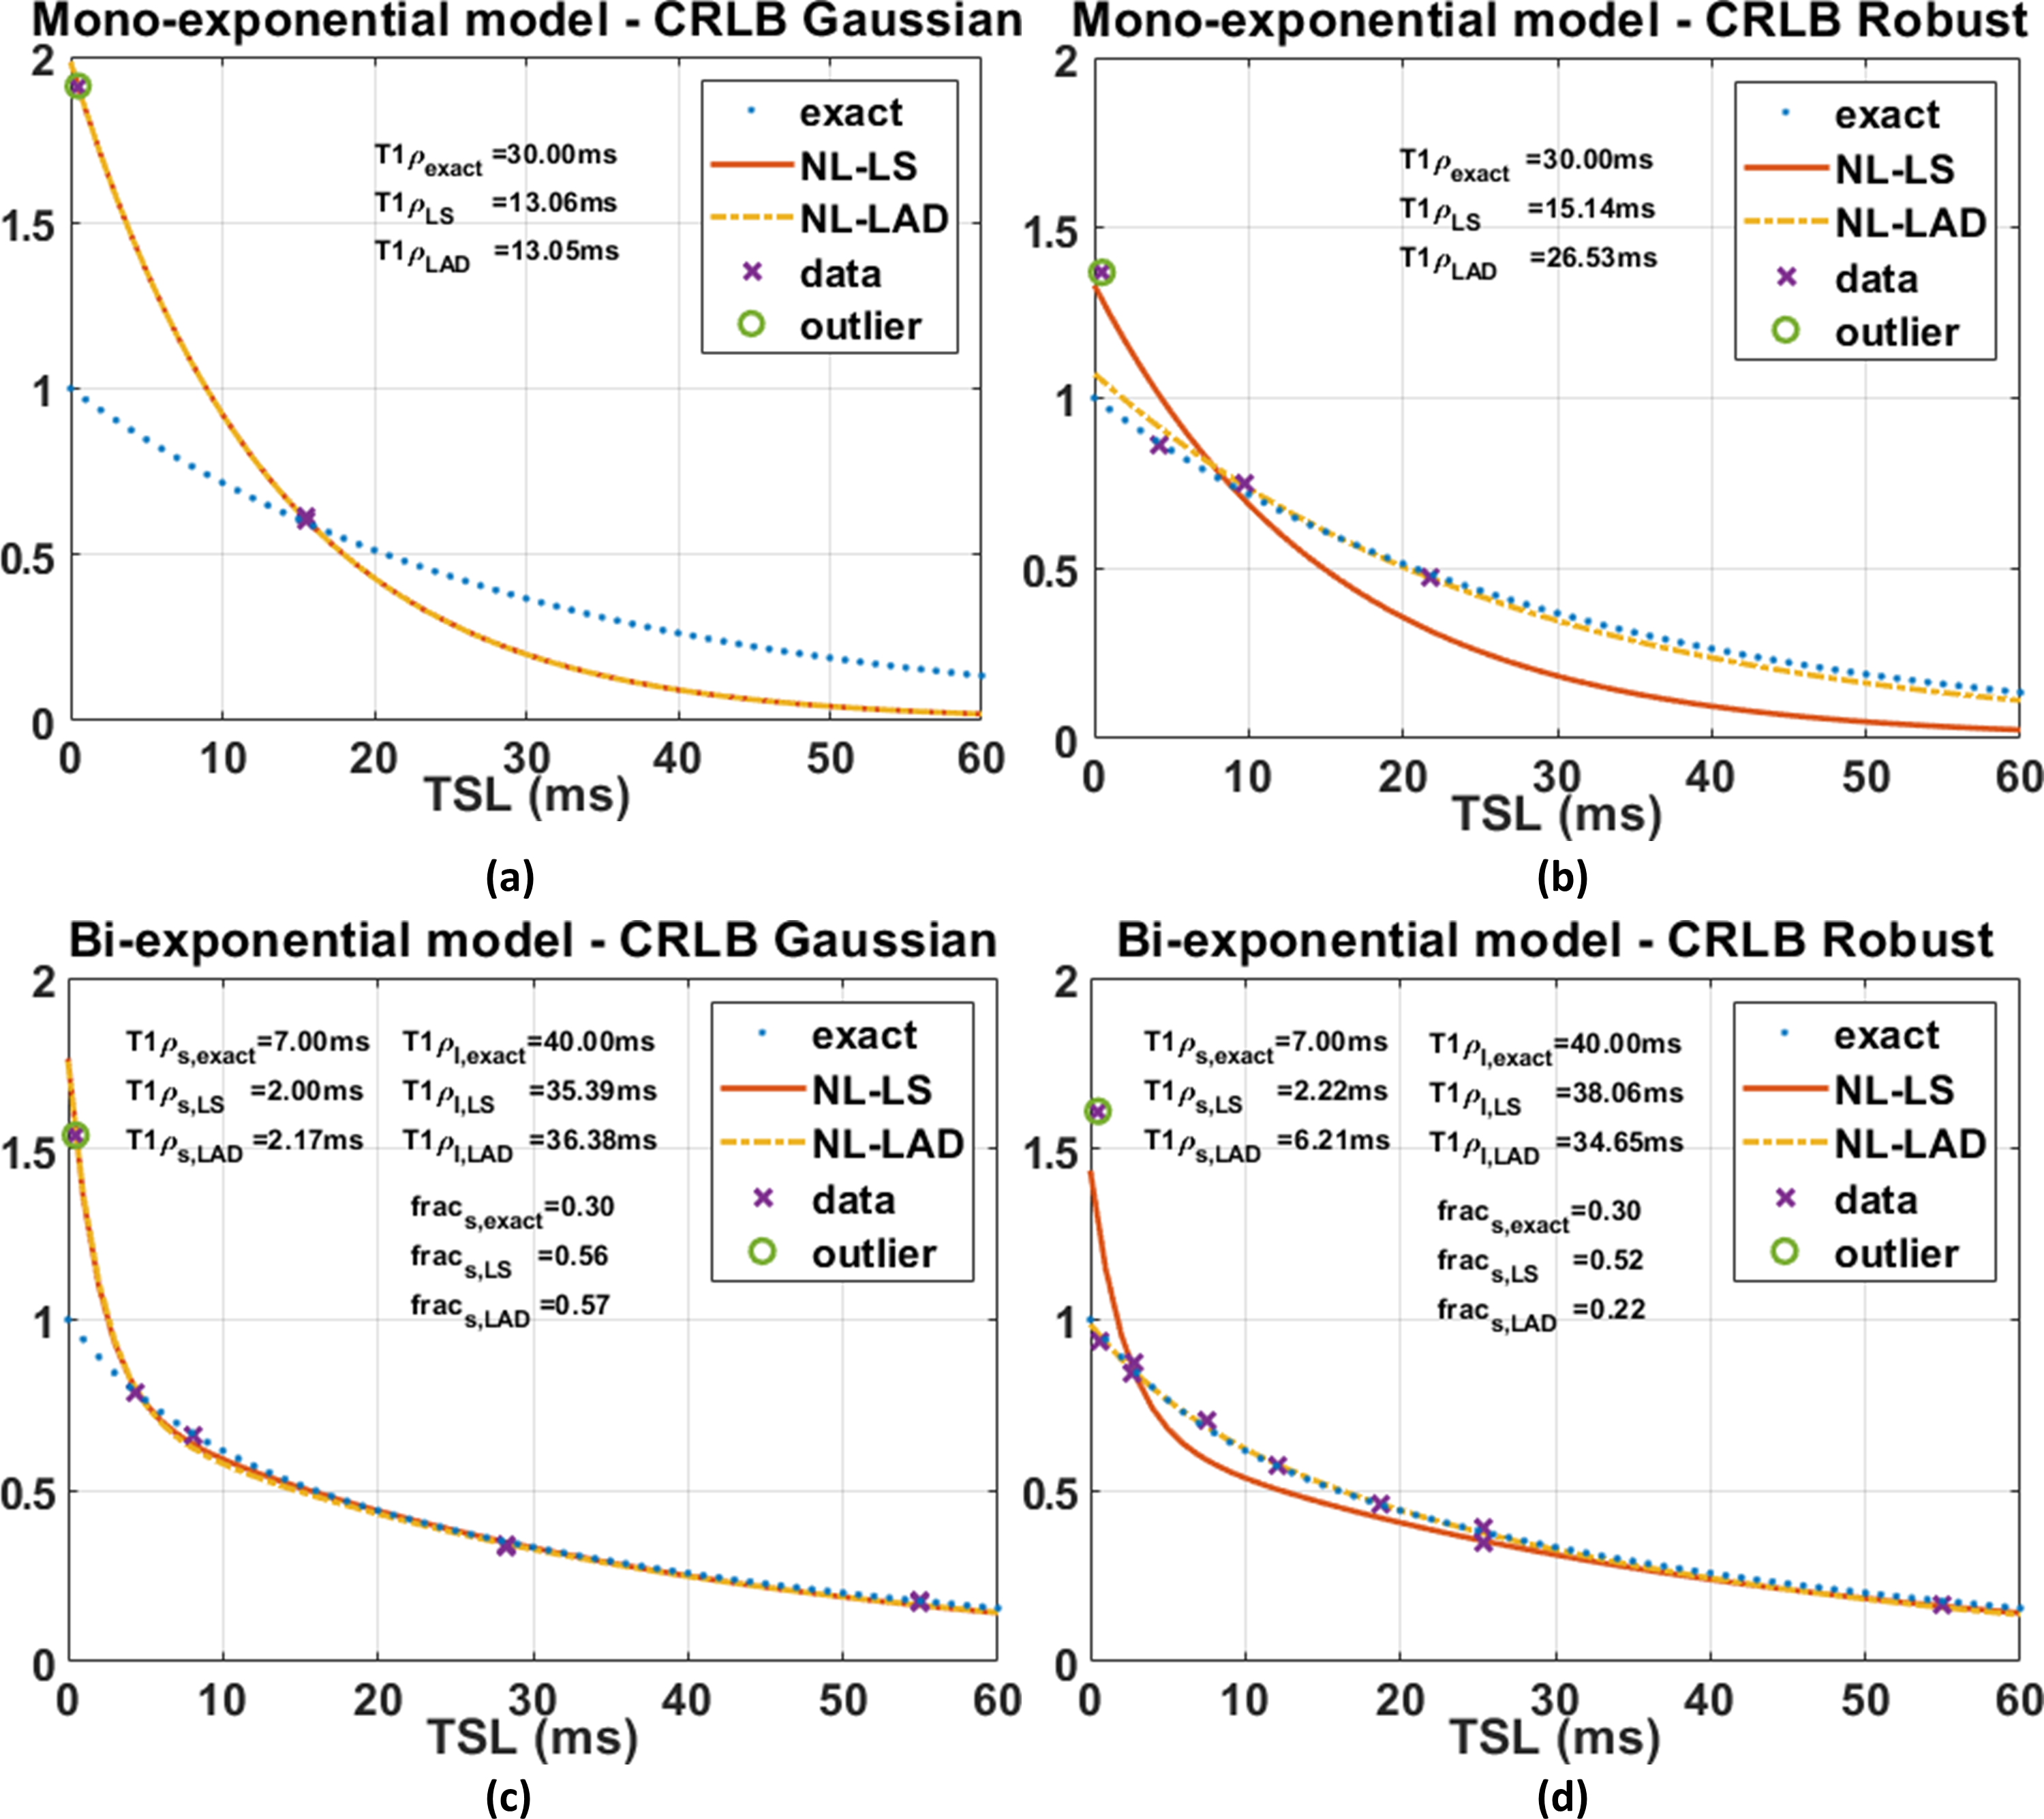
In Table 1, the optimized #TSLs with Gaussian and robust statistics are shown. In Figure 1, we illustrate an example from MCS comparing NL-LS and NL-LAD with some of the resulting optimized #TSLs. For mono-exponential model $$$T=4$$$ and for bi-exponential model $$$T=10$$$. This example illustrates why balanced redundancy with a well-distributed #TSLs is important for robustness to outliers.In Figure 2, the results of the MCS are shown. Note that the combination of CRLB-robust #TSLs with NL-LAD fitting is superior when one outlier is present in the data. In this experiment outliers are in random positions, not only the first time point.
In Figures 3 and 4, we show the synthetically produced outlier problem for 3D-T1ρ mapping of knee cartilage. In this case, the outlier is an extra noisy image in the first TSL.
The proposed robust approach (CRLB-robust NL-LAD) was superior to the other approaches, showing that the use of only one robust element alone, CRLB-robust or NL-LAD, does not solve outlier problem.
Acknowledgements
This work was supported in part by NIH grants R01-AR067156, R01-AR068966, and was performed under the rubric of the Center for Advanced Imaging Innovation and Research (CAI2R, www.cai2r.net) an NIBIB Biomedical Technology Resource Center (NIH P41 EB017183).References
[1] R. R. Regatte, S. V. S. Akella, J. H. Lonner, J. B. Kneeland, and R. Reddy, “T1ρ relaxation mapping in human osteoarthritis (OA) cartilage: Comparison of T1ρ with T2,” J. Magn. Reson. Imaging, vol. 23, no. 4, pp. 547–553, Apr. 2006.
[2] J. W. MacKay, S. B. L. Low, T. O. Smith, A. P. Toms, A. W. McCaskie, and F. J. Gilbert, “Systematic review and meta-analysis of the reliability and discriminative validity of cartilage compositional MRI in knee osteoarthritis,” Osteoarthr. Cartil., vol. 26, no. 9, pp. 1140–1152, Sep. 2018.
[3] D. A. Reiter, P.-C. Lin, K. W. Fishbein, and R. G. Spencer, “Multicomponent T2 relaxation analysis in cartilage,” Magn. Reson. Med., vol. 61, no. 4, pp. 803–809, Apr. 2009.
[4] A. Sharafi, D. Xia, G. Chang, and R. R. Regatte, “Biexponential T 1ρ relaxation mapping of human knee cartilage in vivo at 3 T,” NMR Biomed., vol. 30, no. 10, p. e3760, Oct. 2017.
[5] C. P. Johnson, D. R. Thedens, and V. A. Magnotta, “Precision-guided sampling schedules for efficient T1ρ mapping,” J. Magn. Reson. Imaging, vol. 41, no. 1, pp. 242–250, Jan. 2015.
[6] S. M. Kay, Fundamentals of Statistical Processing, Volume I: Estimation Theory. Prentice Hall, 1993.
[7] P. Huber and E. Ronchetti, “Robust statistics,” 1981.
[8] L. Gao, “Numerical algorithms for nonlinear Lp-norm problem and its extreme case,” J. Comput. Appl. Math., vol. 129, no. 1–2, pp. 139–150, Apr. 2001.
[9] R. Baboli, A. Sharafi, G. Chang, and R. R. Regatte, “Isotropic morphometry and multicomponent T 1 ρ mapping of human knee articular cartilage in vivo at 3T,” J. Magn. Reson. Imaging, vol. 48, no. 6, pp. 1707–1716, Dec. 2018.
[10] T. Steihaug, “The conjugate gradient method and trust regions in large scale optimization,” SIAM J. Numer. Anal., vol. 20, no. 3, pp. 626–637, Jun. 1983.
[11] M. V. W. Zibetti, A. Sharafi, R. Otazo, and R. R. Regatte, “Compressed sensing acceleration of biexponential 3D‐T1ρ relaxation mapping of knee cartilage,” Magn. Reson. Med., vol. 81, no. 2, pp. 863–880, Feb. 2019.
Figures