2728
Short Term Effects of Running on Knee Cartilage: Global and Regional T2 Relaxation Times in Femoral Cartilage of Female Recreational Runners1Mechanical Engineering, Stanford University, Palo Alto, CA, United States, 2Radiology, Stanford University, Palo Alto, CA, United States, 3Bioengineering, Stanford University, Palo Alto, CA, United States, 4Stanford University, Palo Alto, CA, United States
Synopsis
To identify potential changes in cartilage hydration or microstructure resulting from exercise we compared global and regional T2 relaxation times of eleven female recreational runners and five controls at baseline, time 0, and time 60 minutes post-exercise. No significant difference in mean T2 relaxation times between the runner group and the control group were found at any time point in either global or regional analysis. Suspected changes in cartilage hydration or microstructure resulting from biomechanical running forces may not manifest in such a way that is detectable by global or regional T2 relaxation analysis compared to controls.
Synopsis
To identify potential changes in cartilage hydration or microstructure resulting from exercise we compared global and regional T2 relaxation times of eleven female recreational runners and five controls at baseline, time 0, and time 60 minutes post-exercise. No significant difference in mean T2 relaxation times between the runner group and the control group were found at any time point in either global or regional analysis. Suspected changes in cartilage hydration or microstructure resulting from biomechanical running forces may not manifest in such a way that is detectable by global or regional T2 relaxation analysis compared to controls.Introduction
Osteoarthritis (OA) is a chronic, debilitating disease characterized by degenerative changes to joint cartilage1. Running-induced biomechanical stress in the knee may be a risk factor for developing OA2, and both reductions and increases in global T2 relaxation times have been observed in knee cartilage of healthy subjects following various lengths of time running3,4. The goal of this study is to investigate differences in global and regional analysis of T2 relaxation times at baseline and during post-activity scans between recreational runners and control subjects using a novel quantitative double-echo steady-state (qDESS) sequence. In particular, we analyzed global and regional T2 relaxation time change of pre-and post-exercise/rest scans.Methods
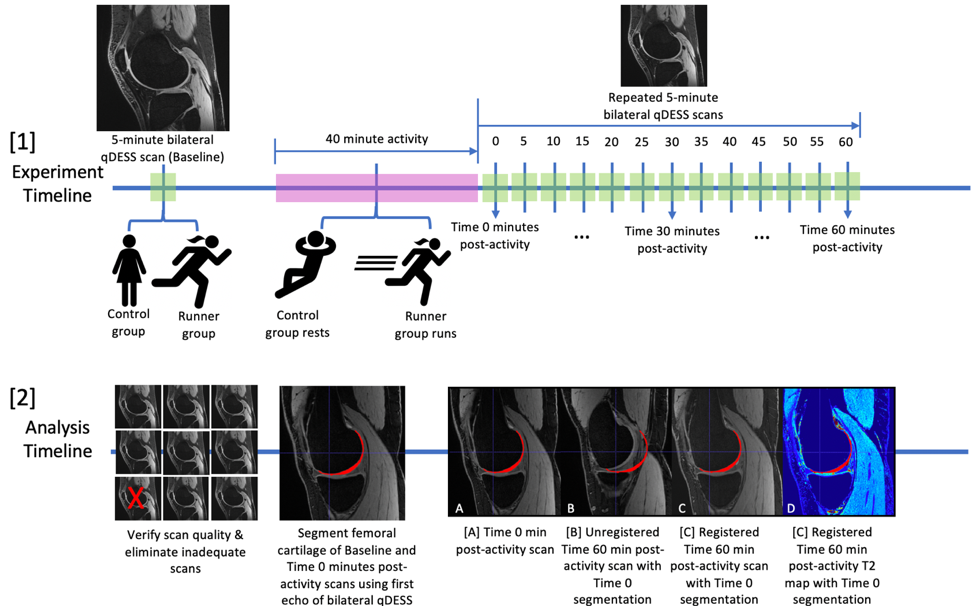
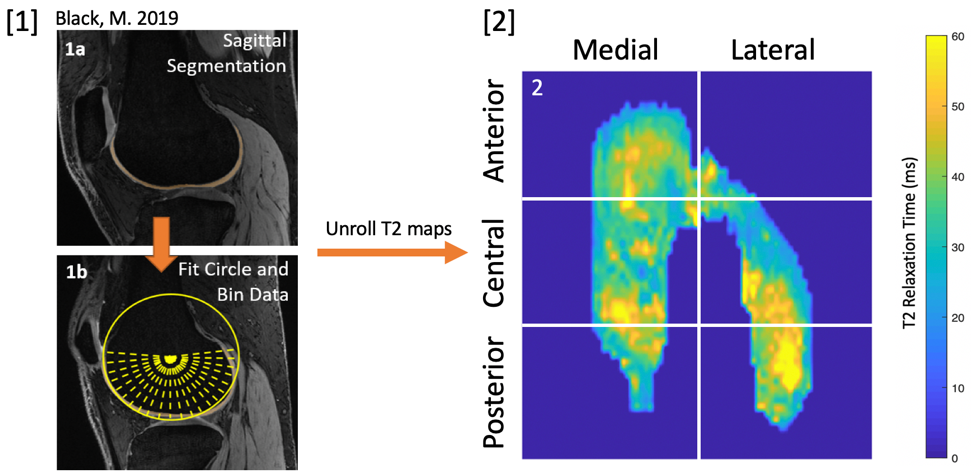
Eleven healthy female recreational runners (20 knees, 22-59yo, 9-25 miles/week, 19.5-24.1 BMI) and five healthy female controls (9 knees, 24-54yo, 0 miles/week, 20.0-24.1 BMI) were included in this study. Subjects were scanned on a 3T MRI scanner (GE Healthcare, Milwaukie, WI) with a 16-channel flex coil on each knee. Image acquisition used a simultaneous bilateral qDESS sequence5 with parameters: TR=15.5ms, TE1/TE2=5.2/25.8ms, 1.4mm slice thickness, 256x256 matrix (FOV=160x160mm). Subjects were scanned at baseline and then at five-minute intervals for 60 minutes following either a 40-minute run (runner group) or 40-minute rest (control group) (Figure 1). Femoral cartilage of baseline and Time 0 minutes post-activity (Time 0) scans were manually segmented using the first echo of qDESS8 (Figure 1) and T2 relaxation values were calculated from the qDESS sequences as previously described6. T2 maps of continuous scans (Time 5 minutes post-activity to Time 60 minutes post-activity for a total of 13 T2 maps per knee) were registered to the Time 0 minutes scans (Elastix rigid registration) 7 (Figure 1). Femoral cartilage T2 projections were created by fitting segmentations of the 3D T2 maps to a cylinder and then radially projecting the values into angular bins to generate unrolled maps6 (Figure 2).Outcomes were reported both as global and regional T2 relaxation times. A mixed effects model with Bonferroni post-hoc comparisons was used to test for differences in mean T2 relaxation times between the two groups at baseline, and 0 and 60 minutes post-activity in each knee for both superficial and deep cartilage.
Results
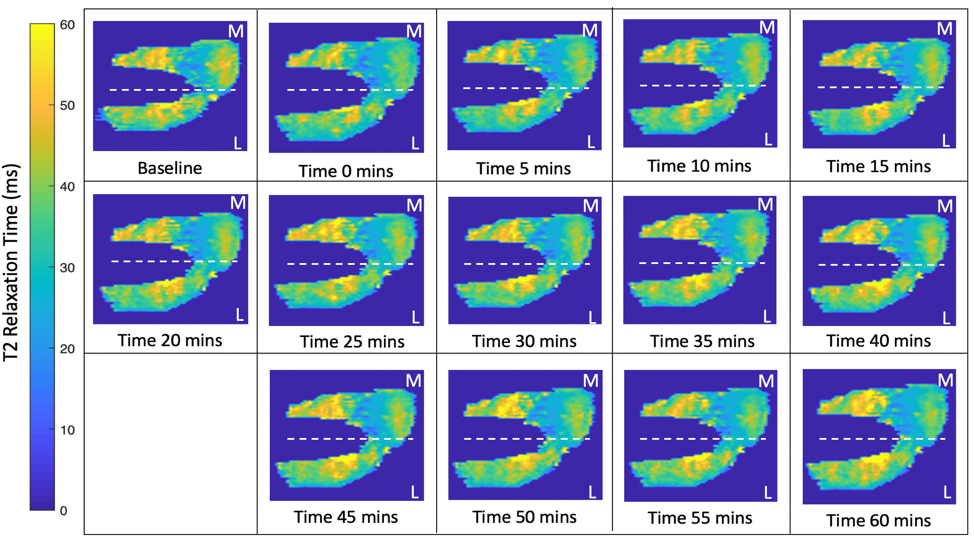
A representative progression of unrolled femoral cartilage T2 relaxation maps for a runner at baseline, time 0 minutes, time 5 minutes, … time 60 minutes is shown in Figure 3. There were no significant differences (P>0.05) between the mean T2 relaxation time (ms) of the runner group and the control group in superficial or deep femoral cartilage layers at Baseline, Time 0 minutes post-activity, or Time 60 minutes post-activity (Figure 4). There were no significant differences (P>0.05) in mean T2 relaxation time (ms) between the runner group and the control group at Baseline, Time 0 minutes, or Time 60 minutes (Figure 5) or between the runner group and the control group in the anterior, central, or posterior regions of the femoral cartilage (Figure 5).Discussion
Previously, significant reductions in T2 relaxation time (ms) have been observed between Baseline and post-run scans of female recreational runners3. However, when baseline and post-run scans of female recreational runners compared with baseline and post-rest scans of healthy controls, there were no significant differences between the runner group and the control group.Conclusion
Any expected changes in water content resulting from biomechanical forces of running as indicated by changes in global T2 relaxation times of femoral cartilage in a population of female healthy recreational runners may not manifest in such a way that is detectable by global or regional T2 relaxation analysis compared to controls.Acknowledgements
R01 AR065248-01A1, NIH K24-AR062068-07, NIH R01-AR063643-05, NIH R00 EB022634 and GE HealthcareReferences
[1] Braun, H J, and Gold, G E. Diagnosis of Osteoarthritis: Imaging. Bone, August, 2012;51(2):278–288. doi: 10.1016/j.bone. 2011.11.019.
[2] Lane NE, Oehlert JW, Bloch DA, Fries JF. The relationship of running to osteoarthritis of the knee and hip and bone mineral density of the lumbar spine: a 9 year longitudinal study. J Rheumatol. 1998; 25 (2):334–41. PMID: 9489830
[3] Crowder H, Mazzoli V, Black M, et al. Short-Term Effects of Running on T2 Relaxation Times of Femoral Cartilage in Female Runner. ISMRM, 2019.
[4] Chen M, Qiu L, Shen S, Wang F, Zhang J, Zhang C, et al. (2017) The influences of walking, running and stair activity on knee articular cartilage: Quantitative MRI using T1 rho and T2 mapping. PLoS ONE 12(11): e0187008. https://doi.org/ 10.1371/journal.pone.0187008
[5] Kogan F, Levine E, Chaudhari AC, Monu UD, Epperson K, et al. Simultaneous Bilateral-Knee MR Imaging. Magnetic resonance in medicine, 2018; 80(2):529- 537. https://doi.org/10.1002/mrm.27045
[6] Black M, Daehyun Y, Young K, et al. Detecting Early Changes in ACL-Reconstructed Knee Cartilage: Cluster Analysis of T2 Relaxation Times in Superficial and Deep Cartilage and ADC Analysis. ISMRM, 2019.
[7] S. Klein, M. Staring, K. Murphy, M.A. Viergever, J.P.W. Pluim, "elastix: a toolbox for intensity based medical image registration," IEEE Transactions on Medical Imaging, vol. 29, no. 1, pp. 196 - 205, January 2010.
[8] Sveinsson B, Chaudhari AC, Gold GE, Hargreaves BA. A Simple Analytical Method for Estimating T2 in the Knee From DESS. Magnetic resonance in medicine, 2017; 38:63-70. doi: 10.1016/j.mri.2016.12.018.
Figures