2725
Association between Abdominal Fat and Skeletal Muscle Tissues Fat Deposition in Type 2 Diabetes Mellitus: A Pilot Investigation1Radiological Sciences, David Geffen School of Medicine at UCLA, Los Angeles, CA, United States, 2Medicine, David Geffen School of Medicine at UCLA, Los Angeles, CA, United States
Synopsis
Increased intramyocellular and extramyocellular lipids (IMCL and EMCL), abdominal lipids and decreased lipid unsaturation ratios, are of prime interest in determining relationships of these changes to insulin sensitivity and progression to type 2 diabetes (T2DM). We acquired 6-point Dixon based MRI of abdomen and accelerated MR Spectroscopic Imaging in calf muscle. In the T2DM group, BMI correlated positively with visceral fat, total fat and hepatic fat fractions. In contrast, BMI correlated negatively with pancreatic fat fractions (body/tail) in age-matched healthy volunteers. Mostly association between IMCL unsaturation index and abdominal fat content was observed. Also, we found an excellent correlation between abdominal lipid accretion and calf muscle lipid infiltration in T2DM and healthy controls predominantly inside muscle fibers (IMCL).
Introduction:
Type 2 diabetes mellitus (T2DM) is a chronic metabolic disorder in which almost every aspect of the body’s metabolism is altered1,2. Rising obesity rate is a key factor in the development of T2DM3. Two distinctive features of T2DM are insulin resistance (IR) and compromised function of the pancreatic β-cell4,5. T2DM individuals almost invariably manifest a serious breakdown in lipid dynamics in addition to hyperglycemia, often reflected by higher levels of circulating free fatty acids and triglycerides, reduced esterification and re-esterification of fatty acids in adipose tissues (AT) that promote ectopic accumulation of lipids in non-adipocyte tissue such as skeletal muscle, liver and pancreatic beta cells6-8. In skeletal muscle tissue, two pools of lipids are found, intramyocellular lipids (IMCL) and extramyocellular lipids (EMCL) and can be better differentiated using 2D MRS9 due to its improved spectral dispersion. An inverse correlation was found between the IMCL and insulin sensitivity in sedentary and diabetic subjects10. On the other hand, abdominal adiposity is observed in the majority of patients with T2DM. Several studies11,12 have indicated that individuals with T2DM have more visceral adipose tissues (VAT), intermuscular adipose tissues and less subcutaneous adipose tissues (SAT) than nondiabetic healthy controls. Quantitative evaluation of distribution of adipose tissues in various compartments within the body is important for the study of patients with T2DM and metabolic syndrome. The aims of the present study were to quantify abdominal fat by 6-point Dixon13 MRI and calf muscle lipids by 5D echo-planar correlated spectroscopic imaging (EP-COSI)14 at 3T, and to examine the correlation between these parameters in T2DMMaterials and Methods:
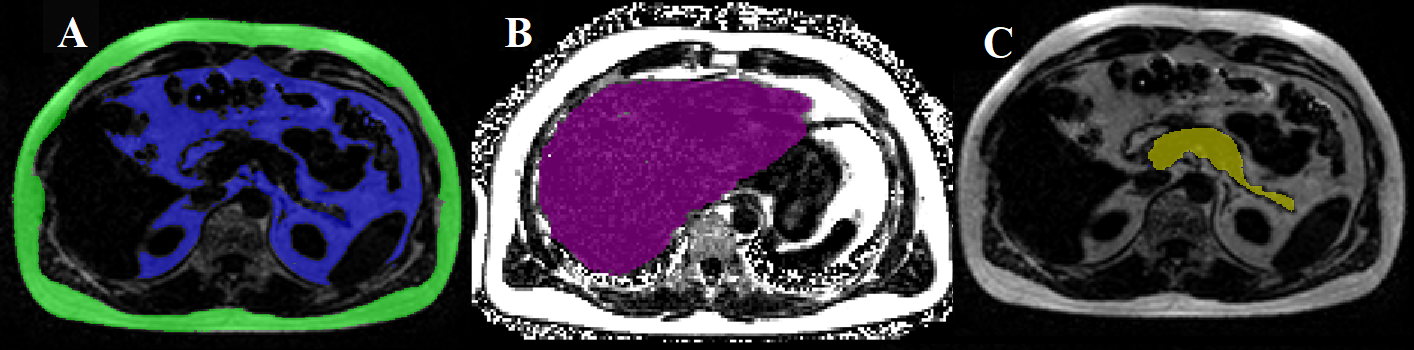
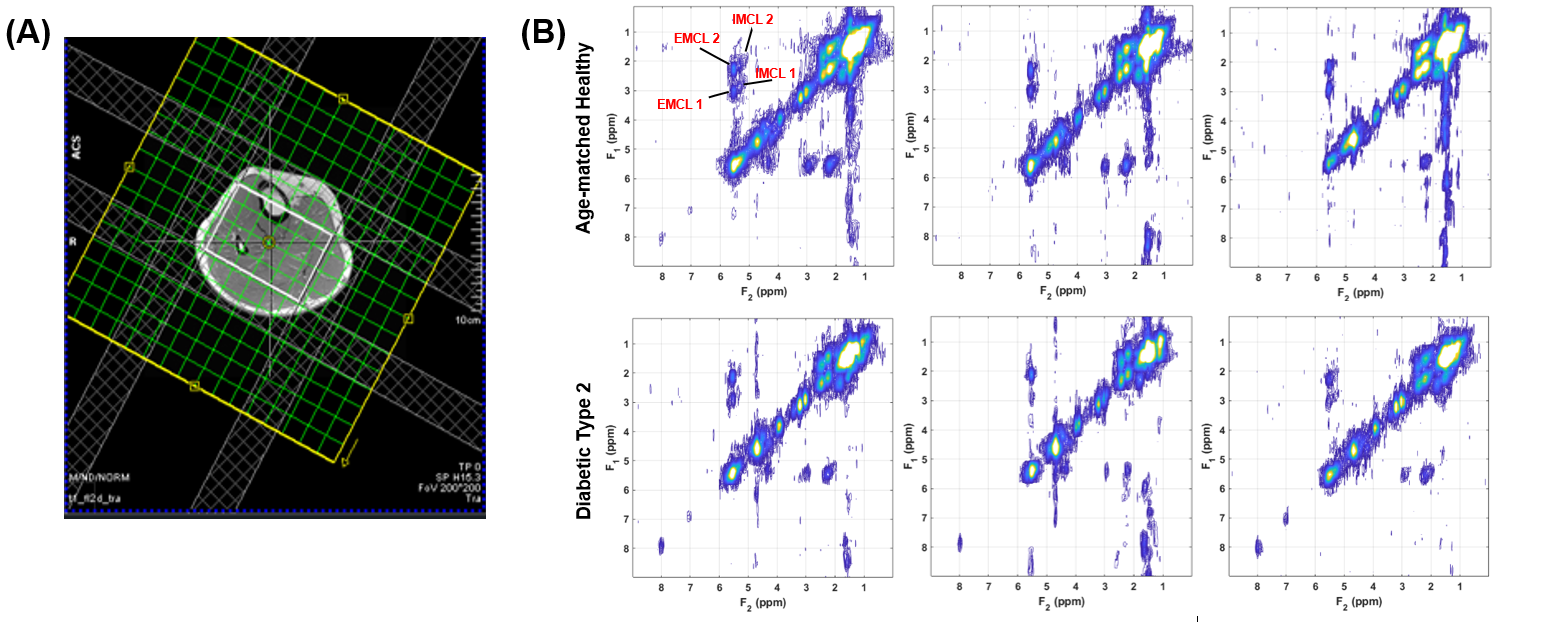
The study participants consisted of nine T2DM patients (age=59.8±5.0years, BMI=25.8±4.2), and seven age-matched healthy controls (AMHC) (age=59.8±8.3years, BMI=26.2±2.3). A Siemens 3T Prisma MRI Scanner with a surface matrix array and a spinal phased-array coil was used. Abdominal MRI was performed using a 3D GRE VIBE 6-point Dixon sequence with the following parameters: voxel size=1.187x1.187x3mm3, slices=52, matrix size=320x240, TR=8.85ms, bandwidth=1080Hz/px, flip-angel=50 and shortest possible TEs (equidistant with TE1=1.23 ms and an echo time shift of 1.23 ms). 5D EP-COSI data in calf were recorded using a knee coil with the following parameters: TR/TE=1500/35ms, voxel size=1.5x1.5x1.5cm3, matrix size=16x16x8, spectral width SW2=1190Hz, SW1=1250Hz, 512 t2 points, 64 t1 increments, acceleration factor=8. A non-water-suppressed scan were acquired for eddy current and phase corrections.We used the image analysis software slice-O-matic (Tomovision, Canada) to quantify SAT and VAT (Fig.1(A)). Hepatic fat fraction (HFF) was measured by ROI selected in homogeneous sections of the liver (Fig.1(B)). To calculate pancreatic fat fraction (PFF), one ROI was placed each in the head, and body/tail of the pancreas (Fig.1(C)). EP-COSI data was reconstructed using a Group Sparsity-based compressed sensing algorithm14. The ratios with respect to Cre3.0 (creatine at 3 ppm) were quantified using peak integral values for the following metabolites: FAT (lipids at 1.4 ppm), Cre3.0, Cho (3.2 ppm), Cre3.9, UFD (olefinic fat at 5.4 ppm), carnosine (8 ppm), EMCL1 & EMCL2, IMCL1 & IMCL2. The EMCL and IMCL unsaturation indices (EMCLUI/IMCLUI) were defined as EMCL1/EMCL2 and IMCL1/IMCL2, respectively. Statistical analysis was done using the SPSS software. Partial correlation controlling for age, gender and BMI was applied to identify the relationship among different measures.
Results:
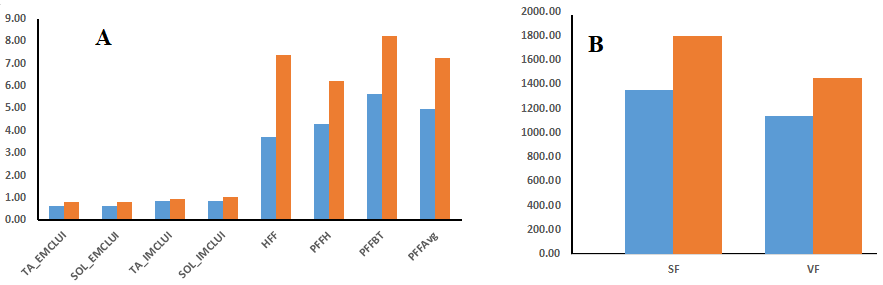
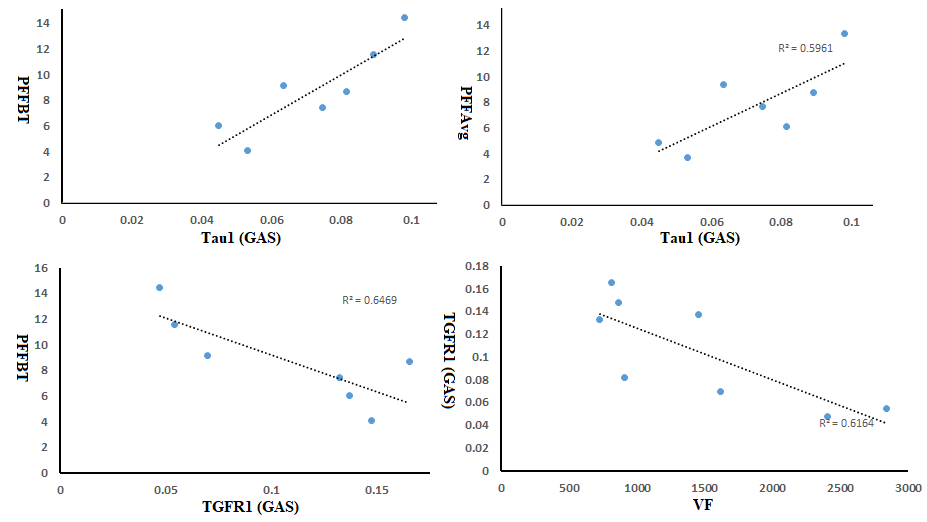
Spectral characteristics can be differentiated among the various calf muscle compartments: soleus (SOL), tibialis anterior (TA) and gastrocnemius (GAS) (Fig. 2). Fig. 3 showed the mean values of lipids and abdominal fats in T2DM and AMHC. As reported earlier, we found increasing trend for all these parameters in T2DM patients. In the T2DM group BMI correlated positively with VF (r=0.84), TF (r=0.80), HFF (r=0.85) where as in AMHC BMI correlated negatively with PFF at Body/Tail (r=-0.80). Age and gender did not show any association in both the groups. Table 1 shows the correlation between the abdominal fat content calculated from 6-point Dixon MRI and calf muscle lipids by 5D EP-COSI in T2DM patients and AMHC. In T2DM patients IMCLUI in soleus (Sol) and tibialis anterior (TA) correlated positively with PFF. Taurine (Tau1) in gastrocnemius (GAS) muscle also associated positively with PFF. Fig. 4 shows the correlation between GAS lipids with abdominal fat content.Discussion:
IMCL represents the presence of lipid molecules within the skeletal muscle cell, while EMCL consists of lipid molecules outside the cell. We found mostly association between IMCL unsaturation index and abdominal fat content. In light of the close relation between IMCL and insulin sensitivity, these results can help to explain the impact of dysfunctional adipose tissue in T2DM. Both EP-COSI and Dixon MRI showed the same trends in differentiating between T2DM and healthy controls. However, given the small sample size in this study, we didn’t observe any significant differences between the two groups. In AMHC, visceral fat was correlated with IMCL, which was also found in previous studies in lean and obese adolescents15. We did not see the correlation in the T2DM group.Conclusions:
In summary, we found an association between abdominal lipid accretion and calf muscle lipid infiltration in T2DM and healthy controls predominantly inside muscle fibers (IMCL). Further studies with a large pool of subjects are needed to characterize these associations between abdominal, hepatic and pancreatic fat accumulation with calf muscle metabolic parameters.Acknowledgements
This research was supported by grants from NIH/NIBIB: (R21EB02088302).References
1. https://www.cdc.gov/media/releases/2017/p0718-diabetes-report.html.
2. NCD Risk Factor Collaboration. Worldwide trends in diabetes since 1980: a pooled analysis of 751 population-based studies with 4.4 million participants. Lancet. 2016;387:1513–1530.
3. Despres J-P, Lemieux I. Abdominal obesity and metabolic syndrome. Nature. 2006;444(7121):881–887.
4. Thomas EL, Fitzpatrick JA, Malik SJ, et al. Whole body fat: content and distribution. Prog Nucl Mag Res SP. 2013;73:56–80.
5. Hu HH, Nayak KS, Goran MI. Assessment of abdominal adipose tissue and organ fat content by magnetic resonance imaging. Obes Rev. 2011;12:e504–15.
6. Cusi K. The role of adipose tissue and lipotoxicity in the pathogenesis of type 2 diabetes. Curr Diab Rep. 2010;10(4):306–15.
7. Chen P, Hou X, Hu G, et al. Abdominal subcutaneous adipose tissue: a favorable adipose depot for diabetes? Cardiovasc Diabetol. 2018;17(1):93.
8. Mantatzis M, Milousis T, Katergari S, et al. Abdominal adipose tissue distribution on MRI and diabetes. Acad Radiol. 2014 May;21(5):667–74.
9. Nagarajan R, Carpenter CL, Lee CC, et al. Assessment of Lipid and Metabolite Changes in Obese Calf Muscle Using Multi-Echo Echo-planar Correlated Spectroscopic Imaging. Sci Rep. 2017;7(1):17338.
10. Jacob S, Machann J, Rett K, et al. Association of increased intramyocellular lipid content with insulin resistance in lean nondiabetic offspring of type 2 diabetic subjects. Diabetes.1999;48(5):1113–1119.
11. Gallagher D, Kelley DE, Yim JE, et al. MRI Ancillary Study Group of the Look AHEAD Research Group. Adipose tissue distribution is different in type 2 diabetes. Am J Clin Nutr. 2009;89:807–814.
12. Bozzetto L, Prinster A, Mancini M, et al. Liver fat in obesity: role of type 2 diabetes mellitus and adipose tissue distribution. Eur J Clin Invest. 2011;41:39-44.
13. Grimm A, Meyer H, Nickel MD, et al. Evaluation of 2-point, 3-point, and 6-point Dixon magnetic resonance imaging with flexible echo timing for muscle fat quantification. Eur J Radiol. 2018;103:57–64.
14. Wilson NE, Burns BL, Iqbal Z, Thomas MA. Correlated spectroscopic imaging of calf muscle in three spatial dimensions using group sparse reconstruction of undersampled single and multichannel data. Magn Reson Med. 2015;74(5):1199-1208.
15. Sinha R, Dufour S, Petersen KF, et al. Assessment of skeletal muscle triglyceride content by (1)H nuclear magnetic resonance spectroscopy in lean and obese adolescents: relationships to insulin sensitivity, total body fat, and central adiposity. Diabetes 2002;51(4):1022–1027.
Figures