2724
CrCEST effects in Knee Osteoarthritis Patients following Plantar Flexion Exercise of lower leg skeletal muscle at 7.0T1Radiology, University of Pennsylvania, Philadelphia, PA, United States, 2Rheumatology & Epidemiology, University of Pennsylvania, Philadelphia, PA, United States
Synopsis
Osteoarthritis (OA) is the leading cause of disability in adult and aging populations. Knee OA increases difficulty in the functional use of various upper and lower leg muscles. In the recent years, CrCEST technique has emerged as a potential imaging biomarker to study muscle metabolism and its application was shown in different systemic diseases like mitochondrial disorders. Here, we are particularly interested in exploring and investigating the correlation of knee OA with post exercise CrCEST increase.
INTRODUCTION
Osteoarthritis (OA) is the most common arthritis affecting approximately 27 million Americans 1. OA subjects have reduced muscle function, and greater reduction of extension and flexion strength around knee due to joint pain, stiffness, and loss of muscular strength of lower extremity muscles 2-4. Patients with knee OA exhibited muscle impairments and muscle weaknesses found in quadriceps muscle 5. The creatine kinase (CK) kinetics mechanism (PCr + ADP + H+ ⇋ Cr + ATP) involves conversion of PCr into creatine (Cr) with the release of ATP during plantar flexion exercise (PFE), and ATP supplied by mitochondria reverse Cr back to PCr as a part of the recovery process 6,11. This PCr recovery varies in diseased populations such as primary mitochondrial disorders due to abnormality in CK function 11. Creatine chemical exchange saturation transfer (CrCEST) a noninvasive MRI technique, which measures free creatine generated during PFE, is a widely used method to study skeletal muscle metabolism in vivo 7-11. The relationship between knee OA pain and CrCEST effect reflected in lower skeletal muscle following PFE is yet unknown. The objective of this study is to explore and evaluate the association of clinical KL knee OA grade with the post exercise CrCEST increase.METHODS
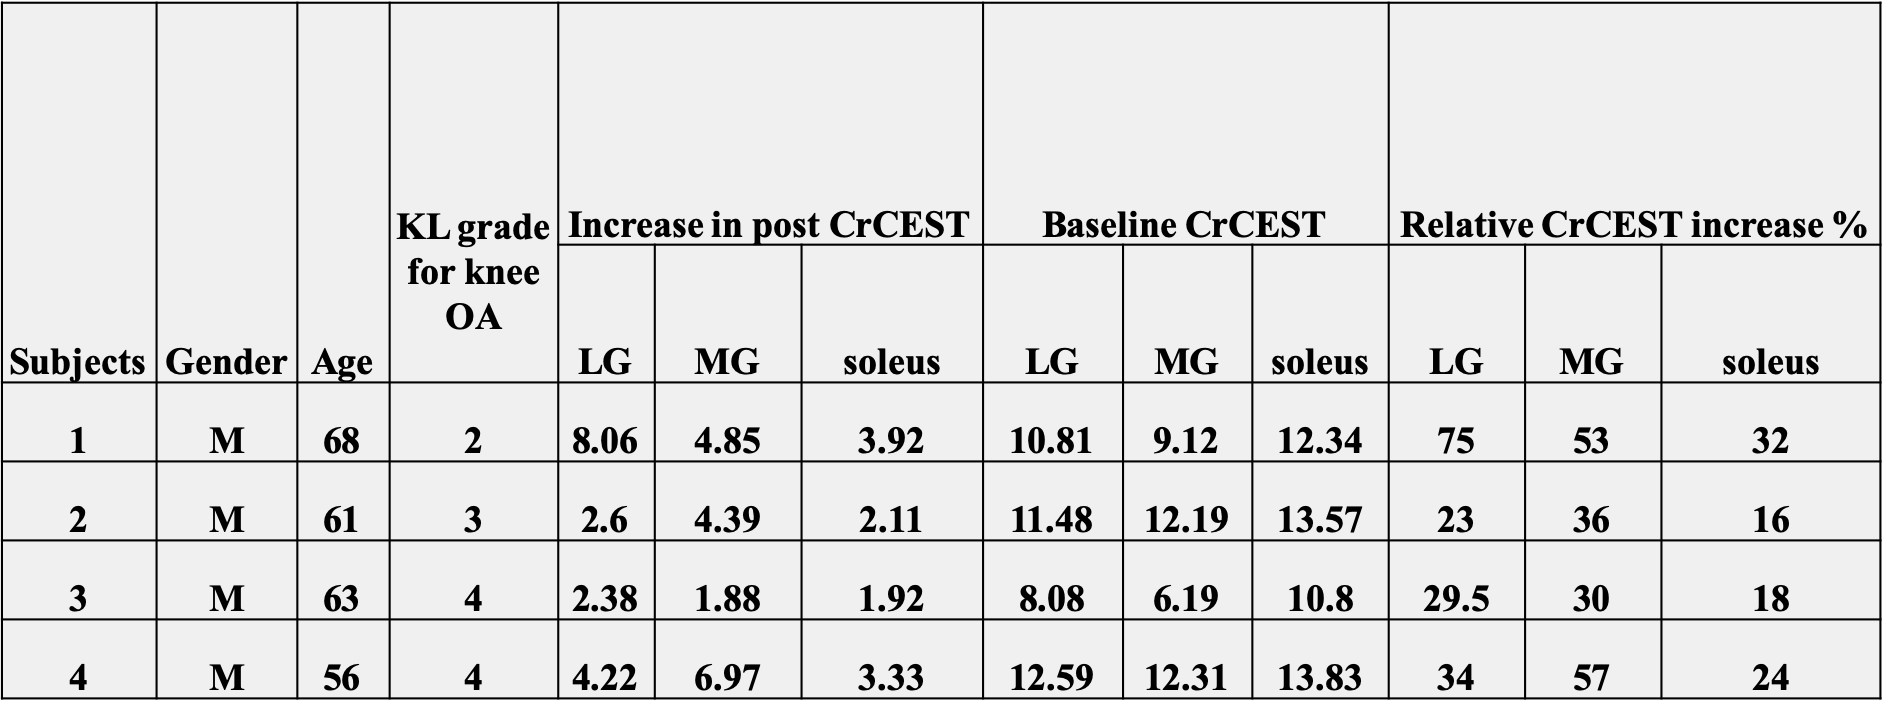
This clinical study was carried out at 7.0T (MAGNETOM Terra, Siemens Healthcare, Erlangen, Germany) using a 28-channel knee coil. Knee OA patients (4 males, aged 56 to 68 years old) were recruited to collect data in the center part of the lower right leg with KL knee OA scale range (2-4). The CrCEST weighted single axial slice images were collected using sequence with the following parameters: TR/TE = 6.0/3.0 ms, saturation pulse = 500 ms , B1rms = 124 Hz (2.9 µT), flip angle = 10o , slice thickness = 10 mm, in plane resolution = 1.3 x 1.3 mm2, field of view = 160 x 160 mm2, BW = 400Hz/Px. WASSR images (±0 to ±0.6 ppm and step-size ±0.1 ppm) and B1 map images with a saturation pulse B1rms of 0.29μT for 200ms duration were collected to correct the B0 and B1 field inhomogeneity correction of CrCEST-weighted images as described in previous studies 6,12-14. CrCEST maps were computed as the MTR asymmetry between the corrected images at ±1.8 ppm normalized with the image at -1.8 ppm 9. CEST images were collected at saturation offset frequencies of ±1.5 to ±2.1ppm (step-size ±0.3 ppm) relative to water. The MRI-Compatible and pneumatically controlled foot pedal against resistance of 7.5 PSI was used for PFE inside the MRI scanner. Patients were instructed to use right foot to fully press the pedal and bring it back to normal position with beep of metronome which was played for 2 minutes for total of 90 repetitions 11. CrCEST images were collected for 2 minutes before exercise and for 8 minutes following exercise with an interval of 30 seconds temporal resolutions. All post processing was done using in-house MATLAB codes as described previously 8,13,15.RESULTS
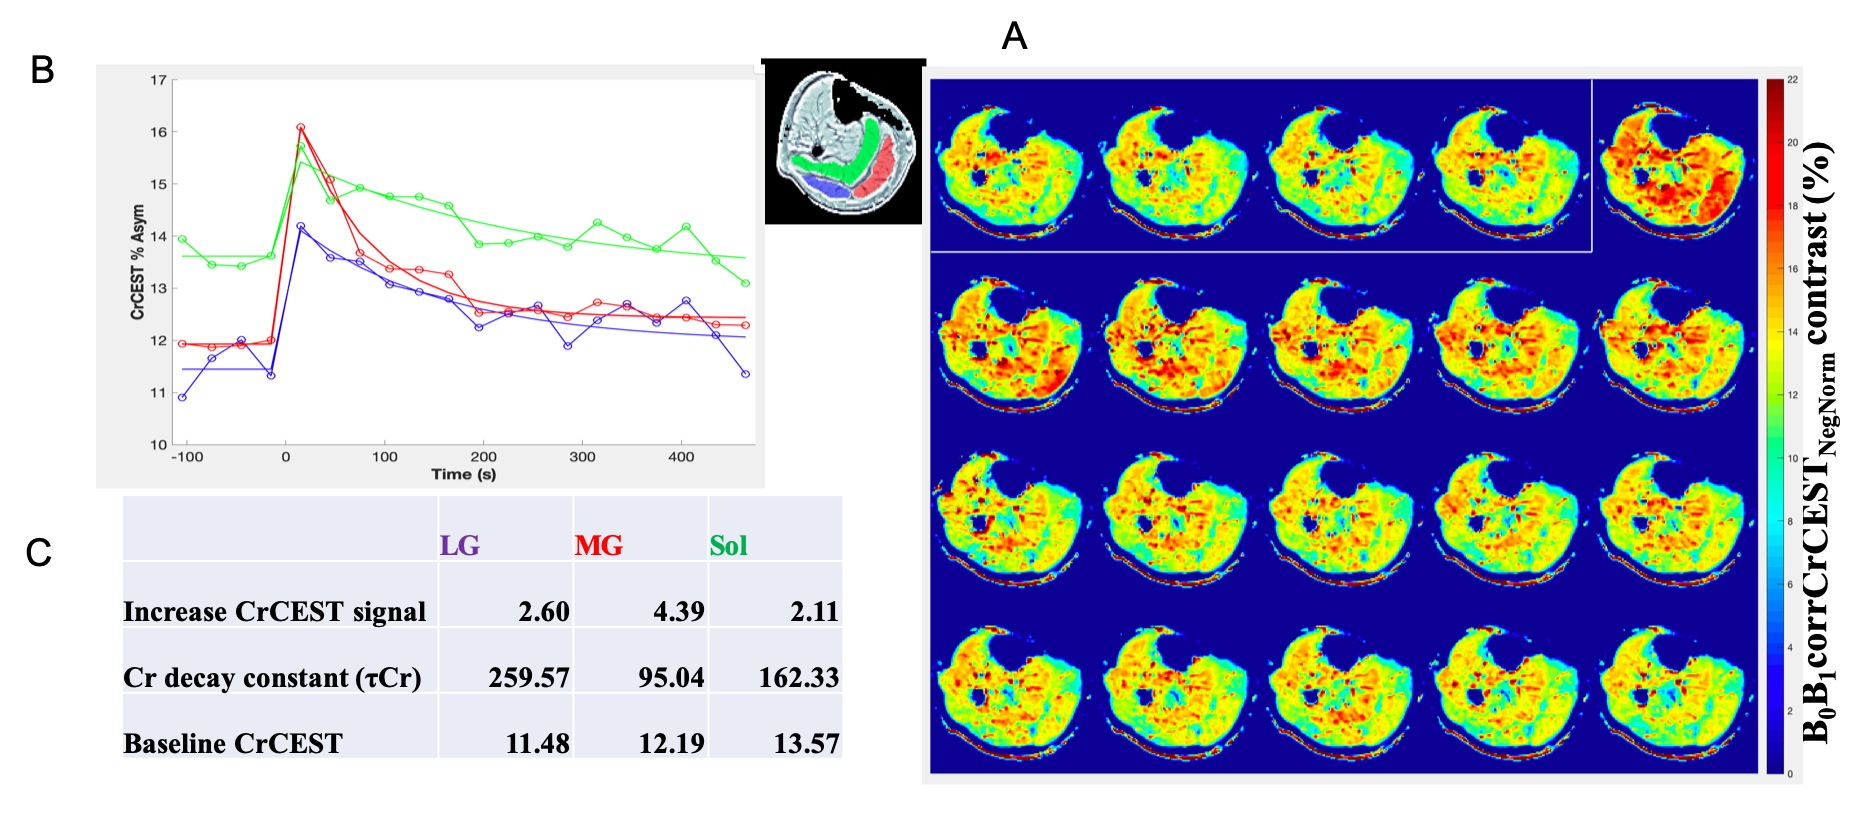
A data set from a male subject (age 61) with KL knee OA grade of 3 is shown in Figure 1A, where the intensity of the color in each image indicates CrCEST signal reflecting the amount of free creatine generated during exercise. Elevated level of CrCEST contrast following exercise was seen in different muscle groups, and recovery in CrCEST images were seen in the last 4 images. Recovery curves (Figure 1B) were derived from the mean CrCEST signal from each ROI. From the recovery curves, the following parameters were estimated for each ROI: baseline CrCEST, post exercise signal increase, and exponential decay constant of Cr as shown in Figure 1C. This particular subject did not use soleus and lateral gastrocnemius (LG) muscle to a greater extent as reflected by 2.11% and 2.60% CrCEST increase respectively in Figure 1C. The post exercise CrCEST increase in gastrocnemius (lateral and medial) and soleus muscles of 4 OA subjects with KL OA grade scale (2-4) were shown in Table. The amount of CrCEST increase post exercise shows heterogeneity between different muscle groups for the 4 subjects in this study.DISCUSSION
Our original hypothesis was that increased pain may lead to less exertion and hence less post exercise CrCEST increase as OA severity measured as KL grade. The muscle group heterogeneity in the data seems to show some adaptation effects. Further study needs to be conducted in more subjects to better understand the intermuscular and intramuscular variability in these populations with respect to their KL OA grade scale. In this study, only right leg muscles were scanned. We plan to perform comparisons between left and right leg muscles in the same subject or between subjects using CrCEST in the future.Acknowledgements
This project was supported by the National Institute of Biomedical Imaging and Bioengineering of the National Institute of Health under award number P41EB015893.References
1. What is Osteoarthritis? www.arthritis.org. https://www.arthritis.org/about-arthritis/types/osteoarthritis/what-is-osteoarthritis.php. Accessed November 5, 2019.
2. Hurley MV, Scott DL, Rees J, et al. Sensorimotor changes and functional performance in patients with knee osteoarthritis. Ann Rheum Dis. 1997;56(11):641-648.
3. Diracoglu D, Baskent A, Yagci I, et al. Isokinetic strength measurements in early knee osteoarthritis. Acta Reumatol Port. 2009;34(1):72-77.
4. Fisher NM, Pendergast DR. Reduced muscle function in patients with osteoarthritis. Scand J Rehabil Med. 1997;29(4):213-221.
5. Liikavainio T, Lyytinen T, Tyrväinen E, et al. Physical function and properties of quadriceps femoris muscle in men with knee osteoarthritis. Arch Phys Med Rehabil. 2008;89(11):2185-2194.
6. Kogan F, Haris M, Debrosse C, et al. In vivo chemical exchange saturation transfer imaging of creatine (CrCEST) in skeletal muscle at 3T. J Magn Reson Imaging. 2014;40(3):596-602.
7. Kogan F, Hariharan H, Reddy R. Chemical Exchange Saturation Transfer (CEST) Imaging: Description of Technique and Potential Clinical Applications. Current radiology reports. 2013; 1:102-114.
8. Kogan F, Haris M, Singh A, et al. Method for high-resolution imaging of creatine in vivo using chemical exchange saturation transfer. Magn Reson Med. 2014;71(1):164-172.
9. Haris M, Singh A, Cai K, et al. A technique for in vivo mapping of myocardial creatine kinase metabolism. Nature medicine. 2014; 20:209-14.
10. Haris M, Nanga RP, Singh A, et al. Exchange rates of creatine kinase metabolites: feasibility of imaging creatine by chemical exchange saturation transfer MRI. NMR Biomed. 2012;25(11):1305-1309.
11. DeBrosse C, Nanga RPR, Wilson N, et al. Muscle oxidative phosphorylation quantitation using creatine chemical exchange saturation transfer (CrCEST) MRI in mitochondrial disorders. JCI Insight. 2016;1(18): e88207.
12. Kim M, Gillen J, Landman BA, et al. Water saturation shift referencing (WASSR) for chemical exchange saturation transfer (CEST) experiments. Magn Reson Med. 2009;61(6):1441-1450.
13. Wilson NE. ExerciseCEST. Zenodo. http://doi.org/10.5281/zenodo.59640. Published August 4, 2016. Accessed October 3, 2016.
14. Singh A, Cai K, Haris M, et al. On B1 inhomogeneity correction of in vivo human brain glutamate chemical exchange saturation transfer contrast at 7T. Magn Reson Med. 2013;69(3):818-824.
15. Cai K, Haris M, Singh A, et al. Magnetic resonance imaging of glutamate. Nat Med. 2012;18(2):302-306.
Figures