2723
Monitoring micro-dystrophin treatment effects in mdx4cv mice using magnetic resonance imaging and spectroscopy1Radiology, University of Washington, Seattle, WA, United States, 2Neurology, University of Washington, Seattle, WA, United States, 3Medicine, University of Washington, Seattle, WA, United States, 4Senator Paul D. Wellstone Muscular Dystrophy Specialized Research Center, University of Washington, Seattle, WA, United States
Synopsis
Mutations in the X-linked dystrophin gene disrupts protein expression resulting in Duchenne muscular dystrophy (DMD), a neuromuscular disorder characterized by body-wide muscle cell degeneration. The mdx mouse model is one of the most commonly used animal models for DMD. Recombinant adeno-associated viral (rAAV) vector-mediated gene transfer represents a promising approach for DMD. Magnetic resonance has emerged as a noninvasive method in monitoring disease progression and treatment response for muscular dystrophy. The aim of this study was to elucidate the functional impact of micro-dystrophin on skeletal muscles using magnetic resonance imaging and spectroscopy.
Introduction
Duchenne muscular dystrophy (DMD), X-linked autosomal inherited disease is characterized by the absence of functional dystrophin leading to muscle damage and wasting [1, 2]. Clinical measures of muscular dystrophy rely on surgical biopsy, which is invasive and provide a limited overview of the disease progression. Magnetic resonance imaging (MRI) and spectroscopy (MRS) can detect pathological changes at the cellular and tissue level in skeletal muscle as it probes different aspects of the spin properties of 1H in tissue water, which are affected by the physiological and pathological status of the tissue [3, 4]. Adeno-associated viral (AAV) vectors are well characterized as gene-therapy tools with the capacity for systemic delivery [5, 6] The purpose of this study was to monitor treatment effects of AAV mediated micro-dystrophin (μDys) gene therapy using MRI and MRS as a non-invasive biomarker.Methods
Male wild type C57BL/6J (ctrl; n=3) and mdx4cv (mdx; n=14) mice were utilized for the study. mdx (n=11) were treated with two different of AAV vectors, rAAV6-CK8-µDys1 (µDys1; n=5) and rAAV6-CK8-µDys2 (μDys 2; n=6) at 2 weeks of age with a dose of 4 x 10¹⁴ vg/kg. In-vivo skeletal MRI was performed on a 14 tesla (T) NMR spectrometer (Bruker Biospin, Billerica, MA) at 68 weeks of age. Mice were anesthetized using 3% isoflurane and maintained at 1% isoflurane and a mixture of air and oxygen at 3:1 ratio by using a vaporizer. The vertical bore of the magnet was maintained at 30oC to maintain thermo-neutrality of the animal and respiratory rate was monitored and maintained at 50-70 breaths/min by adjusting the anesthetic concentration. 1) Hindlimb MRI: (A) T1 weighted images were acquired with the following parameters: TR/TE 50/7 ms; field of view (FOV) = 15 x 15 x 15 mm3; matrix size= 256 x 192 x 96; NA = 2. (B) T2 weighted, multi-slice, multi-echo imaging (TR/TE = 4000/ 6 ~ 100 ms, 16 echoes) for transverse relaxation time T2 measurements. (C) Magnetization Transfer (MT) suppression ratios, or MT ratios (MTRs), were measured using the following ratio: (Si0 – Sis)/Si0, where Si0 represents the tissue signal intensity with no saturation pulse applied while Sis includes the saturation pulse. We utilized a gradient echo sequence (TR/TE = 939/5 ms, flip angle = 30°) with an off-resonance frequency of 5000 Hz and a saturation pulse of block pulse shape, 50 ms width, and 10 μT amplitude. 2) MRS: prior to MRS, a gradient echo sequence was used to acquire images with the following parameters: TR/TE = 668/4.5 ms, flip angle = 180o, NA =1, matrix = 128 × 128, FOV = 25.6 × 25.6 mm. The images were used to determine muscle volume, excluding bone and subcutaneous lipids, so that the nonlocalized 31P MRS measurements could be converted to units of average concentration. 31P MRS was conducted using a non-localized, pulse acquire sequence with the following parameters: TR = 20 sec, NA = 64, spectral width = 10,000 Hz, number of complex points = 2048, acquisition time = 21 min. Absolute quantification of 31P metabolites in hindlimb muscles was performed using the signal injection approach [7].Results and Discussion
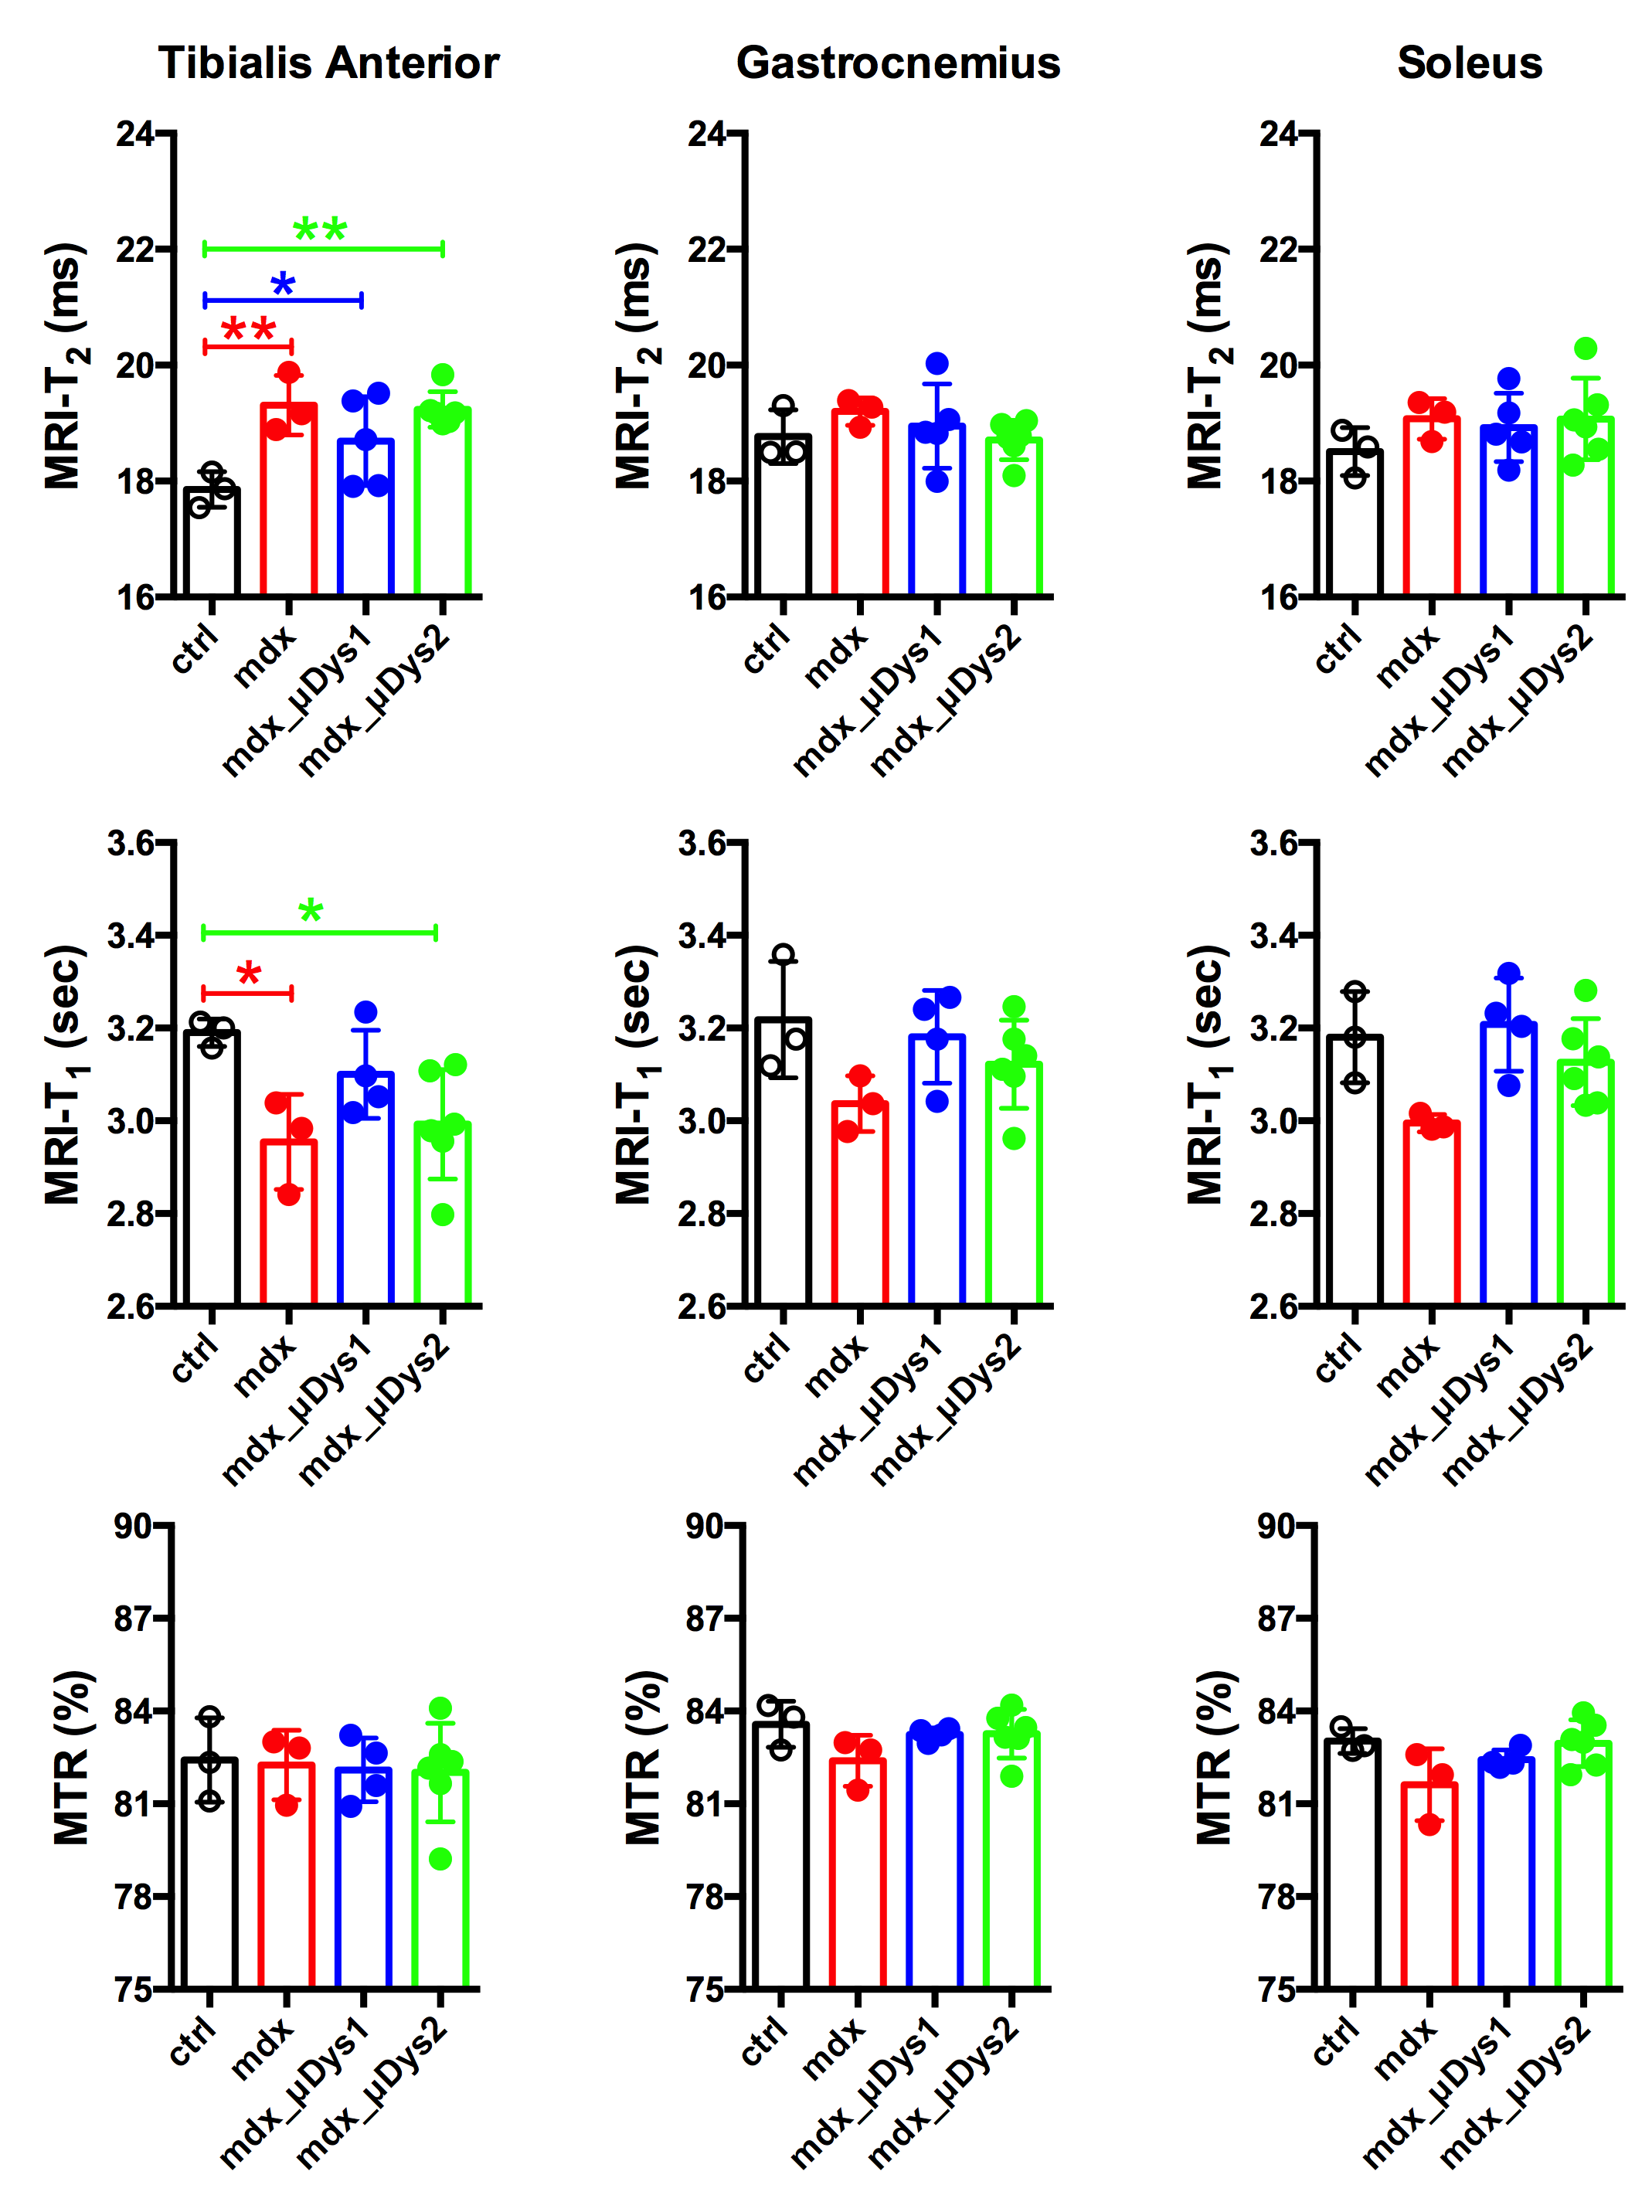
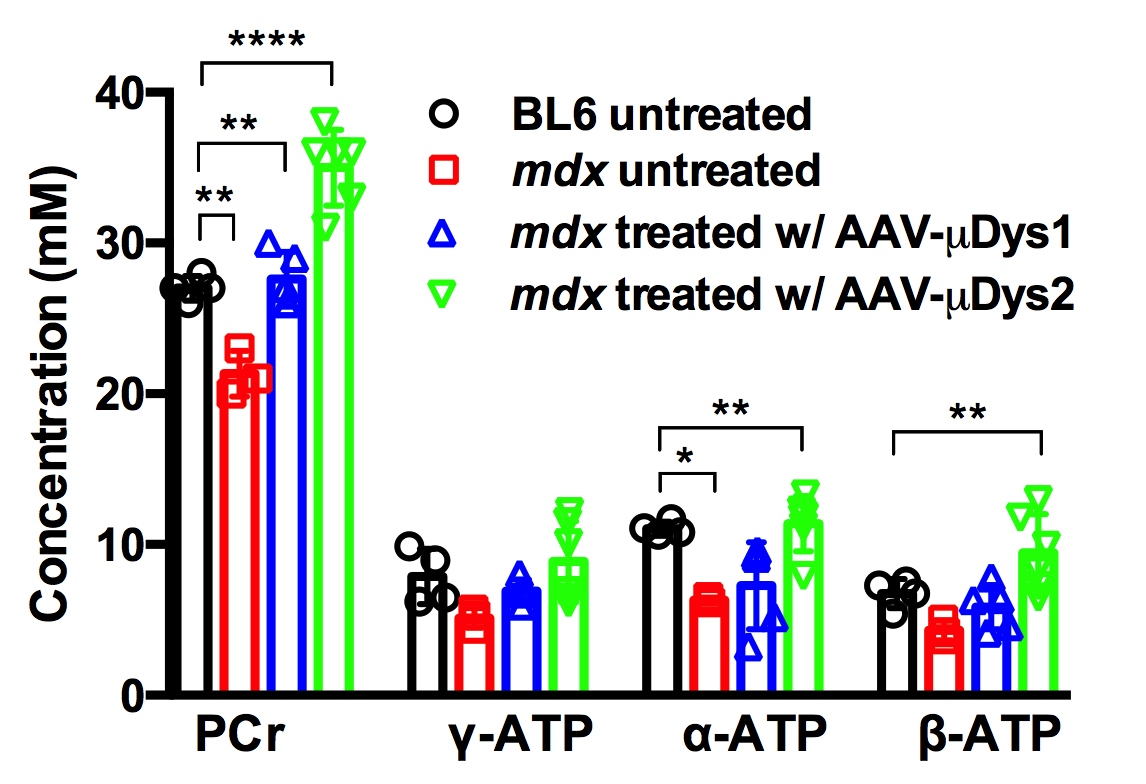
Figure 1 displays changes in T1, T2, and MTR for ctrl, mdx naiive and mdx treated with μDys. Tibialis Anterior (TA) muscle demonstrated higher T1 and T2 in mdx naiive and AAV-μDys treated mice compared to ctrl mice. T2 in TA demonstrated, on average, 4-7% increase in T2 despite AAV-μDys treatment. However, Gastrocnemius (GA), and Soleus (Sol) muscles did not demonstrate any difference in the T1, and T2 when comparing the mdx naiive against the control or AAV-μDys treated mice. Furthermore, MTR % did not show any difference in mdx naiive and mdx in AAV-μDys group. The advantage of MRI is its ability to monitor changes in multiple muscles at the same time. Measurements of T1 and T2 relaxation time constants in biological tissues offer a method to study the distribution and biophysical properties of water in-vivo. One of the reasons we did not see any difference between ctrl and mdx naiive mice is, perhaps, accumulation of fibrotic tissue in the dystrophic skeletal muscles, which inadvertently leads to decrease in muscle T2. However, MRS results from mdx naiive muscles demonstrated significantly lower PCr and ATP concentrations compared to ctrl untreated mice as shown in Figure 2. Finally, AAV-μDys treatment improved PCr and ATP levels in dystrophic mice. These observations and measurements could be further explored and validated with comparisons to histological measurements for a more nuanced understanding of the cellular change.Acknowledgements
This work is supported by NIH R01CA188654, NIH 2P50 AR065139, NIH R01 AR40864-27, and MDA 312455. We would like to thank Yasser Nazari for his assistance with data acquisition.References
1. Emery AE. The muscular dystrophies. Lancet. 2002;359(9307):687–95.
2. Rall S, Grimm T. Survival in Duchenne muscular dystrophy. Acta myologica: myopathies and cardiomyopathies: official journal of the Mediterranean Society of Myology / edited by the Gaetano Conte Academy for the study of striated muscle diseases. 2012;31(2):117–20.
3. Park J, Wicki J, Knoblaugh SE, Chamberlain JS, Lee D. Multi-Parametric MRI at 14T for Muscular Dystrophy Mice Treated with AAV Vector-Mediated Gene Therapy. PLoS ONE 2015 10(4).
4. Cole M.A, Rafael J.A, Taylar D.J, Lodi, R, Davies K.E, Styles, P. A quantitative study of bioenergetics in skeletal muscle lacking utrophin and dystrophin. Neuromuscul Disord, 2002. 12(3): p. 247-57.
5. Gregorevic, P., et al., Systemic delivery of genes to striated muscles using adeno-associated viral vectors. Nat Med, 2004. 10(8): p. 828-34.
6. Ramos JN, Hollinger K, Bengtsson NE, Allen JM, Hauschka SD and Chamberlain JS: Development of novel micro-dystrophins with enhanced functionality. Mol Ther 2019; 27:623-635.
7. Lee, D., Marro, K., Mathis, M., Shankland, E., Hayes, C. In vivo absolute quantification for mouse muscle metabolites using an inductively coupled synthetic signal injection method and newly developed (1) H/(31) P dual tuned probe. J Magn Reson Imaging. 2014;39(4):1039-1046.
Figures