2722
Short T2 Fraction Mapping of Skeletal Muscle Integrating Ultralow TE (UTE) and MP-IDEAL multiecho data1Physics, San Diego State University, San Diego, CA, United States, 2Physics, UC San Diego, La Jolla, CA, United States, 3Radiology, UC San Diego, La Jolla, CA, United States
Synopsis
Ultralow TE imaging of skeletal muscle enables the visualization of low T2* species. In skeletal muscle, the signal from the small fraction of short-T2 (T2S) components are masked by the larger component long-T2 (T2L) species. One method is to extract the short T2 components from subtracted images of a dual echo UTE sequence. However, the subtracted images invariably have residual signal from lipids due to the chemically shifted frequencies of signals produced by lipids. We integrate the fat fraction and T2L extracted from MP-IDEAL sequence to the subtracted UTE images to extract the fibrosis fraction.
Introduction:
Ultralow TE imaging that allows TEs lower than 0.1ms enables visualization of low T2* species in muscle. The short T2* tissues in muscle include tendon, cortical bone, fascia and the connective tissue at the level of the endomysium and perimysium. The latter two cannot be directly visualized due to the spatial resolution of MRI; however, in aging and dystrophies, these compartments can increase. Recently, a method for extracting fibrosis fraction from multiecho UTEs imaging was proposed where fat fraction and T2L were calculated from images acquired with TEs > 2.5ms using a dictionary-based approach1. However, the dictionary-based approach is computationally intensive and errors in the estimation of fat fraction and T2L propagate into the estimation of the short T2 fraction. Iterative Decomposition of water and fat with Echo Asymmetry and Least-squares estimation (IDEAL) is a 6-echo sequence based on 3D SPGR for lipid quantification that takes the multiple lipid resonances and yields fat fractions and R2L* maps. We propose a dual echo subtraction method using an alternate method to get the fat fraction and T2L from an (multipoint) MP-IDEAL2 sequence instead of a dictionary-based approach to extract the fibrosis fraction in skeletal muscle.Methods:
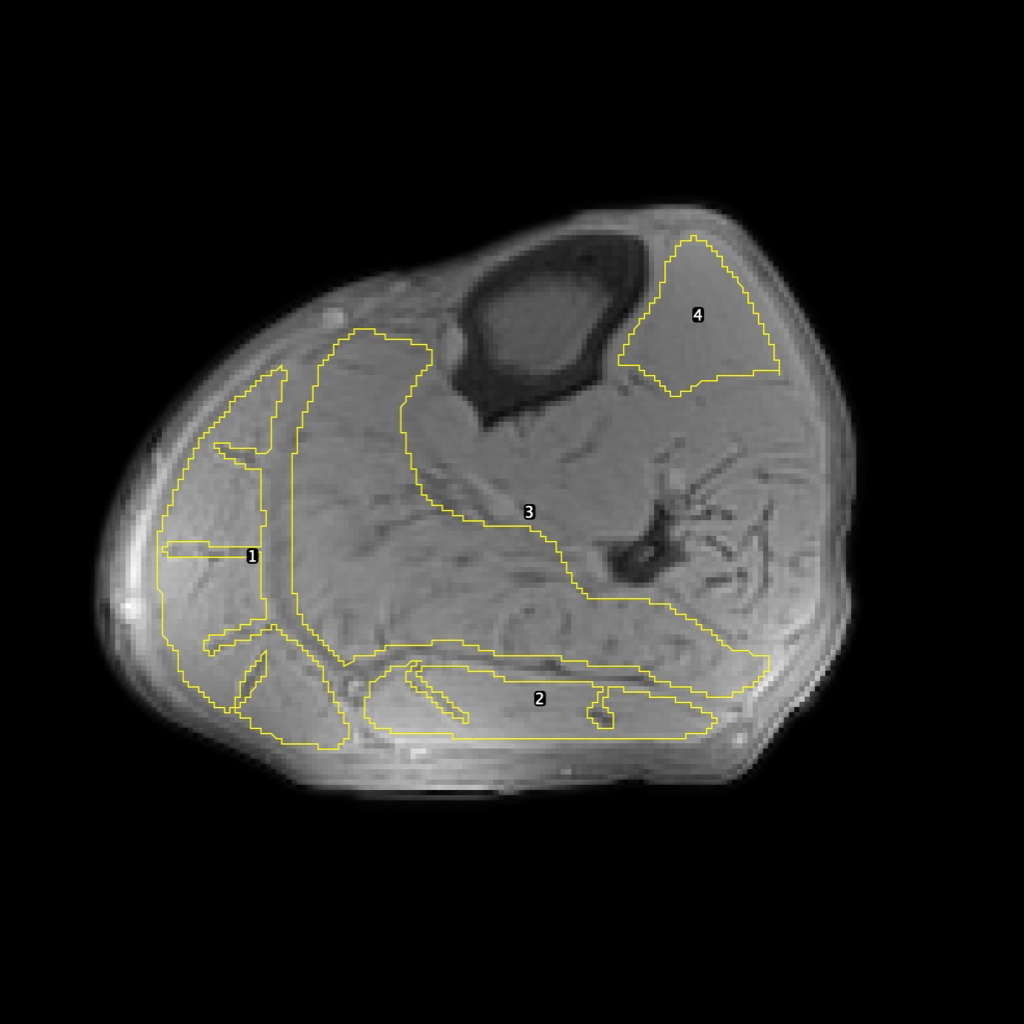
The imaging studies were performed on a GE 3T scanner on 6 young (27 ± 3 years), 6 senior (65 ± 4 years) subjects after obtaining IRB approved informed consent. Images of the calf muscle were acquired using a flexible coil with the dominant leg resting in a leg holder. The 3D MP-IDEAL sequence and 3DCONES (UTEs) were used to acquire geometrically matched sequences. The 3D UTE Cones sequence employed a short radio frequency (RF) rectangular pulse (duration = 26 – 52 μs) for signal excitation, followed by 3D spiral trajectories sampled on the CONES with a minimal nominal TE of 32μs 3. Sequence parameters are MP-IDEAL (TE: 6-echoes, TR: 13.64ms, FA = 5°; FOV: 200mm, 256×256 Matrix, 5mm slice thickness) and 3D CONES (TEs: 0.032, 2.3, 5, 7, 9.6ms, TR: 49ms; FA=5°; FOV: 200mm, 128×128 Matrix, 5mm slice thickness). Five lipid resonances were modeled using data from Ref. 1 (Table 1). The first two images of the UTEs were processed as follows to extract the connective tissue fraction (Ref. 1): $$\dfrac{\left| S_0 \right|}{E_0^L} - \dfrac{\left| S_1 \right|}{E_1^L} = \left| C \right| \left( \dfrac{E_0^S}{E_0^L} - \dfrac{E_1^S}{E_1^L} \right) + \left|F\right| \times \left(\left| f_0\right| - \left| f_1\right|\right) \qquad [\mathrm{Eq.} 1]$$ where $$$S_0$$$ is the signal intensity of the TE = 0.032ms, and $$$S_1$$$ that at TE = 2.3ms; $$$F$$$, and $$$C$$$ are the magnetizations of the fat and short T2 components at t = 0ms; $$$f(t)$$$ takes into account the multiple lipid resonances: $$ f(t) = \sum\limits_{k} \rho_k \cdot e^{i\omega_kt} \qquad [\mathrm{Eq.} 2]$$ Table 1 provides the relative abundance, $$$\rho_k$$$ and the resonance frequency offsets, $$$\omega_k$$$; $$E_n^S, E_n^L \equiv e^{-t_n/\mathrm{T2^S}}, e^{-t_n/\mathrm{T2^L}} \qquad [\mathrm{Eq.} 3]$$ T2L and fat fraction maps from the IDEAL-IQ are used to calculate the short T2 fraction as: $$\dfrac{\left| S_0 \right|}{E_0^L} - \dfrac{\left| S_1 \right|}{E_1^L} - \left|F\right| \times \left(\left| f_0\right| - \left| f_1\right|\right) = \left| C \right| \left( \dfrac{E_0^S}{E_0^L} - \dfrac{E_1^S}{E_1^L} \right) \equiv \hat{C} \qquad [\mathrm{Eq.} 4.1]$$ and $$\hat{C} \times E_0^L / \left| S_0 \right| \equiv \hat{C}_{frac} \qquad [\mathrm{Eq.} 4.2]$$ The entire muscle was delineated for different muscle compartments taking care to avoid the intermuscular fascia as well as intermuscular fascicles and regions of gross fat infiltration (the latter two structures appear dark on the late UTE images). The same ROI was used to obtain values from the fat fraction map and the R2* map of the MP-IDEAL sequence. These values were used in Equation 2 and 3 to obtain the normalized short T2 fraction.Results:
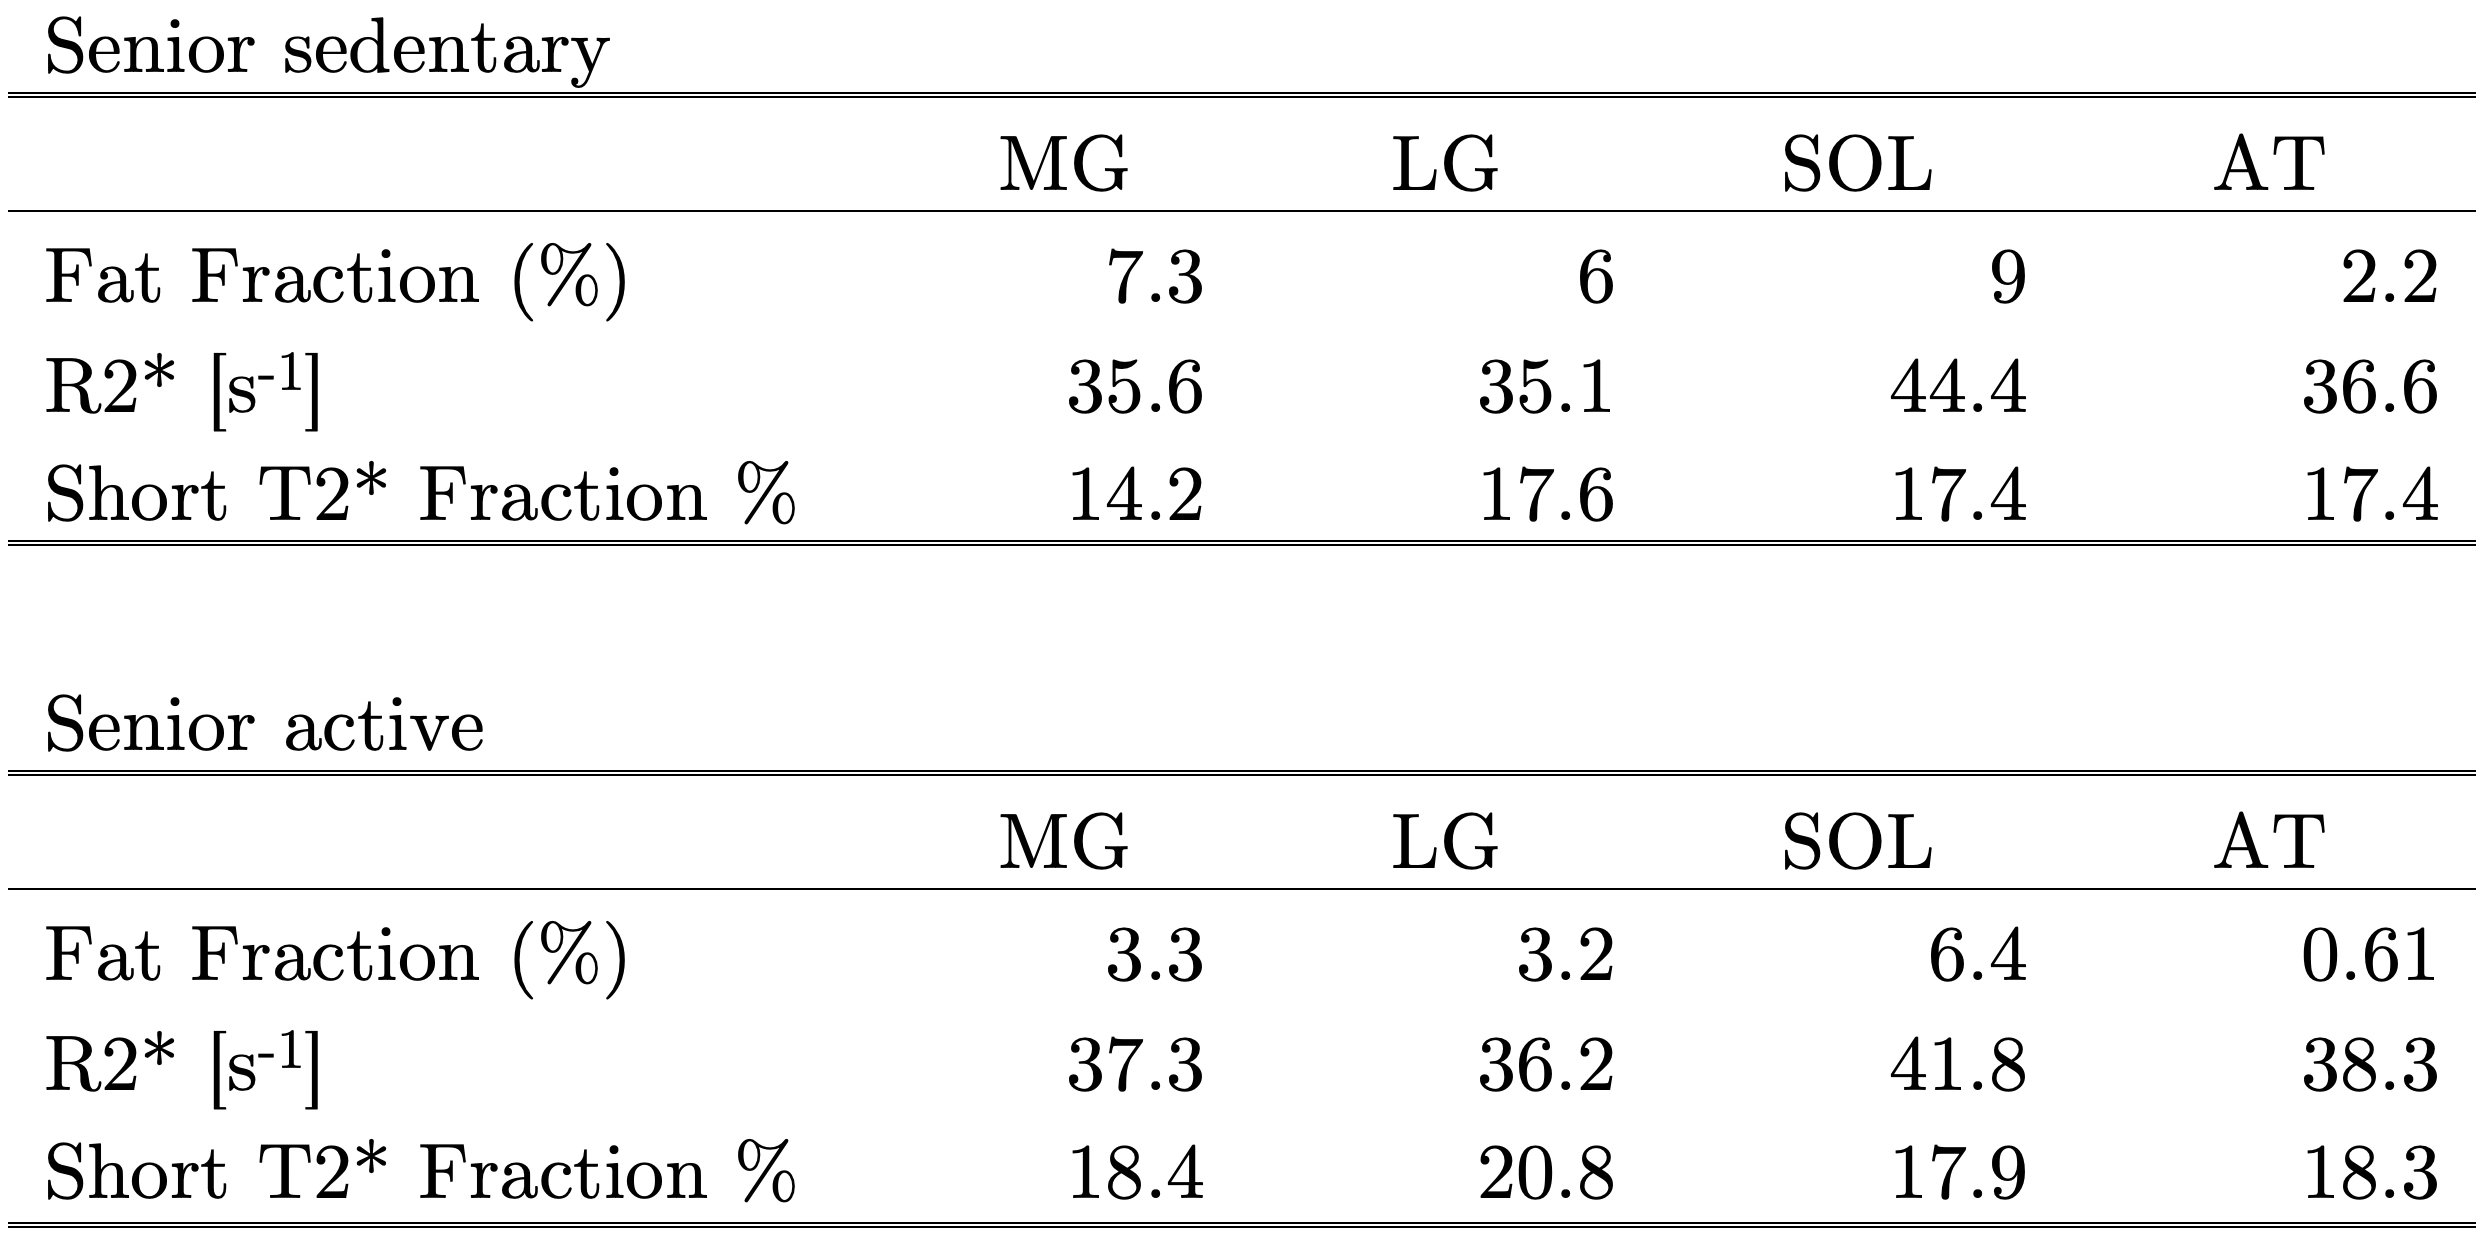
Figure 1 shows images at a single level from the first two echoes of the UTEs data and the corresponding images from the MP-IDEAL. Table 2 lists the fat fraction, R2L* and short T2 fraction for a subject from the senior cohort (active and sedentary) for the medial gastrocnemius, soleus, lateral gastrocnemius, tibialis anterior (Fig. 2). An increase in fat fraction but no change in short T2 fraction was seen in the sedentary seniors.Discussion
It is difficult to extract the short T2 fraction from UTE images due to the confounding signal from the multiple resonance of lipids. MP-IDEAL is currently the most accurate method for lipid quantification as it also takes into account the multiple lipid resonances and is usually part of the protocol to characterize muscle. The current work successfuly uses fat fraction and T2L from the IDEAL-IQ sequence to extract the short T2 fraction from dual echo UTEs images. It should be noted that in skeletal muscle the source of the short T2 signal fraction is not yet identified. The low signal of fasciae indicates that collagen may be the source of the short T2 signal fraction in the endomysium and perimysium as well. If that is experimentally verified, then the short T2 fraction can be used as a measure of fibrosis.Conclusions
We have demonstrated that dual echo UTEs combined with fat fraction and T2L from the IDEAL sequence can yield accurate short T2 fraction in skeletal muscle.Acknowledgements
This work was supported by the National Institute of Arthritis and Musculoskeletal and Skin Diseases Grant R01AG056999-01References
[1] Araujo ECA, et al. Magn Reson Med. 2017;78:997-1008.
[2] Yu H, et al. Magn Reson Med. 2008; 60:1122-1134
[3] Carl M, et al. Magn Reson Med. 2016; 76:577-582.
Figures
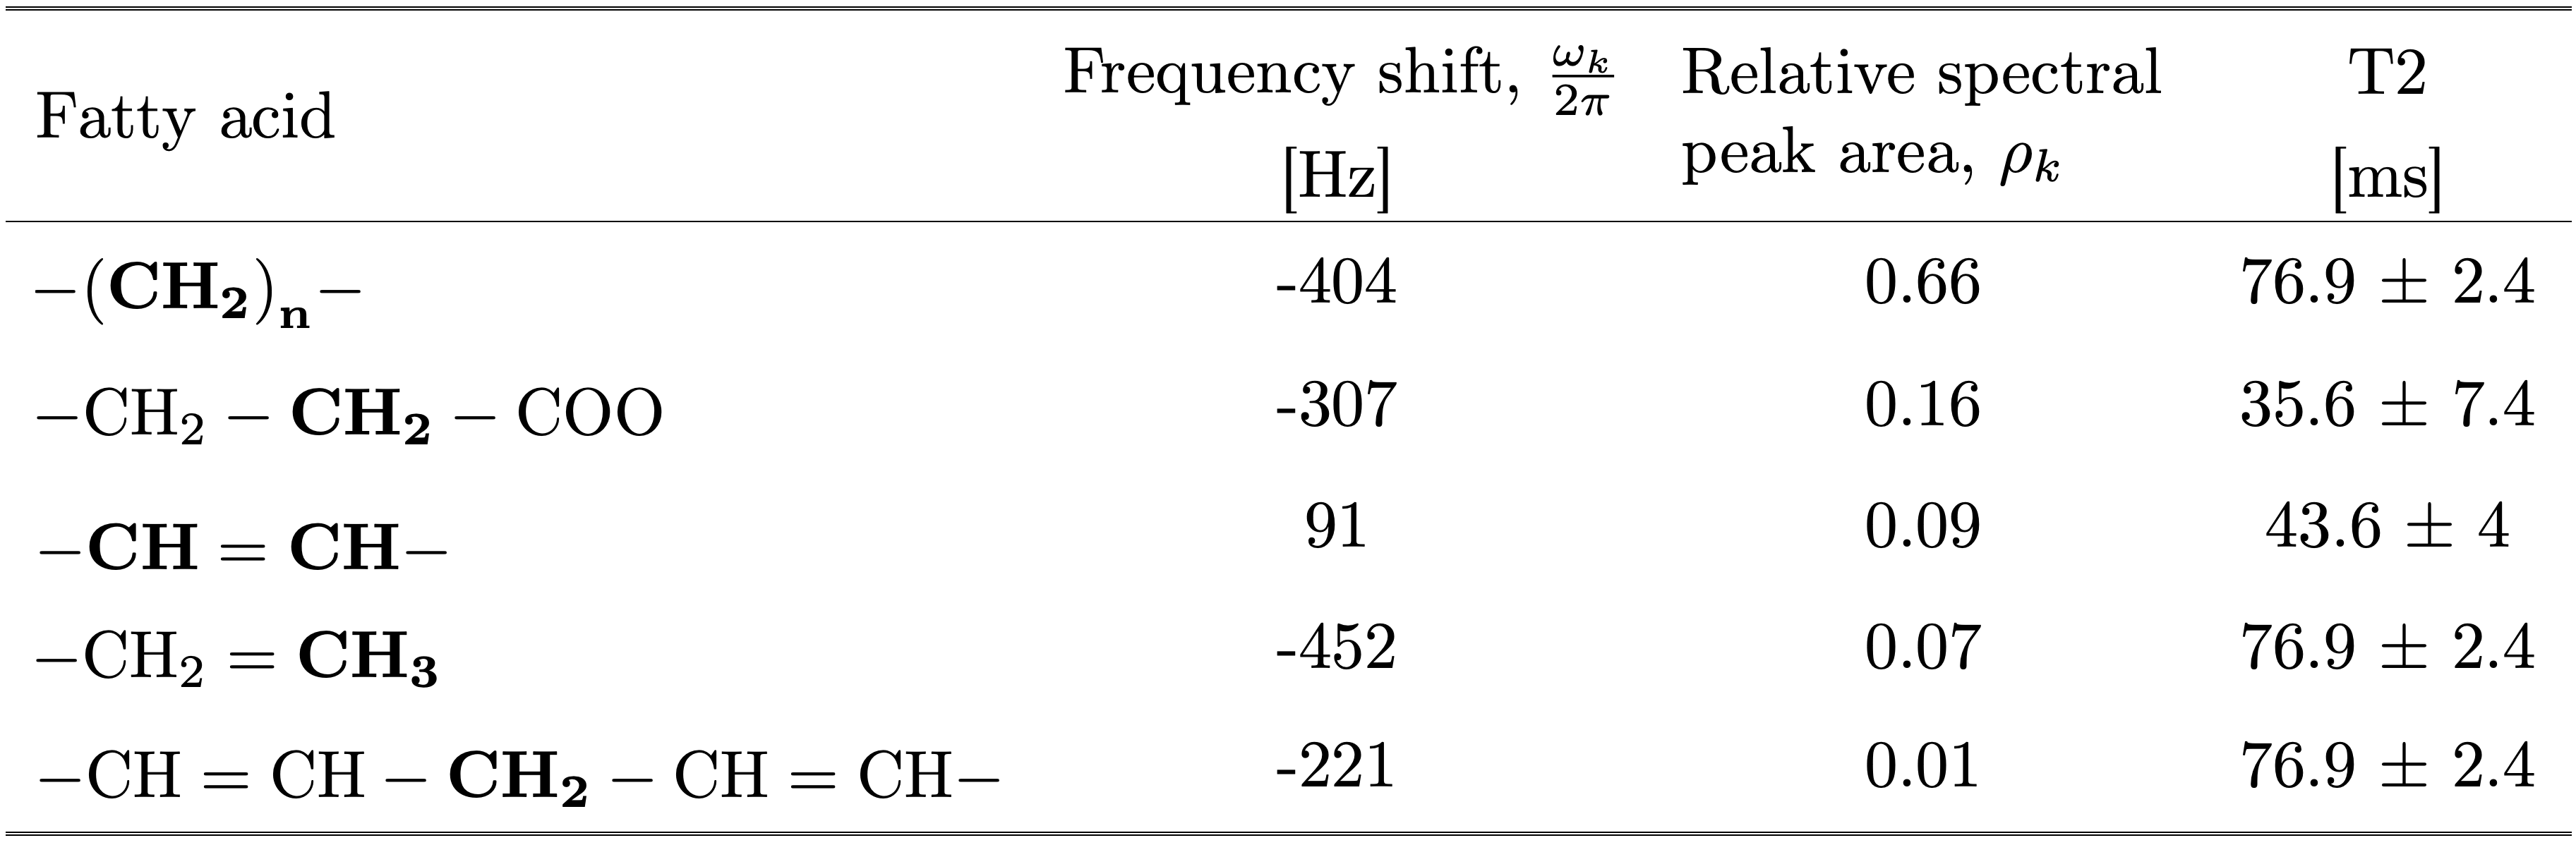
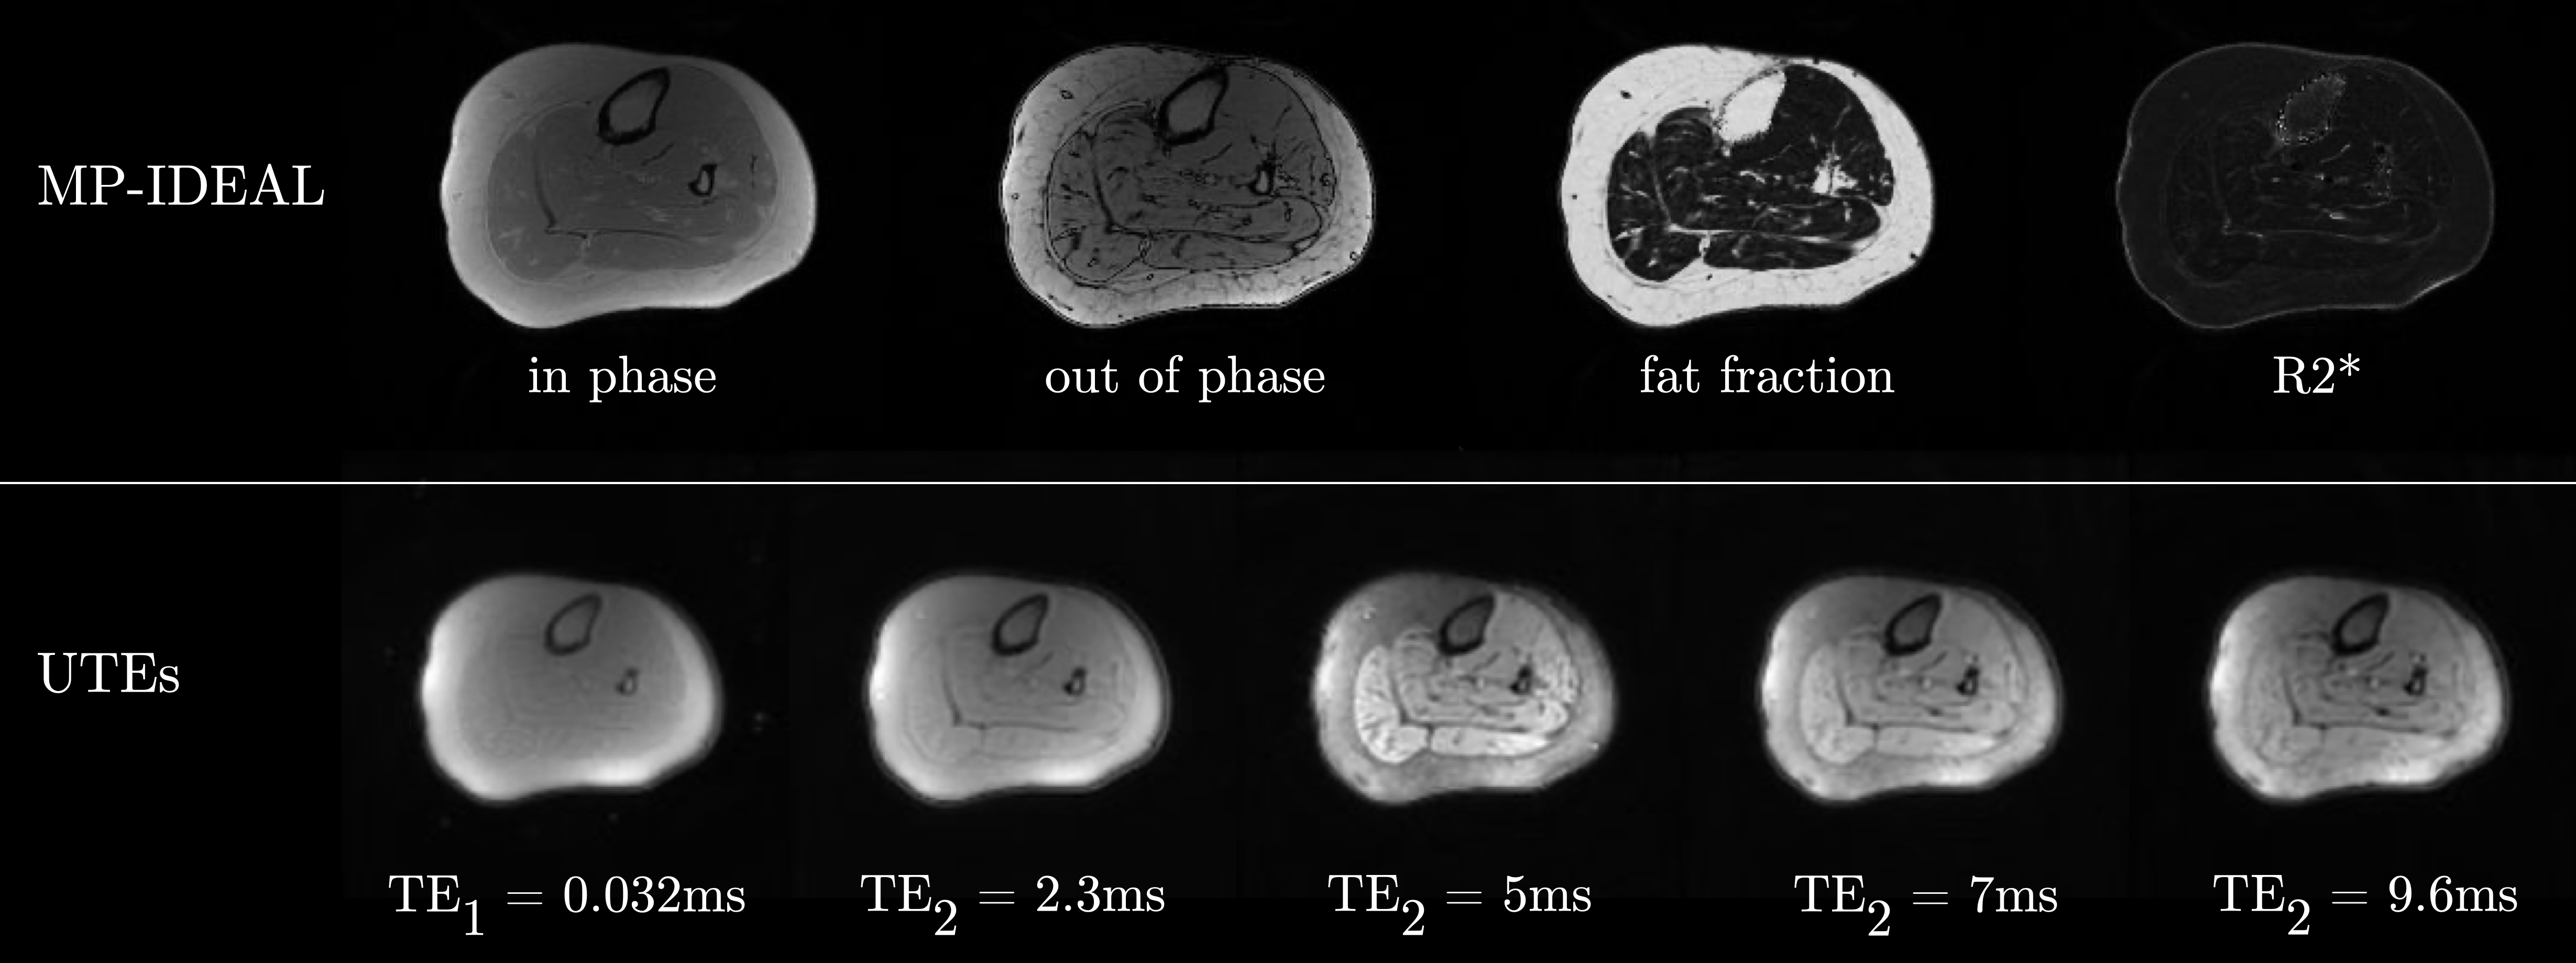
Figure 1: Top row: Images from the MP-IDEAL sequence (L-R: in phase, out-phase, fat fraction and R2* images). Bottom row: Images from the multi-echo UTEs (L-R: 0.032 ms, 2.3 ms, 5ms, 7 ms, 9.6ms)