2720
Differences between inflammatory and dystrophic myopathies revealed by the multi-exponential behavior of water-T2 decays in skeletal muscle1NMR Laboratory, Neuromuscular Investigation Center, Institute of Myology, Paris, France, 2NMR Laboratory, CEA/DRF/IBFJ/MIRCen, Paris, France
Synopsis
Although sensitive to disease activity, the mono-exponential muscle water T2 is non-specific to the underlying dominant pathophysiological processes taking place in the different neuromuscular disorders. In this work we performed multi-exponential analysis of muscle water T2-relaxation data acquired in healthy subjects, Duchenne Muscular Dystrophy and Inclusion Body Myositis patients. T2-decay curves were obtained using 1H NMR spectra acquired at different echo times. The results put in evidence a distinct water T2-relaxation behavior between inflammatory and dystrophic myopathies, supporting the hypothesis that a multi-exponential analysis of T2-relaxation data can reveal specific pathophysiological information that is missing from mono-exponential analysis.
Introduction
NMR is a largely exploited tool in clinical studies in the field of neuromuscular disorders. Increased mono-exponential water T2 (T2w) in skeletal muscle is a marker of different pathophysiological processes such as inflammation, edema, cellular membrane disruption or alterations of histological water compartmentation1,2. However, the T2-relaxation of water signals in skeletal muscle is known to be characterized by a multi-exponential behavior which probably reflects the histological compartmentation of water in the tissue3. We hypothesize that a multi-exponential analysis of the water T2-relaxation could provide disease activity markers that are specific to the underlying pathophysiological process2. In the present work we investigate the multi-exponential behavior of the muscle water T2-relaxation in inflammatory and dystrophic myopathies, obtained from 1H NMRS data.Methodology
NMR examinations were performed on 3T (Trio and Prisma, Siemens) clinical scanners. Data were acquired in the leg (Gastrocnemius Med. or Tibialis Ant. or Soleus) using a 15-channel volume transceiver knee coil or in the thigh (Vastus Lat. or Vastus Med. or Rectus femoris or Sartorius) using the body coil transmitter and an 18-channel surface coil receiver. The cohort included 114 Inclusion Body Myositis (IBM) patients, 30 Duchenne Muscular Dystrophy (DMD) patients and 55 control subjects. Single voxel (STEAM) 1H NMR spectra were obtained at 14 echo times (TE=20/27/36/45/54/63/81/90/108/135/162/198/243/288 ms) with the frequency centered to the water resonance (4.7 ppm). Other relevant parameters were: TR=6500ms, TM=10ms and 4 averages. VOI’s sizes ranged between 15x15x15 mm3 and 20x20x20 mm3 and care was taken to avoid the inclusion of visible blood vessels. Automatic three-dimensional map shim and further interactive "manual" shimming were performed. 1H NMR spectra were processed in jMRUI. All spectra were aligned with the water frequency at 4.7 ppm, followed by Lorentzian apodization and zero order phasing if necessary. Using the AMARES algorithm, the water and up to six lipid resonances were fitted, adding prior knowledge for frequencies, phases, linewidths and lineshapes (Lorentzian). The T2-relaxation curves were obtained by plotting the water peak area at each TE. Mono- and bi-exponential models were fitted to the data using non-negative least squares (Matlab, Mathworks). For each decay curve, the best adapted model was determined by comparing the adjusted R2 of both fits. This process allowed to separate the data into two sets: the monoexp set which regroups the data presenting a mono-exponential behavior; and a biexp set which regroups data presenting a bi-exponential behavior. Kruskal-Wallis tests were performed for comparing the extracted mono- and bi-exponential parameters between the three groups of subjects. First, the comparisons included all data for both models. Then the comparisons of the mono- and bi-exponential parameters were performed within the corresponding monoexp and biexp sets, respectively.Results
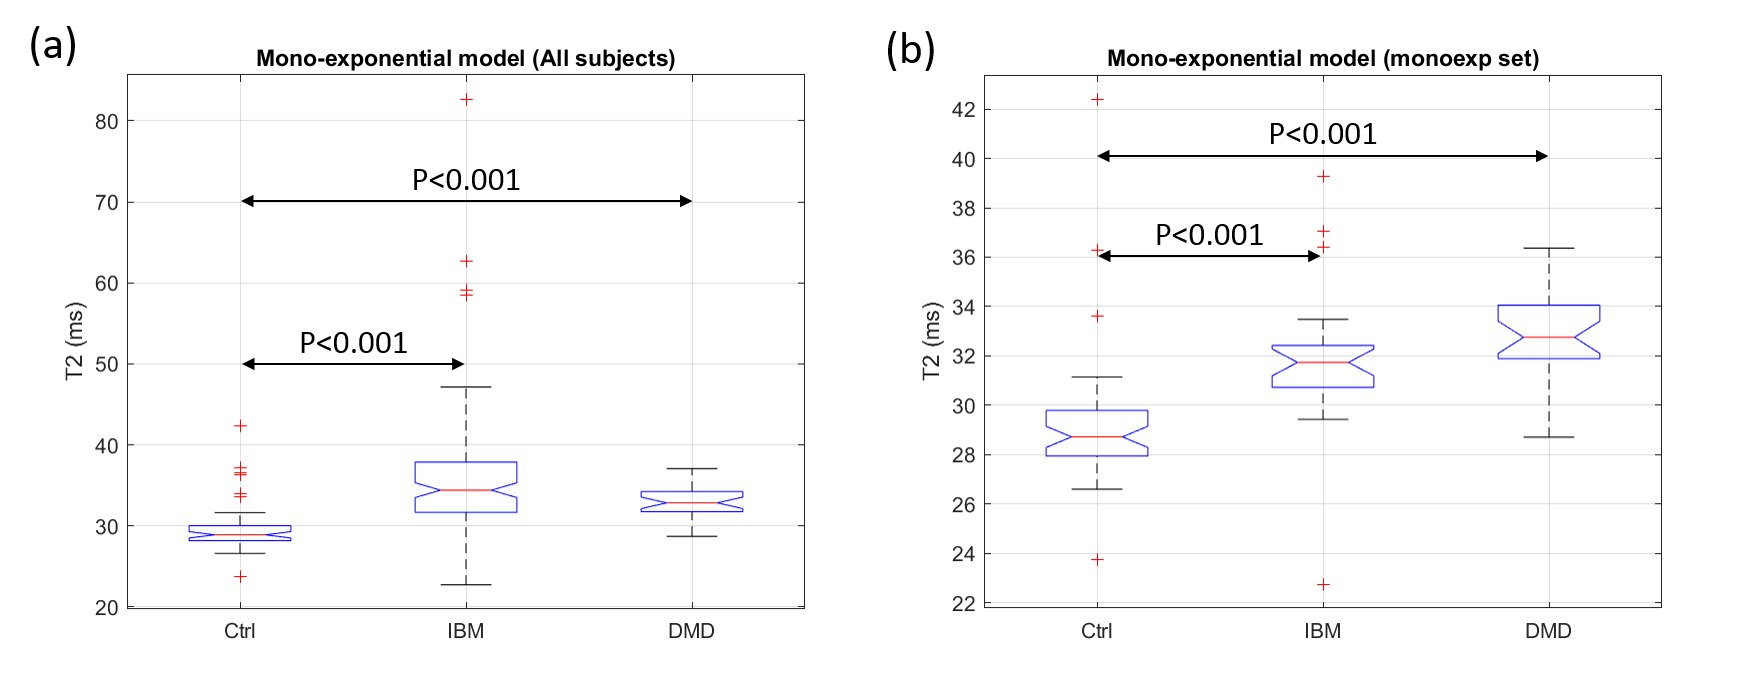
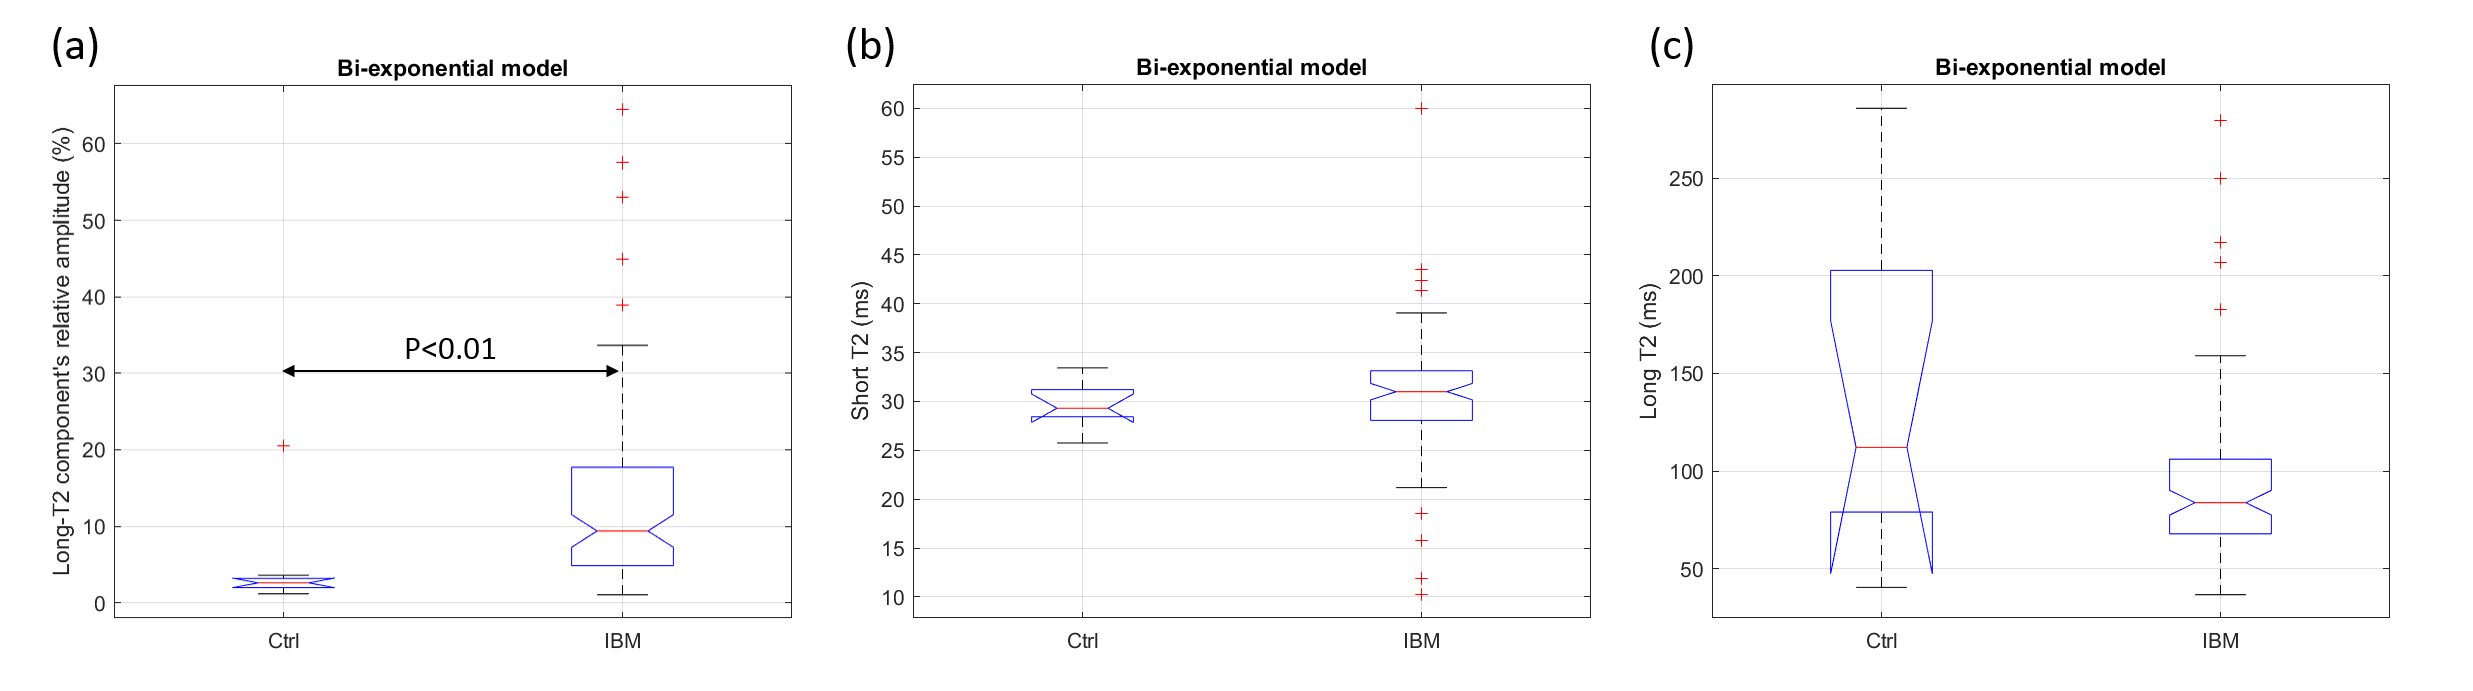
The percentages of data that are better represented by mono- and bi-exponential models in IBM patients were significantly different from those observed in the DMD and control groups (p<0.001, Chi-square test). In the control and DMD groups, 84% (46 out of 55) and 90% (27 out of 30) of the data, respectively, were better represented by a mono-exponential model, while 79% (90 out of 114) of the data from the IBM group were better represented by a bi-exponential model. Significant differences (p<0.001) of T2w obtained from mono-exponential fitting were observed between controls and patients in both comparisons (including all subjects or within the monoexp set) (Fig. 1). Concerning the bi-exponential results, for the data in the monoexp set, the results were meaningless, either presenting two identic T2 values or negligible long-T2 relative fractions (<1%) with extremely large confidence intervals for the long-T2 value (>1000ms). For this reason the comparisons were restricted to subjects in the biexp set. IBM patients were characterized with an abnormally high relative fraction of the long-T2 component (13±1% against 4±4% in controls, p<0.01) (Fig. 2-a). No significant differences were observed on the extracted T2 values between the IBM and controls (Figs. 2-b and 2-c). The DMD group was excluded from the statistical analysis of the bi-exponential parameters due to low statistical power (only 3 subjects in the biexp set).Discussion and Conclusion
Although mono-exponential T2w has been once again confirmed as a marker of disease activity, it was unable to separate between DMD and IBM patients. On the other hand, the multi-exponential analysis put in evidence a distinct behavior of the T2-decays between the DMD and IBM groups, which probably reflects the distinct pathophysiological processes taking place in dystrophic (DMD) and inflammatory (IBM) myopathies. This result supports the hypothesis that a multi-exponential analysis of T2-relaxation data might reveal specific pathophysiological information that are missing from mono-exponential analysis and from standard T2-mapping methods, which usually assume a mono-exponential behavior for muscle water T2-relaxation4,5.Acknowledgements
No acknowledgement found.References
1. Carlier PG, Marty B, Scheidegger O, Loureiro de Sousa P, Baudin P-Y, Snezhko E, et al. Skeletal Muscle Quantitative Nuclear Magnetic Resonance Imaging and Spectroscopy as an Outcome Measure for Clinical Trials. Vol. 3, Journal of Neuromuscular Diseases. IOS Press; 2016.
2. Araujo ECA, Carlier PG. Significant alterations on T2-spectra observed in the calf of myopathic patients. In: Proc 23rd ISMRM, Toronto, Canada. 2015.
3. Araujo ECA, Fromes Y, Carlier PG. New Insights on Human Skeletal Muscle Tissue Compartments Revealed by In Vivo T2 NMR Relaxometry. Biophys J. 2014;106(10):2267–74
4. Azzabou N, Loureiro de Sousa P, Caldas E, Carlier PG. Validation of a generic approach to muscle water T2 determination at 3T in fat-infiltrated skeletal muscle. J Magn Reson Imaging. 2015;41(3):645–53.
5. Marty B, Baudin P-Y, Reyngoudt H, Azzabou N, Araujo ECA, Carlier PG, et al. Simultaneous muscle water T2 and fat fraction mapping using transverse relaxometry with stimulated echo compensation. NMR Biomed. 2016;29(4):431–43.
Figures