2718
Metabolic Imaging of Skeletal Muscle in Aging Rats: Potential for improving muscle metabolism with Rapamycin
Rengaraj Anantharaj1, Jadegoud Yaligar1, Giang Thi Thu Le1, Venkatesh Gopalan1, Sanjay Kumar Verma1, Kavita Kaur1, Kasthuri Thirumurugan2, Johan G Eriksson2,3, Brian Kennedy4, and S Sendhil Velan1,2
1Laboratory of Molecular Imaging, Singapore Bioimaging Consortium, A*STAR, Singapore, Singapore, 2Singapore Institute for Clinical Sciences, A*STAR, Singapore, Singapore, 3Department of Obstetrics & Gynecology, National University of Singapore, Singapore, Singapore, 4Center for Healthy Aging, National University of Singapore, Singapore, Singapore
1Laboratory of Molecular Imaging, Singapore Bioimaging Consortium, A*STAR, Singapore, Singapore, 2Singapore Institute for Clinical Sciences, A*STAR, Singapore, Singapore, 3Department of Obstetrics & Gynecology, National University of Singapore, Singapore, Singapore, 4Center for Healthy Aging, National University of Singapore, Singapore, Singapore
Synopsis
Aging associated loss of muscle mass leads to metabolic diseases and compromised quality of life. Increase in intramyocellular lipid (IMCL) and reduced skeletal muscle mass are associated with insulin resistance and diabetes. Rapamycin increases muscle mass by inhibiting the mTOR signalling pathway. In this study, we investigated IMCL metabolism and muscle mass in response to rapamycin intervention in an aging rodent model. We observed significant reduction in IMCL along with increase in muscle mass indicating improved muscle metabolism with rapamycin intervention. Muscle differentiation gene, MyoD was upregulated and myostatin which is negative regulator of muscle growth factor was down regulated.
Introduction
Aging is associated with loss of skeletal muscle mass or Sarcopenia. Muscle tissue is critical for glucose disposal and loss of muscle mass may contribute to the development and progression of type 2 diabetes through compromised glucose disposal and with accumulation of intramyocellular lipid (IMCL)1. Interventions increasing muscle mass and reducing IMCL are of great clinical interest both in relation to aging and diabetes. Rapamycin increases muscle mass and extends the life span of mice by inhibiting the mechanistic target of rapamycin (mTOR) signalling pathway2.Animals and Methods
Twelve months old, male Wister rats (n=10) maintained on chow diet were randomized into group 1 (vehicle, n=5) and group 2 (Rapamycin, n = 5). Rapamycin at a concentration of 20 mg/ml, in ethanol was resuspended in vehicle (0.25% PEG, 0.25% Tween-80) at a final concentration of 4 mg/ml, and administered (8 mg/kg BW, route i.p) on alternative days for 2 weeks. MR imaging/spectroscopy was performed using a 9.4T Bruker BioSpec (Bruker, Germany, ParaVision 6.0.1). A 72-mm transmit /receive volume coil and a phase array receive-only coil was utilized for all the experiments. Anatomical imaging was performed by high resolution gradient-echo 3D T1 weighted imaging with TR of 6.2 ms; TE of 2.46 ms; FOV with 78 ×78 mm2; matrix size 256 × 256; 30 slices with 1 mm thickness. 3D multi-echo (6 echoes) GRE sequence was utilized for fat-water imaging with repetition time TR 11 ms, TE’s (1.28, 1.47, 1.66, 1.85, 2.04 and 2.23 ms); flip angle 40, field of view, 78 × 78 mm2; matrix size 256 × 256; 30 slices with 1 mm thickness. A water suppressed localized spectrum from tibialis anterior muscle was obtained using PRESS sequence with TR /TE 4000/17.08 ms, voxel volume 3.5 × 3.5 × 3.5 mm3, averages 256. A water unsurpassed spectrum was collected from the same voxel. Muscle volumes were estimated by manual segmentation of high resolution images using ITK-SNAP3. IMCL was quantified by processing the MRS data using LC-model4. After the terminal MR imaging, oral glucose tolerance test was performed on all animals. Relative mRNA expression of MyoD and Myostatin levels were estimated RT-PCR.. Haematoxylin (H) and eosin (E) staining was performed on 5µm tissue sections of tibialis anterior muscle tissue. Results were compared between vehicle and rapamycin groups and statistical significance was calculated by welch’s t test. Statistical significance (P < 0.05) was calculated between two groups.Results and Discussion
Figure 1 shows body weight in the vehicle and rapamycin treated groups. The rapamycin group showed significant reduction in body weight after 2 weeks of intervention (P < 0.01). Figure 2A shows increased (P < 0.01) postprandial glucose concentrations in the rapamycin group indicating impaired glucose-stimulated insulin release. Earlier studies have also shown that rapamycin negatively impacts glucose stimulated insulin release by pancreatic beta cells in C57BL/6 mice5. Plasma triglycerides (Figure 2B) were significantly (P < 0.01) reduced in the rapamycin group compared to the vehicle treated group. Figure 3 shows the representative T1 weighted coronal images from skeletal muscle of vehicle (A) and rapamycin treated animals. Figure 3B shows the segmented muscle volumes for both groups. The muscle volume increased significantly (P < 0.01) in the rapamycin treated group. Rapamycin, inhibits the mTOR signalling pathway and improved/increases the skeletal muscle volumes6. Figure 4A shows the skeletal muscle IMCL measured from tibialis anterior compartment for both vehicle and rapamycin treated groups. The IMCL is significantly (P < 0.05) reduced in rapamycin treated animals compared to vehicle group. Reduction in IMCL and increase in muscle mass with rapamycin indicates the enhanced lipid utilization due to expansion of muscle mass. Figure 4B shows the IMCL levels before intervention (day 0) and after two weeks of intervention. Increase in muscle volume and muscle fibres in the rapamycin group is further confirmed by H & E stained sections (Figure 5A). Figure 5B shows the mRNA analysis of muscle markers MyoD (P < 0.05) and myostatin (P < 0.05). Muscle differentiation marker MyoD is increased in the rapamycin group supporting improved muscle differentiation7. In aging, myostatin is known to inhibit muscle differentiation8. In the rapamycin treated group myostatin levels were significantly reduced promoting muscle differentiation.Conclusions
Rapamycin treatment significantly increased muscle mass along with reduction in IMCL, body weight and plasma triglycerides. Increased postprandial glucose in rapamycin treated group is due to impaired glucose-stimulated insulin release9. Increased myogenic differentiation marker MyoD in the rapamycin group is positively associated with functional effects of the skeletal muscle in aged rats. Reduction of myostatin is in agreement with increased muscle volumes in the rapamycin treated group. Further studies are required to evaluate effect of rapamycin on glucose-insulin metabolism.Acknowledgements
No acknowledgement found.References
- Cleasby ME et al Insulin resistance and sarcopenia: mechanistic links between common co-morbidities J Endocrinol. 2016 May;229(2): R67-81.
- Kennedy BK et al Rapamycin reverses elevated mTORC1 signaling in lamin A/C-deficient mice, rescues cardiac and skeletal muscle function, and extends survival Sci Transl Med. 2012 Jul 25;4(144):144ra103.
- Paul A. Yushkevich, Joseph Piven, Heather Cody Hazlett, Rachel Gimpel Smith, Sean Ho, James C. Gee, and Guido Gerig. User-guided 3D active contour segmentation of anatomical structures: Significantly improved efficiency and reliability. Neuroimage 2006 Jul 1;31(3):1116-28.
- Provencher SW. Automatic quantitation of localized in vivo 1H spectra with LCModel. NMR Biomed. 2001; 14:260-264.
- Yang SB, Lee HY, Young DM, Tien AC, Rowson-Baldwin A, Shu YY, Jan YN, Jan LY (2012) Rapamycin induces glucose intolerance in mice by reducing islet mass, insulin content, and insulin sensitivity. J. Mol. Med. (Berl) 90, 575–585.
- Mee-Sup Yoon, mTOR as a Key Regulator in Maintaining Skeletal Muscle Mass Front Physiol. 2017; 8: 788.
- Jeff Ishibashi et al, MyoD induces myogenic differentiation through cooperation of its NH2- and COOH-terminal regions J Cell Biol. 2005 Nov 7; 171(3): 471–482.
- Langley B et al, Myostatin inhibits myoblast differentiation by down-regulating MyoD expression J Biol Chem. 2002 Dec 20;277(51):49831-40.
- Lamming DW et al, Young and old genetically heterogeneous HET3 mice on a rapamycin diet are glucose intolerant but insulin sensitive Aging Cell. 2013 Aug;12(4):712-8.
Figures

Figure 1. Body weight curves of
animals treated with rapamycin and vehicle. Body weight is significantly (P
< 0.01) decreased in rapamycin treated animals.

Figure 2. Plasma glucose (P < 0.01) (A) and triglycerides (P < 0.01) (B) for vehicle and rapamycin groups.

Figure 3.
Anatomical images of skeletal muscle from vehicle and rapamycin treated animals
(A). Volumetric measurements of skeletal
muscle volumes for vehicle and rapamycin treated groups (B). Skeletal muscle
volume in rapamycin treated animal is significantly increased (P <
0.05)
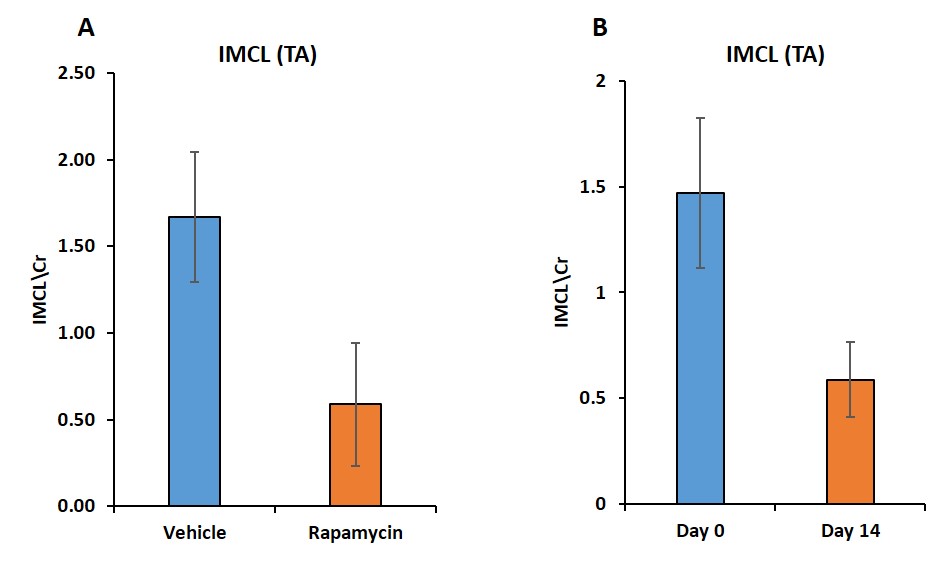
Figure
4. Skeletal muscle IMCL (P < 0.05) (A) from tibialis anterior compartment of vehicle and
rapamycin treated groups. Figure 4B
shows the change in IMCL levels in rapamycin group after two weeks intervention.
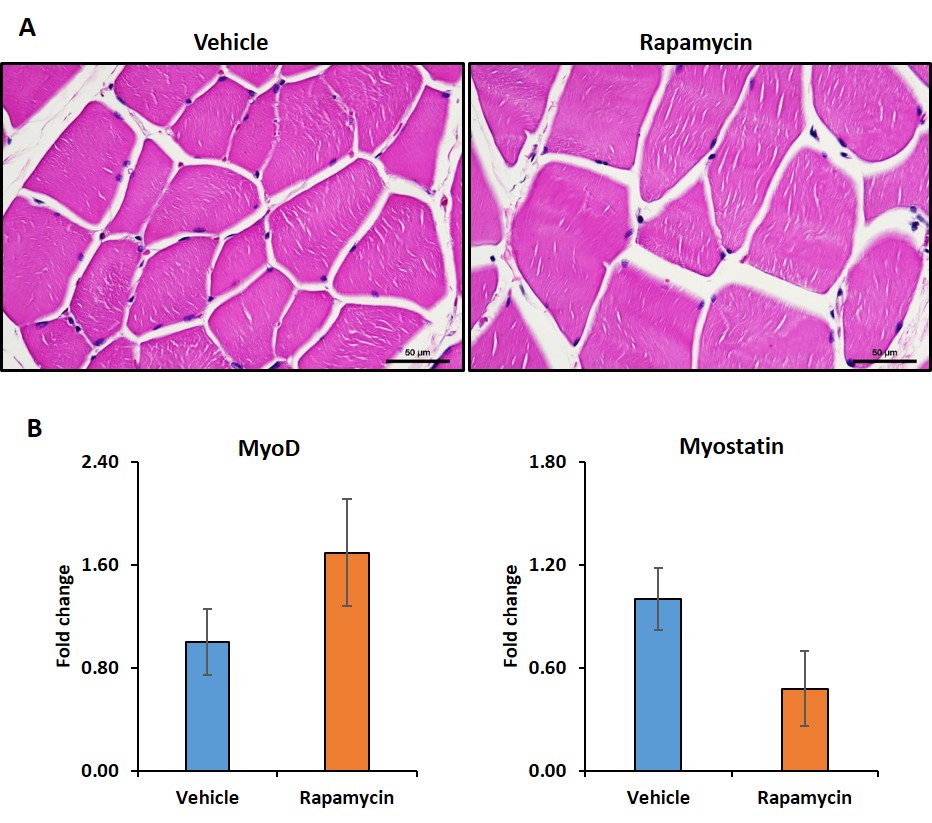
Figure 5.
Hematoxylin and eosin stained images from tibialis anterior compartment of vehicle
and rapamycin groups (A). MyoD (P < 0.05) and myostatin (P < 0.05) expression in vehicle and rapamycin treated groups are shown in Figure 5B.