2717
Parametric Maps of Creatine Recovery Constants in Exercised Muscle1Radiology, University of Pennsylvania, Philadelphia, PA, United States
Synopsis
Though oldest noninvasive imaging biomarker for creatine kinase (CK) reaction in exercised muscle, phosphorous magnetic resonance spectroscopy (31PMRS) suffers from the poor resolution. The 2D creatine Chemical Exchange Saturation Transfer allows for the assessment of creatine recovery with excellent in plane spatial resolution, it was not possible to construct voxel wise parametric maps for recovery time constant due to low signal to noise ratio (SNR). Recently developed 3D implementation of CrCEST allowed for higher SNR and increased volumetric coverage and we exploit these two advantages in our novel non-local spatially regularized approach to reconstruct parametric map for recovery time constant.
Introduction
Systemic energy deficiency, traditionally measured by 31PMRS (phosphorous magnetic resonance spectroscopy) as the delayed phosphocreatine (PCr) recovery in exercised muscle, has been implicated in various disorders, including primary mitochondrial disorders(1), muscle injury(2), cardiovascular disease(3) and diabetes mellitus(4). However, 31PMRS suffers from poor spatial resolution. Recently developed 3D implementation of CrCEST, with temporal resolution of 30s(5), provides higher SNR and increased coverage. Exploiting these two advantages, we present a non-local spatially regularized approach to reconstruct parametric map for recovery time constants.Methods
3D CrCEST MRI was acquired at a 7.0T MRI scanner (Siemens) using a 28-Channel phased-array knee coil. First baseline CrCEST data was performed for 2 minutes, followed by 2 minutes of mild plantar flexion exercise (with 30 push/second, air pressure 8 pound per square inch) and then 8 minutes of post exercise CrCEST imaging. The sequence consisted of the pulse train (5x100ms Hanning windowed, duty cycle 99%, B1rms =2.9 μT), followed by single shot GRE read out with TR =3.5ms, TE =1.47ms, BW =710Hz/pixel, T1 recovery delay =5s. Other imaging parameters were: FOV = 160x160x40mm3; FOV phase 100%; spiral centric encoding order with elliptical scanning, GRAPPA factor = 2, averaging = 1; # slices = 8; BW = 710 Hz/pixel; shots = 1 in transverse orientation. Raw CEST images were acquired at 6 saturation offset frequencies ±1.5, ±1.8, ±2.1ppm (relative to water resonance). WASSR images (from ±0 to ±0.9 ppm with a step-size of ±0.15 ppm), with a saturation pulse at B1rms of 0.29μT with 200ms duration, was used to correct for B0 in homogeneities(6). B1 Calibration: Baseline CEST weighted images were acquired for following B1rms= 1.31, 1.6, 2.04, 2.47, 2.91, 3.2, 3.64, 4.08, 4.37 μT and corresponding CrCEST maps were calculated. Finally, the calibration was calculated using linear model (i.e. polynomial of order 1) on the voxelwise basis. Two healthy human volunteer (males, 28, 40 years old) participated in the approved study protocol. This volunteer #1 was known to have slow creatine recovery (recovery time constant >100s), most likely due to his ~2 hour/day bike commute. Based on post exercise PCr spectra, acquired in a separate session, the acidosis was confirmed.Recovery Parameters Fitting Algorithm: Mono-exponential course was assumed for creatine recovery curve
$$y_{k}(t) = A_0 + A_1 exp(-\frac{t}{\tau_{Cr}})$$ where $\tau_{Cr}$ = Cr recovery time constant, A0 = baseline level and A1 = interpolated values of post exercise CrCEST level at t approaches 0s. Starting with “noisy” time series data at any voxel “i" and time frame “k”: yexp(i) = yk(i), the weighted average over spatial domain can be written as:
$$y_{k}^{Smooth}(i) = \sum{W(i,j)y_{k}(j)}, where \, k \in {1,2,3, ...t} ...[1]$$
Calculation of weights: Out of the 16 time points acquired, only first eight of the decay curve were used for calculating the weight factors. The selected segment of time recovery curve was normalized and then Exponential Divergence score, Dij, was calculated between voxels i,j using formula given in(7). The weight (w(i,j)<1) , between ith and jth voxels in a neighborhood of radius 7, was calculated by combining the similarity and distance metric:
$$ W(i,j) = \frac{1}{\sqrt{(i_x-j_x)^2 + (i_y-j_y)^2 + (i_z-j_z)^2)}} \times \frac{(e^{-\frac{Dij}{h}})}{\sum_j{(e^{-\frac{Dij}{h}})}}$$ where h is the tuning parameter and was set to be ~0.001 empirically. Finally, we inverted the smoothed data (Eqn. [1]) using nonlinear least square solution utilizing Levenberg-Marquardt-Fletcher algorithm(8).
Results
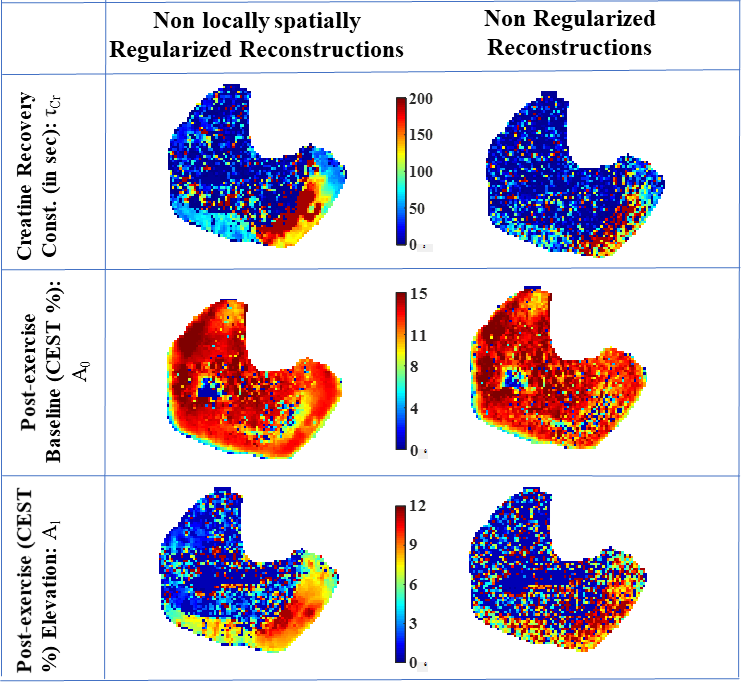
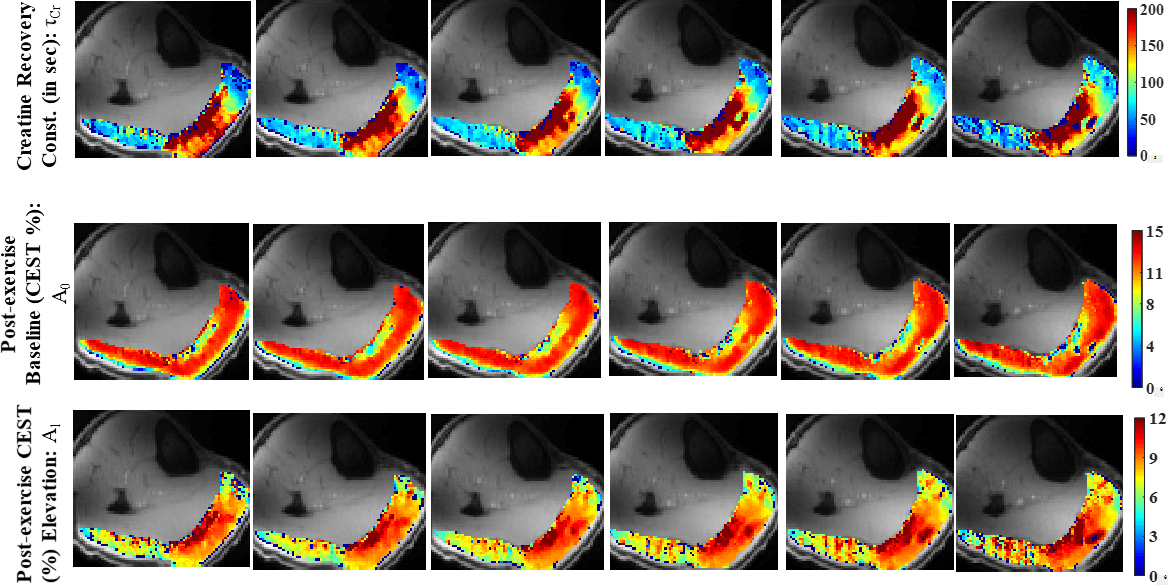
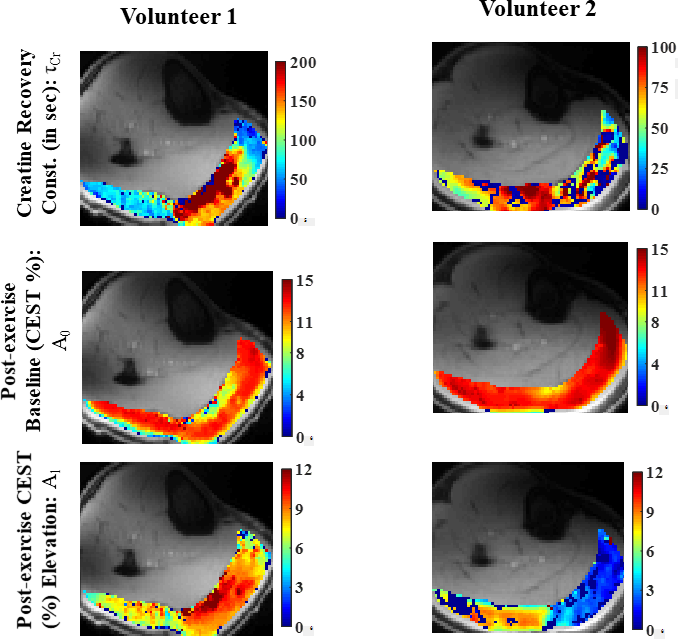
Both volunteers utilized lateral gastrocnemius (LG) and medial gastrocnemius (MG) muscles during the exercise. A major part of LG muscle show slow recovery. Fig. 1 compares the performance of the regularized approach against non-regularized approach. By suppressing the noisy instability, the regularized approach resulted in better depictions of underlying parametric maps in LG, MG. As other muscle group did not get utilized in the exercise, asymmetry change post exercise were not significant. The parametric map for volunteer 2 showed significantly slower recovery kinetic in terms rate constants and a higher post exercise elevation in % Cest asymmetry (Fig. 2). Volunteer 2 showed much faster recovery, which is what we typically expect from a healthy volunteer with sedentary to moderately physically active life style (Fig. 2).Discussion
The proposed algorithm resulted in a noise robust maps of recovery time constants and other related parameters. Parts of the parametric maps, for volunteer 2 with faster Cr recovery, were noisy/patchy. On the basis of empirical evidence, it appears that numerically robust parametric map reconstructions are only possible if τCr >3x temporal resolution. Fortunately, this condition would easily be met for patients with compromised creatine kinetics(1), (Cr recovery rates >1.5 minutes). However, this condition may not met be satisfied for healthy volunteers with sedentary to moderately physically active life style. We are currently working on developing experimental methods to reduce the temporal resolution to ~15s and that would eliminate this restriction. In future, we will perform simulations to investigate the τCr cut-off for reliable parametric reconstruction. We also plan to perform scan-rescan on a few patients with delayed CK kinetics.Conclusions
To the best of our knowledge, this is the first time demonstration of the ability to produce inter- and intra- muscular variabilities of creatine recovery specific parameters in exercised muscle and may provide a better imaging biomarker in disease conditions with delayed CK recovery.Acknowledgements
This project was supported by National Institute of Biomedical Imaging and Bioengineering of the National Institute of Health through grant number P41-EB015893 (NIH/NIBIB) and R56-AG062665 (NIH).References
1. DeBrosse C, Nanga RPR, Wilson N, D'Aquilla K, Elliott M, Hariharan H, Yan F, Wade K, Nguyen S, Worsley D, Parris-Skeete C, McCormick E, Xiao R, Cunningham ZZ, Fishbein L, Nathanson KL, Lynch DR, Stallings VA, Yudkoff M, Falk MJ, Reddy R, McCormack SE. Muscle oxidative phosphorylation quantitation using creatine chemical exchange saturation transfer (CrCEST) MRI in mitochondrial disorders. JCI Insight 2016;1(18):e88207.
2. Armstrong RB, Warren GL, Warren JA. Mechanisms of exercise-induced muscle fibre injury. Sports Med 1991;12(3):184-207.
3. Ooi DS, Isotalo PA, Veinot JP. Correlation of antemortem serum creatine kinase, creatine kinase-MB, troponin I, and troponin T with cardiac pathology. Clin Chem 2000;46(3):338-344.
4. Popovich BK, Boheler KR, Dillmann WH. Diabetes decreases creatine kinase enzyme activity and mRNA level in the rat heart. Am J Physiol 1989;257(4 Pt 1):E573-577.
5. Kumar D, Nanga RPR, Thakuri D, Cember A, Hariharan H, Reddy R. Title: Repeatability of Creatine Recovery Constants in Exercise Muscle Measured using 3D Creatine Chemical Exchange Saturation Transfer (3D CrCEST) Imaging at 7.0T International Society of Magnetic Resonance in Medicine:: (submitted as an abstract); 2020.
6. Kim M, Gillen J, Landman BA, Zhou J, van Zijl PC. Water saturation shift referencing (WASSR) for chemical exchange saturation transfer (CEST) experiments. Magn Reson Med 2009;61(6):1441-1450.
7. Divergence (statistics), Wikipedia, https://en.wikipedia.org/wiki/Divergence_(statistics).
8. Levenberg–Marquardt algorithm, Wikipedia, https://en.wikipedia.org/wiki/Levenberg%E2%80%93Marquardt_algorithm
Figures