2716
A novel approach for 3D whole muscle strain measurements during isometric muscle contractions1Vanderbilt University Institute of Imaging Science, Nashville, TN, United States, 2Department of Biomedical Engineering & Physics, Amsterdam University Medical Centers, Amsterdam, Netherlands, 3Department of Radiology and Radiological Sciences, Biomedical Engineering, and Molecular Physiology and Biophysics, Vanderbilt University Medical Center, Nashville, TN, United States
Synopsis
In this study we explore the feasibility of using displacement fields to quantify whole muscle 3D strain patterns during submaximal voluntary contractions of the dorsiflexor muscles. Our results showed a consistent pattern, of large negative (shortening) and a large positive (lengthening) principal strains. Both the magnitude and pattern of strain agree with other studies performed during submaximal contractions which indicates the feasibility of this approach to quantify 3D strain.
Introduction
Neuromuscular diseases are characterized by a wide variety of pathophysiological changes in skeletal muscle, such as fat infiltration, inflammation and fibrosis as well as reduced muscle strength and function1,2. Our understanding of how these pathophysiological changes directly impair muscle function is incomplete. Spin Tagging and Phase Contrast (PC) imaging are most frequently used to quantify mechanical characteristics of skeletal muscle3,4. However, these techniques are usually performed in a single slice fashion and/or need repetition of movements to encode in multiple directions. As a result these techniques generally reflect only localized information of strain patterns during low force contractions. Consequently, there is need for fast and 3D mapping of strain during contractions with higher force levels. In this study we explore the feasibility of using displacement fields, estimated from 3D high resolution anatomical scans during rest and submaximal isometric contractions, to quantify whole muscle 3D strain patterns in the Tibialis Anterior (TA) muscle.Methods
Seven healthy subjects (5 men; Age:25.1± 2.7yrs. Range: 23-31yrs.) participated in this study. All subjects underwent a familiarization session and a test session. During the familiarization session subjects performed three or more Maximum Voluntary Contractions (MVC) of the dorsiflexor muscles to determine their maximum force using a homebuilt isometric exercise device(ref). Then the subject practiced submaximal dorsiflexion contractions at 20% and 40% MVC. Isometric force was measured using a load cell and recorded with a custom LabVIEW program (National Instruments, Austin TX). On the testing day, subjects were placed in supine position with their right foot strapped in the exercise device in +10° plantarflexion position. MR Imaging was performed with a 3T MR system (Philips, Best, The Netherlands) using a 16-channel surface coil and 8-channel table top coils. The scan protocol consisted of three 3D high resolution mDixon scans (3D; 6 echoes; TR/TE/ΔTE 210/1.01/0.96ms; FOV 192x192x308; slice thickness 3.5mm, 36 seconds), performed with the leg at rest, during 20% and 40% MVC isometric dorsiflexion contractions. After the scan at rest, the volunteers were instructed to match the target force, using real time visual force feedback and hold that position for the duration of the scan.Post-processing
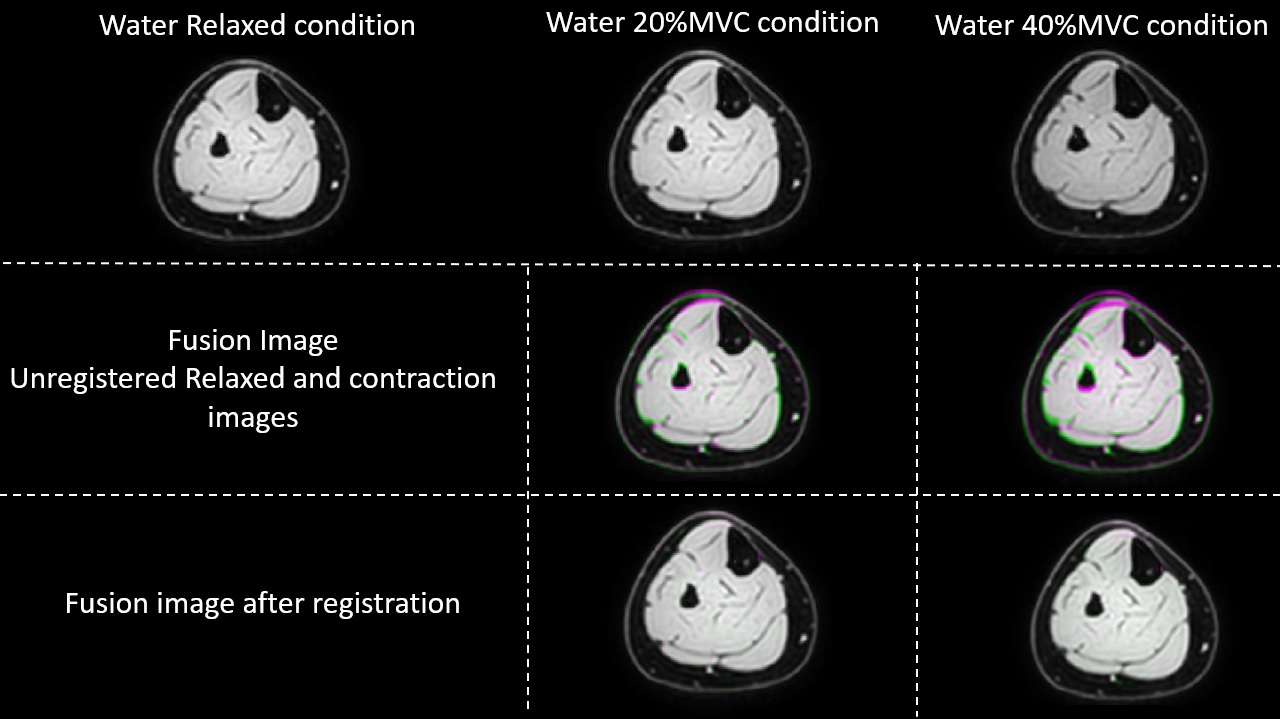
MR images were analysed using MATLAB (The Mathworks, Inc., Natick, MA). Registration of the water-only image obtained at rest to the images obtained during contraction was used to estimate the displacement field between MVC20% and MVC40% and the relaxed condition using 3D Demons5 (Figure 1). The 3D strain tensor was calculated based on the displacement field; diagonalized, principal strains were computed as magnitude-sorted eigenvalues. Principal and linear strain values were computed for the deep and superficial compartment of the TA muscle, using manually drawn Regions-of-Interest. Additionally, these segmentations were divided into distal, middle and proximal segments, based on equal number of slices per segment. The force data acquired during each contraction were filtered with a 4th-order, low-pass butterworth filter (cut-off frequency = 5.5 Hz) to remove the interfering signal from the scanner, after which the relative contraction intensity was calculated for the full duration of the contraction. Differences in strain between MVC conditions were assessed with a Mann-Whitney-U-test. Differences in strain between the different muscle segments (distal, middle, proximal) were assessed with a Friedman-test.Results
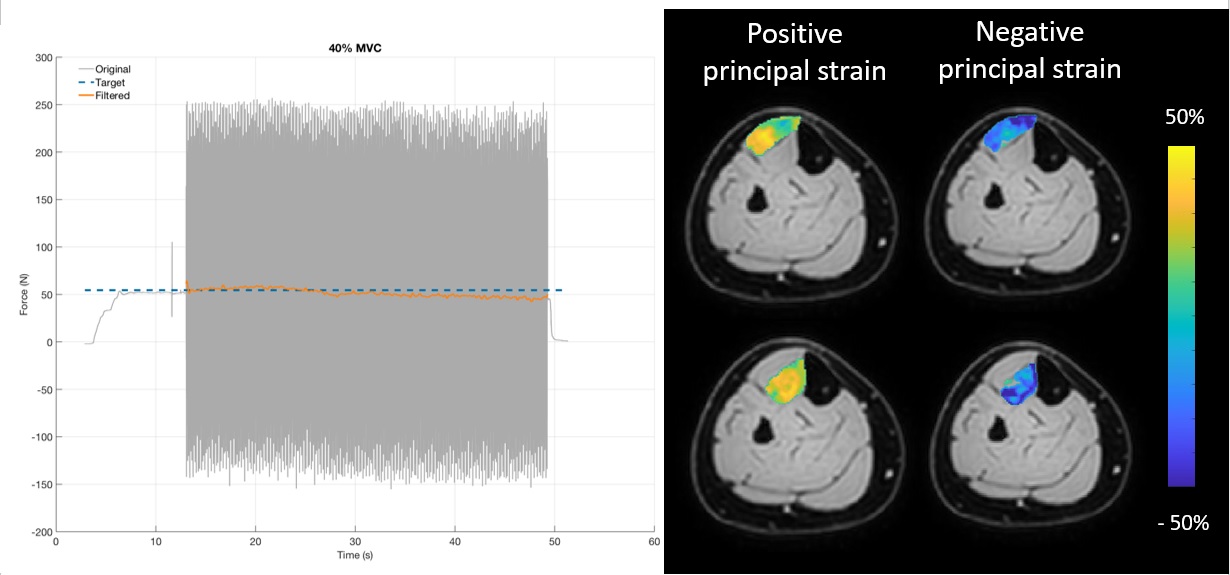
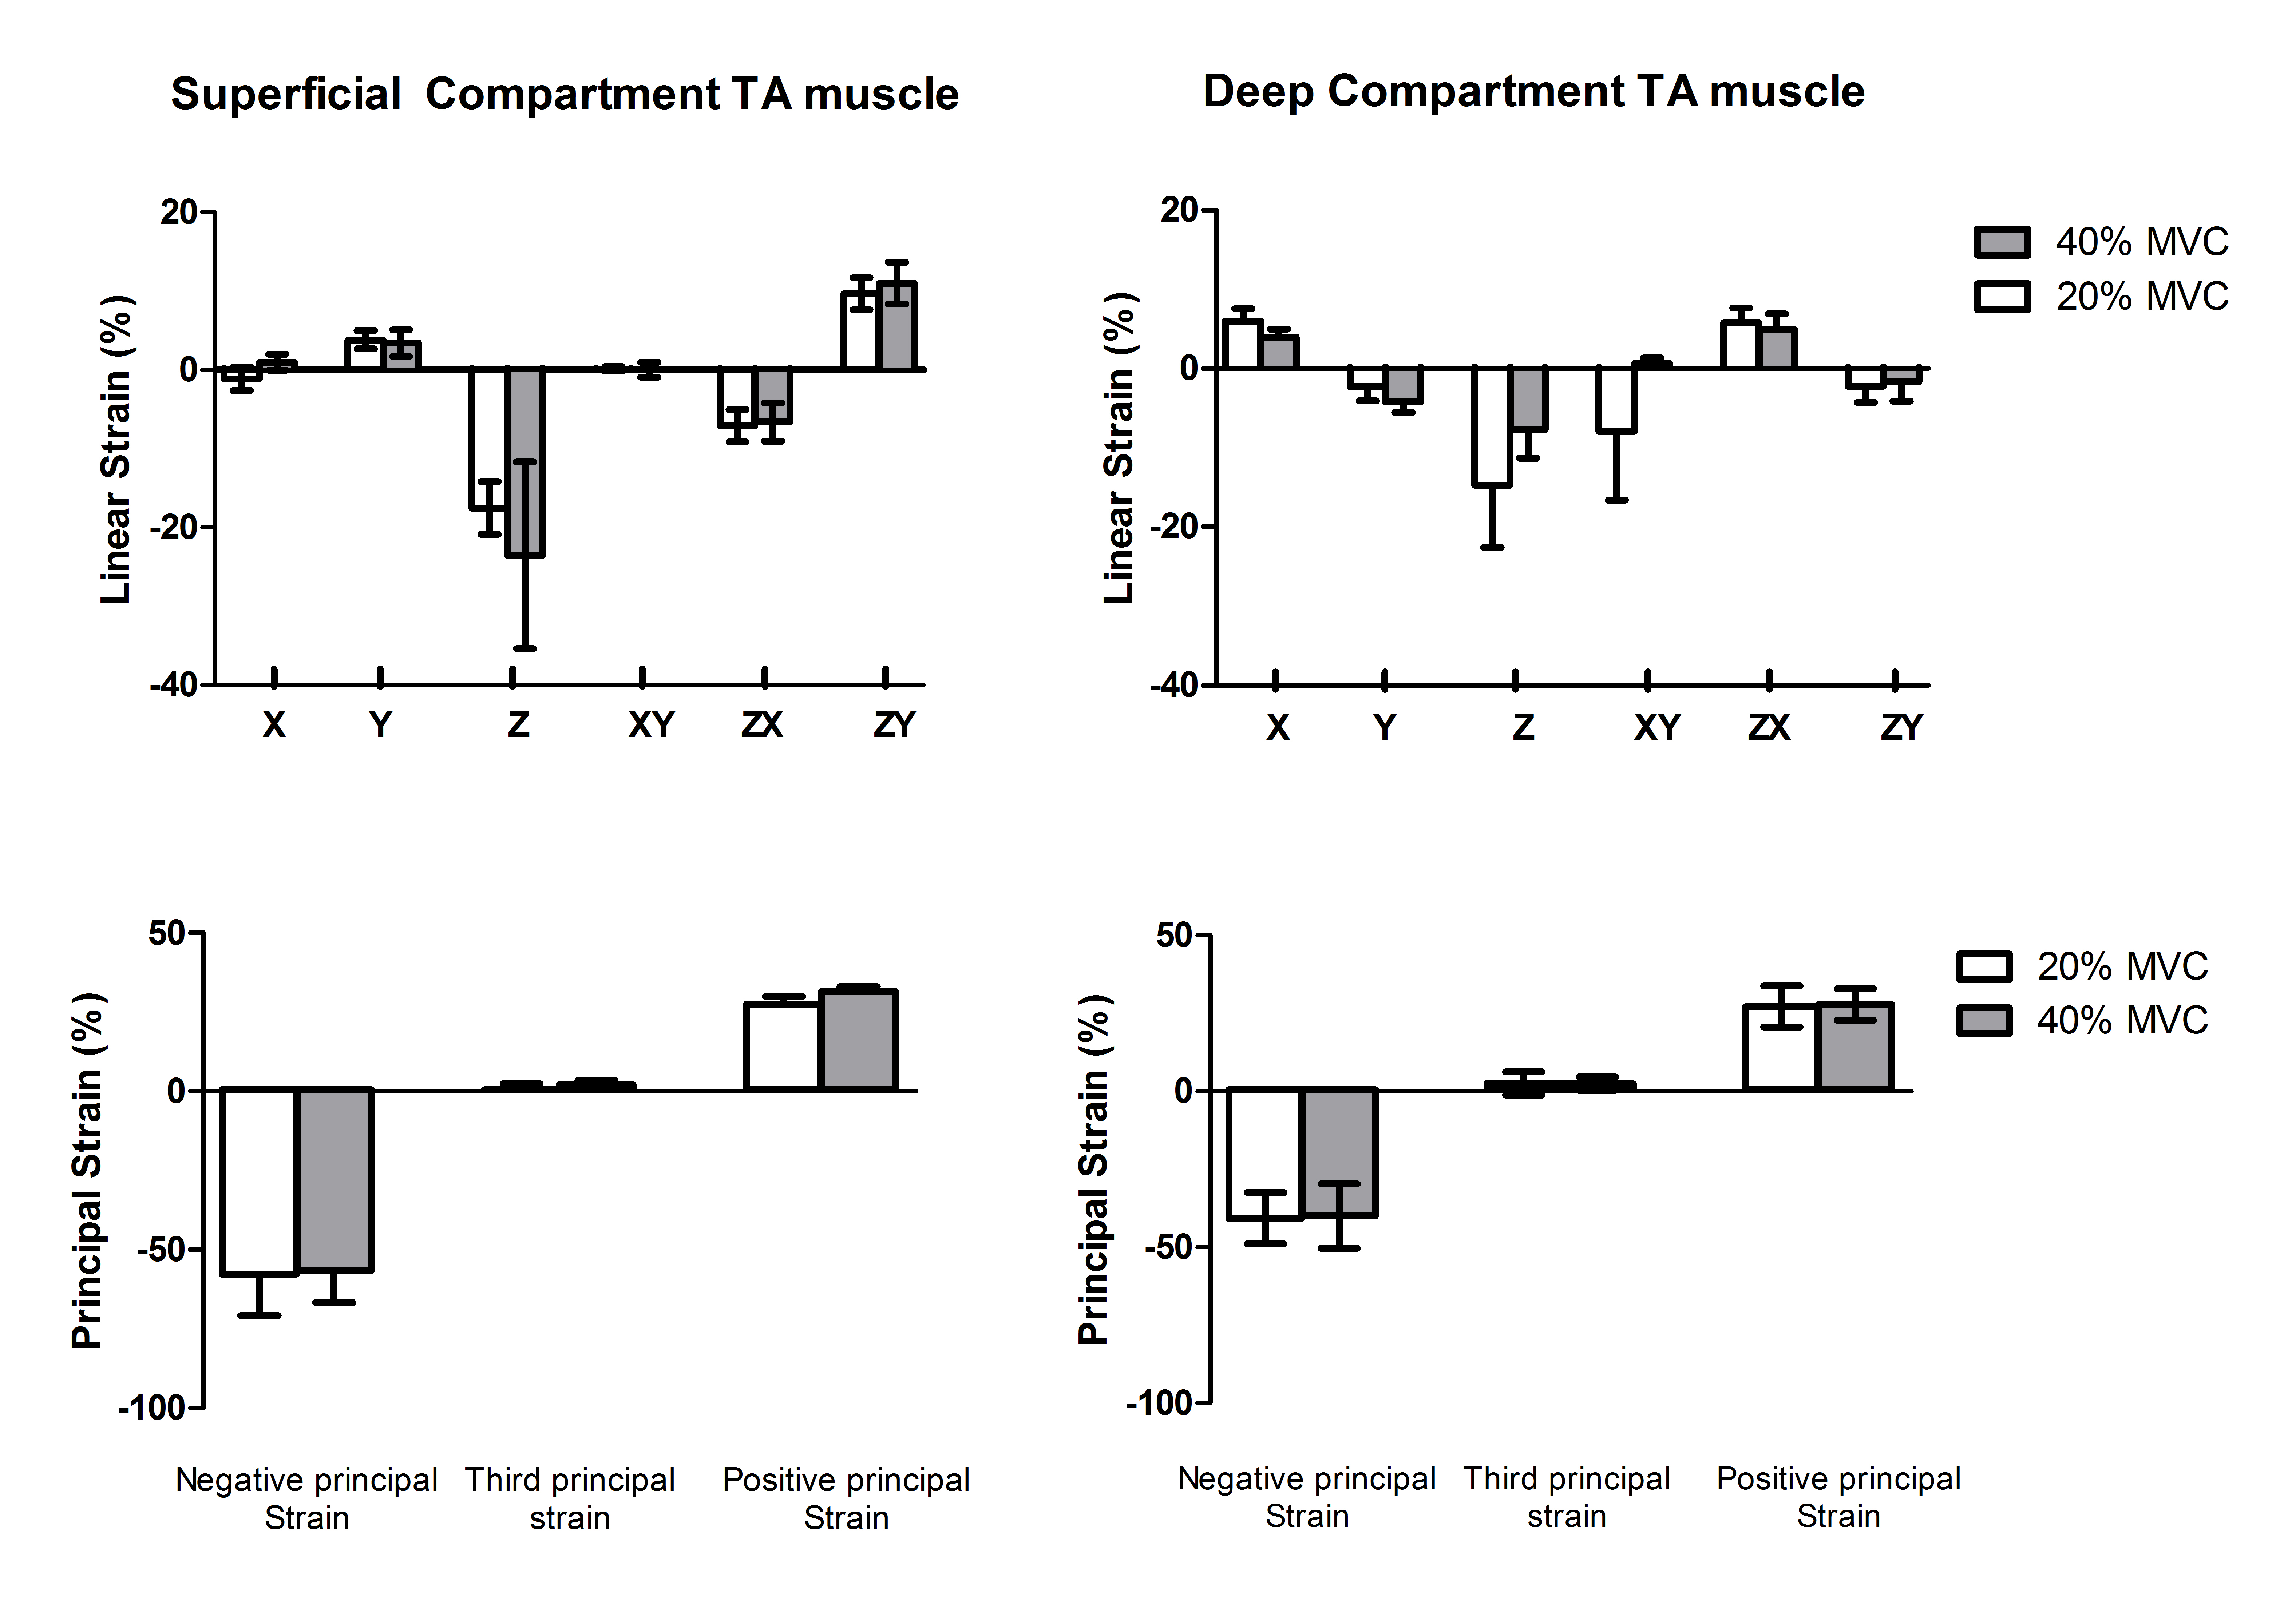
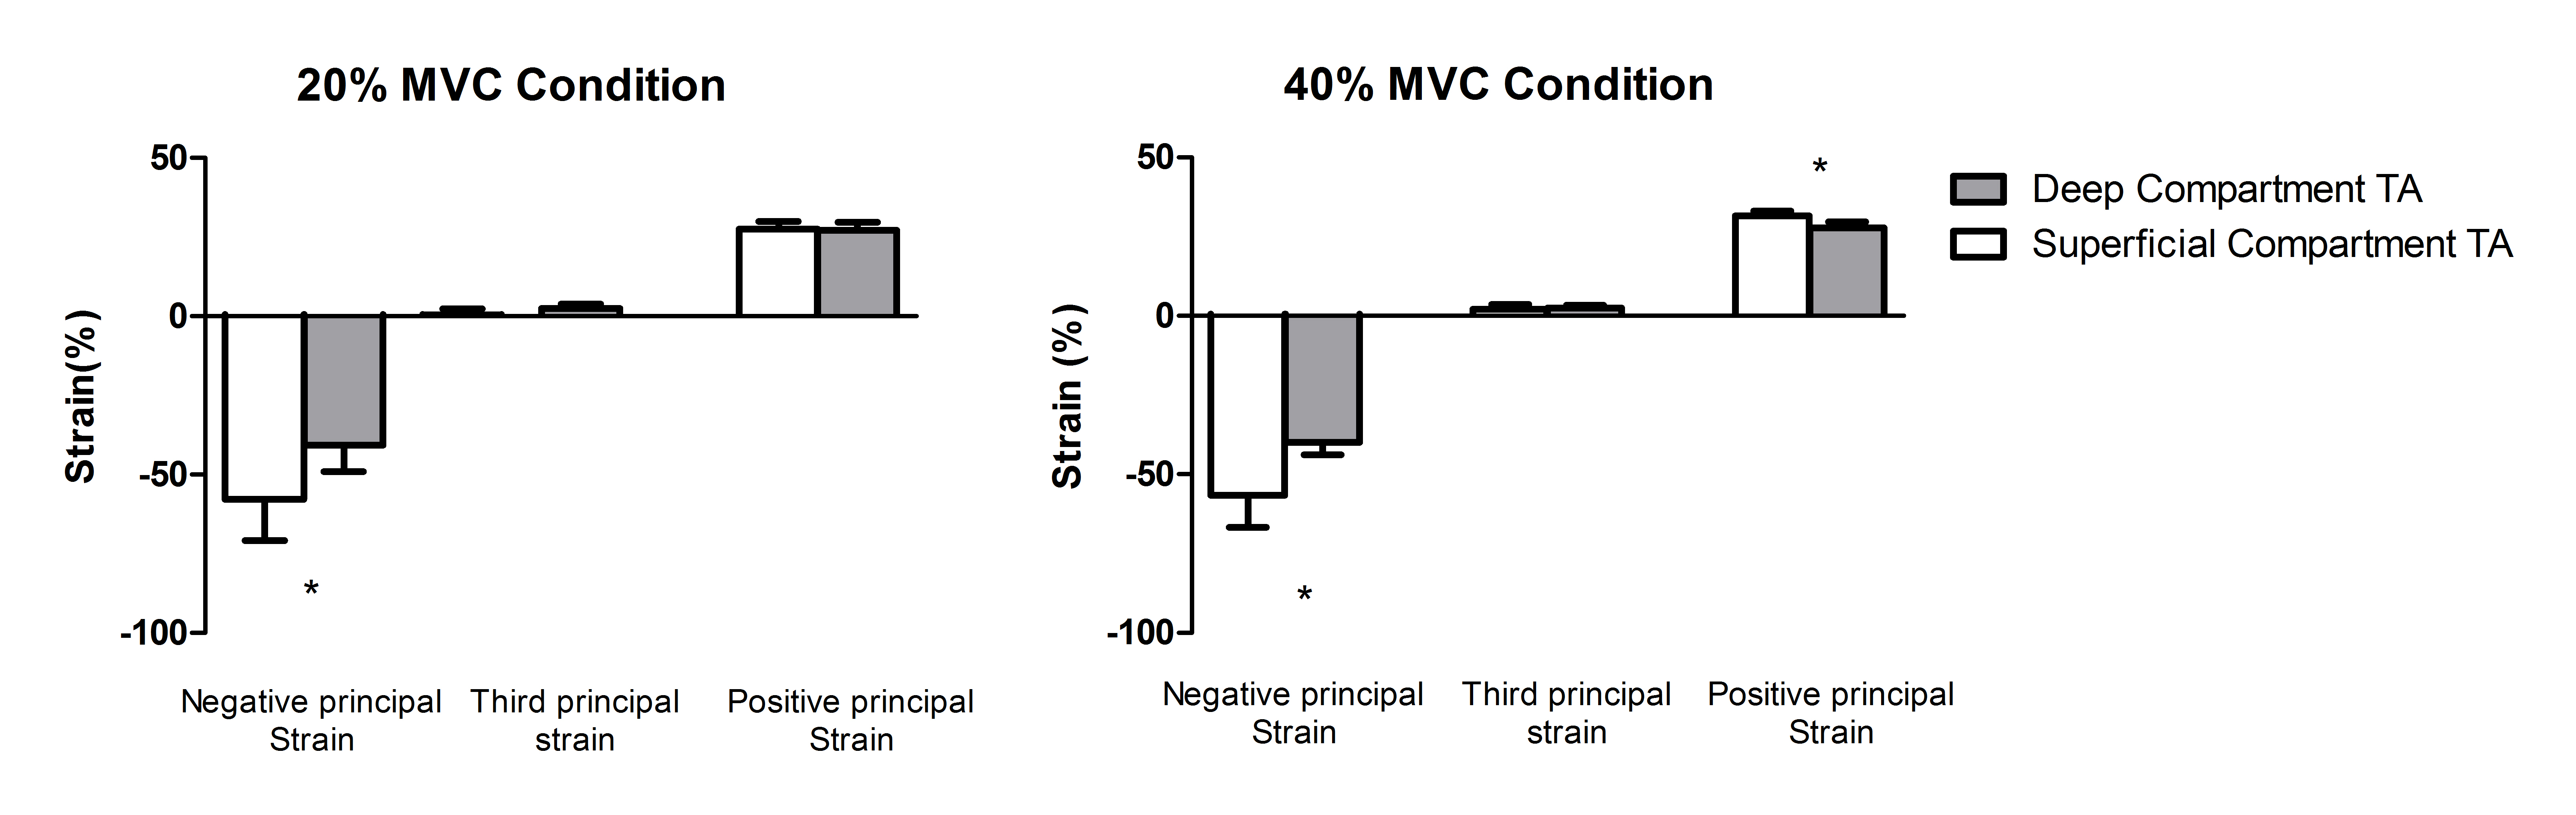
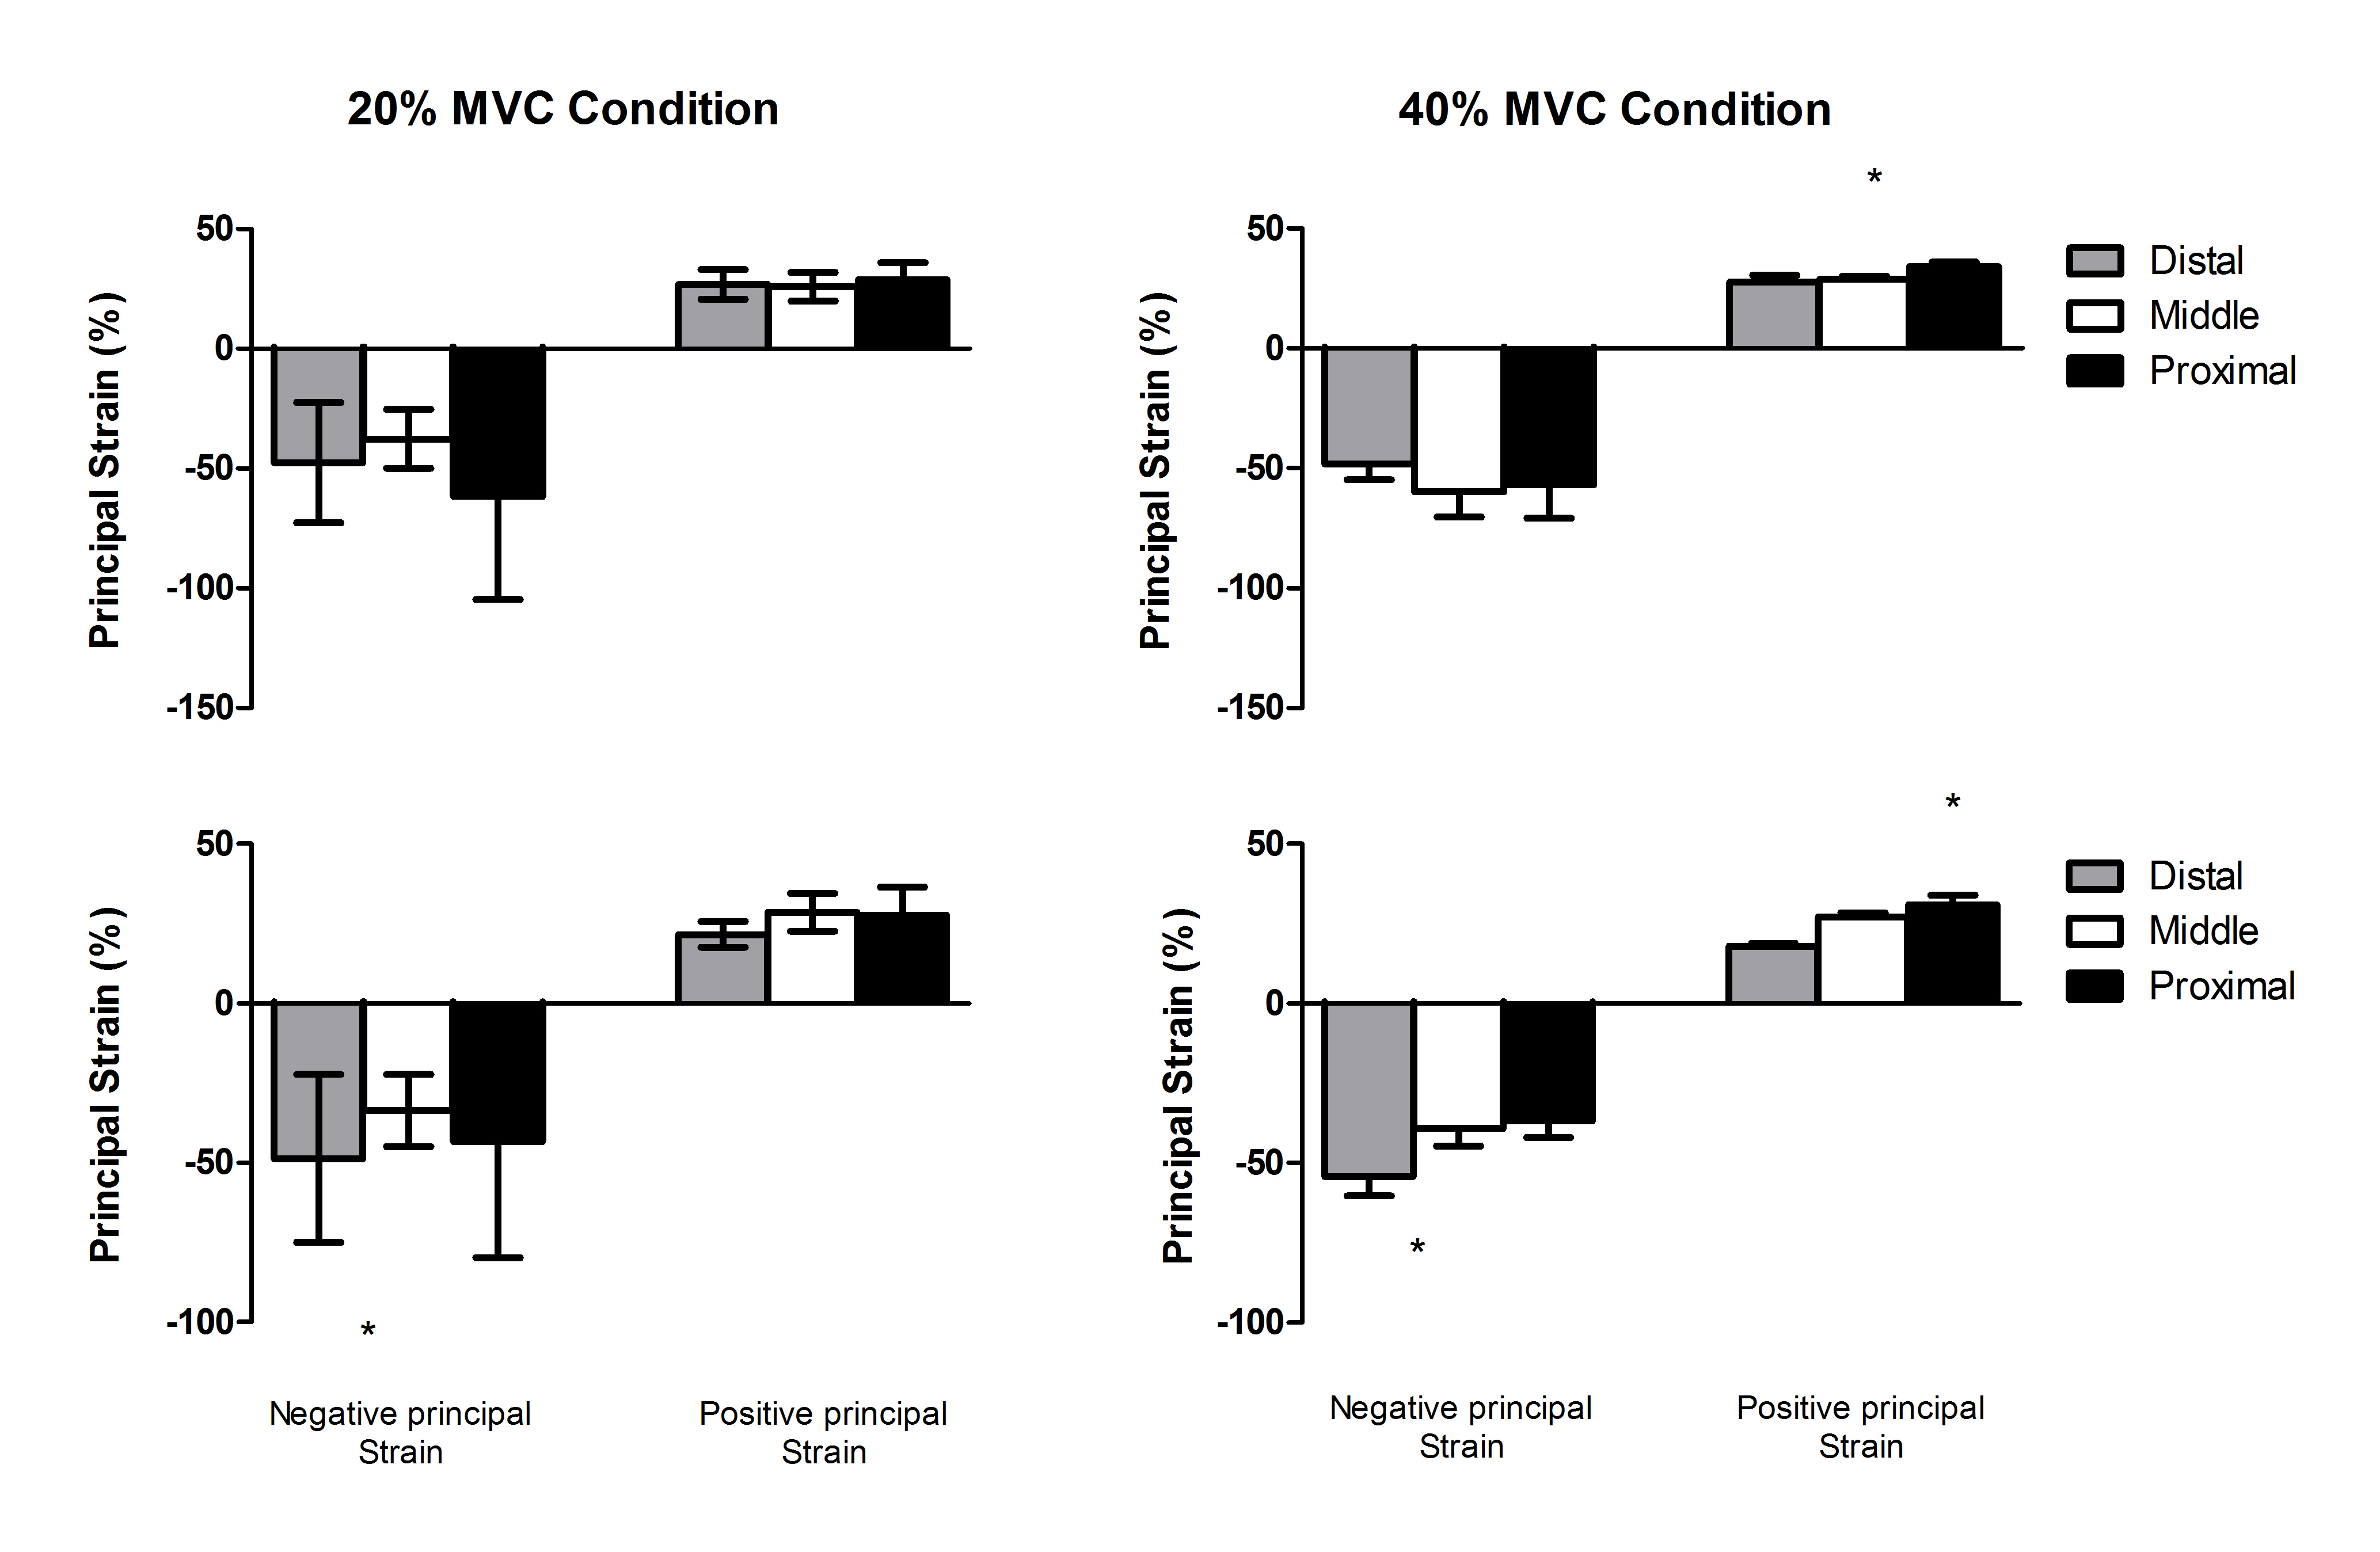
The mean MVC force was 265.2±130N. The relative contraction intensity during 40% MVC condition was 35.7±0.6% and during the 20% MVC condition was 19.3±2.6%. Principal strain maps and filtered force data are shown in Figure 2. Linear and principal strain values for deep and superficial compartment during both MVC conditions are shown in Figure 3. For the principal strains we found a large-magnitude negative value (En), a large-magnitude positive value (Ep) and an almost zero value in both compartments during both MVC conditions. Principal and linear strains did not differ between the two MVC conditions. Higher Ep were found in the superficial compartment compared to the deep compartment of the TA muscle during both MVC conditions (20% Ep: p<0.001 40%; Ep: p<0.0001)(Figure 4). Comparison between the muscle segments showed higher Ep in the proximal segment of both compartments and higher En in the distal segment of the deep compartment during the MVC40% condition(Figure 5).Discussion
In this study we explored the feasibility of quantifying 3D strain values using displacement fields. Our results showed a consistent pattern, of large negative (shortening) and a large positive (lengthening) principal strains. Both the magnitude and pattern of strain pattern agree with other studies performed during submaximal contractions6,7. The variability in strain between muscle compartments and between muscle segments suggests complex and heterogenous strain patterns which agree with previous work in healthy skeletal muscle during in-vivo voluntary submaximal contractions7-10. This heterogeneity in strain within the muscle can be caused by architectural differences between compartments and segments, differences in motor-unit activation and neural control11-12. Interestingly, we did not find differences in strain between the MVC conditions, which could be due the large variability between subjects or due to only small deformations differences beween the 20% and 40%MVC.Conclusion
We show the feasibility of quantifying 3D whole muscle strain calculated from displacement fields during submaximal voluntary isometric contractions.Acknowledgements
No acknowledgement found.References
1. Lokken N, Hedermann G, Thomson C et al. Contractile properties are disrupted in Becker muscular dystrophy, but not in limb girdle type 2I. Ann Neurol. 2016 Sep;80(3):466-71
2. Wokke BH, van den Bergen JC, Verlsuis MJ et al. Quantitative MRI and strength measurements in the assessment of muscle quality in Duchenne muscular dystrophy. Neuromuscul Disord. 2014 May;24(5):409-16.
3. Drace JE, Pelc NJ. Measurement of Skeletal muscle motion in vivo with Phase-contrast MR imaging. J Magn Reson Imaging 1994, Mar-Apr;4(2):157-63.
4. Zerhouni EA, Pardish DM, Rogers WJ et al. Human heart: tagging with MR imaging – a method for noninvasive assessment of myocardial motion. Radiology 1988, Oct;169(1):59-63.
5. Thirion JP. Image matching as a diffusion process: an analogy with Maxwell’s Demons. Medical Image Analysis. 1998, Sep;2(3):243-60.
6. Mazzoli V, Gottwald LM, Peper Es et al. Accelerated 4D Phase Contrast MRI in skeletal muscle contractions. Magn Reson Med. 2018, Nov;80(5):1799-1811.
7. Englund EK, Elder Cp, Xu Q et al. Combined diffusion and strain tensor MRI reveals a heterogeneous, planar pattern of strain development during isometric muscle contractions. Am J Physiol Regul Integr Comp Physiol 2011, Jan;26:1079-1090.
8. Finni T, Hodgson JA, Lai AM et al. Non-uniform strain of the human soleus aponeurosis-tendon complex during submaximal voluntary contractions in-vivo. J appl Physiol 2003, ;95: 829-837
9. Shin DD, Hodgson JA, Edgerton VR et al. In vivo intramuscular fascicle-aponeuroses dynamics of the human medial gastrocnemius during plantarflexion and dorsalflexion of the foot. J appl Physiol 2009, 107:1276-1284.
10. Blemker SS; Pinsky PM, Delp SL. A 3D model of muscle reveals the causes of non-uniform strains in the Biceps Brachi. J Biomech 2005 38:657-665 2005
11. Connelly DM, Rice CL, Roos MR et al. Motor unit firing rates and contractile properties in tibialis anterior of young and old man. J appl physiol 1999, 87: 843-852
12. Wolf SL, Kim JH. Morphological analysis of the human tibialis anterior and medial gastrocnemius muscles. Acta Anat(basel) 1997, 159:287-295.
Figures