2715
A method for quantification of changes in leg muscle fiber orientations
Laura Secondulfo1, Joep J M Suskens2, Ozgur Kilic2, Valentina Mazzoli3, Mario Maas4, Hans J.L Tol2, Aart Nederveen4, Melissa Hooijmans1, and Gustav J Strijkers1
1Biomedical Engineering and Physics, UMC Amsterdam, Location AMC, Amsterdam, Netherlands, 2Orthopedic Surgery, UMC Amsterdam, Location AMC, Amsterdam, Netherlands, 3Radiology, Lucas Center for Imaging, Stanford University, Stanford, CA, United States, 4Radiology and Nuclear Medicine, UMC, Amsterdam, Location AMC, Amsterdam, Netherlands
1Biomedical Engineering and Physics, UMC Amsterdam, Location AMC, Amsterdam, Netherlands, 2Orthopedic Surgery, UMC Amsterdam, Location AMC, Amsterdam, Netherlands, 3Radiology, Lucas Center for Imaging, Stanford University, Stanford, CA, United States, 4Radiology and Nuclear Medicine, UMC, Amsterdam, Location AMC, Amsterdam, Netherlands
Synopsis
Hamstring injuries have high recurrence rates in elite athletes, which motivates the investigations in novel diagnostic methods for muscle injury and follow-up. Diffusion tensor imaging facilitates direct and indirect monitoring of the muscle condition and architecture. Fiber orientations and changes therein due to injury or training are considered a key parameter; however, the assessment over the full volume of an individual muscle is still difficult. Therefore, we developed a method to generate reproducible quantitative fiber-angle color maps of the whole volume of leg muscles, which proved sensitive to changes due to muscle stretch and a training intervention.
Introduction
In elite athletes, hamstring re-injuries have a high recurrence rate, which motivates the development of novel diagnostic methods for muscle injury and follow-up [1]. Diffusion tensor imaging provides parameters to assess both muscle condition and architecture such as muscle volume, fiber length and orientation which are important determinants of muscle function [2]. Fiber orientation has shown to change due to training, muscle injury [3] and in muscle diseases [4,5]. We developed a method to generate reproducible quantitative fascicle-angle color maps (FACM) of the whole leg muscles from DTI acquisitions, which proved sensitive to changes due to muscle stretch and a training intervention.Methods
The repeatability of our approach was assessed in both the upper legs (exp.1) and in one lower leg in three foot positions (exp.2). The sensitivity to changes detection with this method was gauged in the lower leg at 3 different passive ankle angles (15˚ dorsiflexion, 0˚ neutral position, and 30˚ plantarflexion) using a costume device (exp.2) and in a clinical case in the upper leg before and after training intervention in basketball players (exp.3). The intervention consisted of Nordics exercises for a period of 12 weeks, 54 times per leg per week; the training regime was reached after 4 weeks.All three datasets consisted of 5 subjects and were acquired twice with a 3T Philips MRI, using a 16-channel anterior coil and the 10 table posterior coils. Subjects were positioned in feet-first supine position. The MRI protocols included a 3-point mDixon scan for anatomical reference and a DT-MRI protocol (Figure 1). The scanning parameters for the upper legs were: FFE: TR=8.0ms, TE/ΔTE=133/1.1ms, voxel size=1.5x1.5x3mm3; SE-EPI: TR=4630ms, TE=53ms voxel-size=3x3x6mm3 , diffusion b-value=450s/mm2; for the lower leg FFE: TR=7.7ms, TE/ΔTE=2.1/1.7ms, voxel-size=1x1x2.5mm3; SE-EPI: TR=11191ms, TE=51.63ms, voxel-size=3x3x5mm3, diffusion b-value = 400s/mm2 with SPAIR fat suppression.
The DT-MRI data were analyzed with QMRITools for Mathematica 12 [6] which included noise suppression, registration to anatomical images, tensor fitting (iWLLS), eigenvalue and eigenvector calculations.
FACM were calculated between the principal eigenvector in each voxel and the vector parallel to a chosen reference line. Reference lines were defined in ITK-SNAP based on anatomical data of tendons, muscle insertions, and bone orientations.
In the repeatability experiment of the upper legs (exp.1), ROIs were manually defined on the anatomical image in the biceps femoris long head (BFlh) of the right and the left leg, while in the intervention experiment (exp.3), only the FACM of the left leg BFlh was measured. In both datasets of the upper legs (exp.1&3) the reference line was defined between the insertion points of the BFlh (Figure 2).
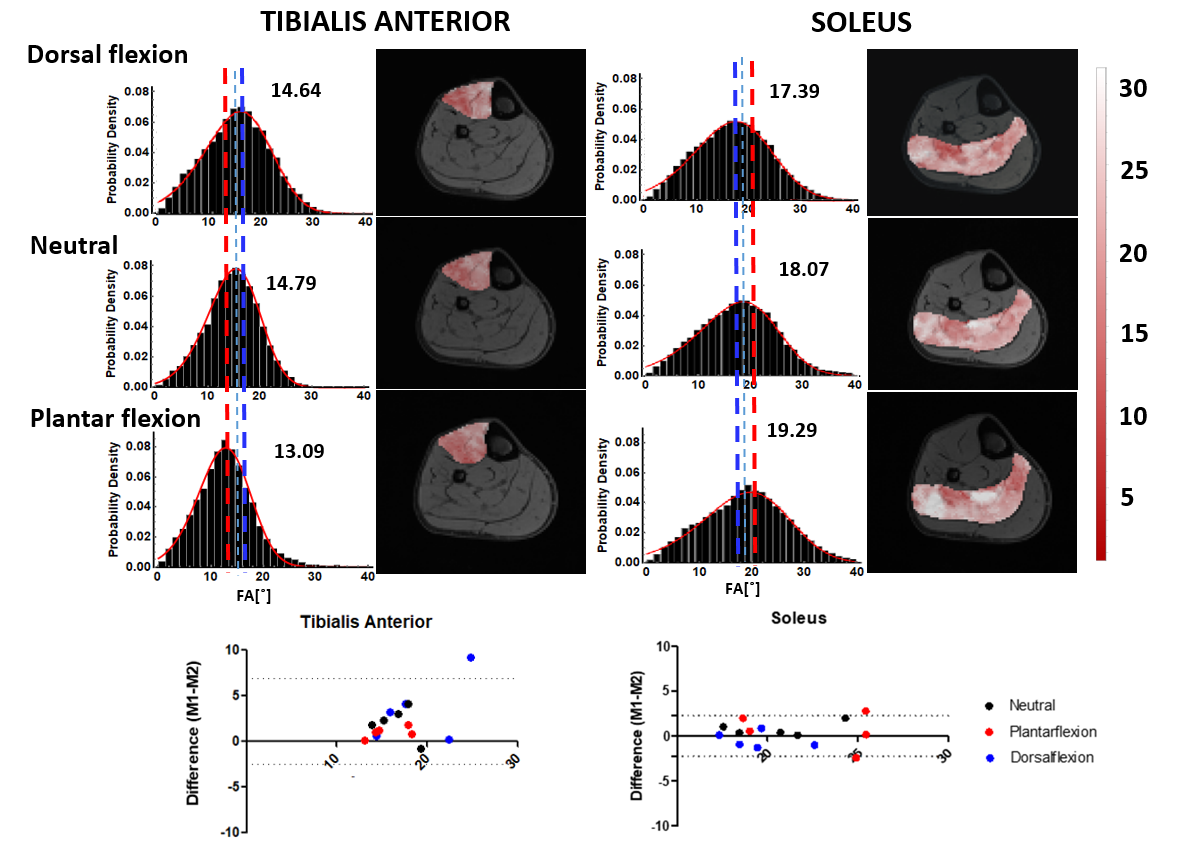
In the lower leg (exp2), ROIs were the soleus (SOL) and the tibialis anterior (TA) and the reference line was described by a point on the tibia plate and the most distal and posterior point in the FOV of the diaphysis.
The repeatability and the precision of the measurements were assessed using Bland-Altman analysis and the coefficient of variation (CV). Additionally, the distributions of the measurements and the FACM in proximal and medial small ROIs close to the intramuscular tendon were measured and compared.
Results and Discussion
FACM were obtained in the whole muscle body for 4 muscles of the upper and lower legs (exp.1-3) and changes therein were measured with passive foot stretch in the lower leg muscles (exp.2) and with training intervention in the upper legs in both the whole BFLh volume as well as in smaller ROIs (exp.3).The Bland-Altman analysis of average FACM showed good agreement for both exp.1&2 (Figures 2&3).
In exp.1 the CV was 6.4, with limits of agreements (LoA) between -2.0° and 0.4°. For exp.2 the LoA ranges were between -2.5° and 6.9° for the TA and between -2.4° and 3.0° for the SOL. These larger LoA ranges can be explained by the 3 degrees of freedom of the ankle.
The changes in the mean value of FACM with passive foot stretch (Figure 3) agreed with literature [7] and, as expected, the overall change was minor in the SOL [8].
The repeatability results should be considered in light of the quality of the diffusion scan, the muscle anatomy and location, and fat composition. The most important factor seems a successful registration of the diffusion scan to the anatomical reference, which is highly dependent on scan quality and which affects the selection of the correct ROIs where the FACM are measured.
The results of exp.3 show that our method can successfully be applied to measure changes in fibers orientation due to a training intervention. In fact, in individual subjects changes in mean fascicles orientation between baseline and after training were above the LoA of exp.1 (range 1.0-6.0°). Fiber distributions of the BFlh for 2 cases out of 5 are shown in Figure 4. Moreover, larger changes in the mean values were detectable in smaller ROIs defined close to the intramuscular tendon (Figure 5).
Conclusions
Our approach facilitates the generation of reproducible fiber-angle color maps of the muscles in the leg, for monitoring changes in training and recovery. Small changes with passive foot stretch and due to training intervention in the whole muscle volume and in smaller ROIs can be quantified.Acknowledgements
References
- Reurink G, Brilman EG, de Vos RJ, et al. Magnetic Resonance Imaging in Acute Hamstring Injury: Can We Provide a Return to Play Prognosis? Sport Med. 2014;45(1):133-146. doi:10.1007/s40279-014-0243-1 .
- Narici, M., Franchi, M., & Maganaris, C. (2016). Muscle structural assembly and functional consequences. Journal of Experimental Biology, 219(2), 276-284.
- Timmins, R. G., Shield, A. J., Williams, M. D., Lorenzen, C., & Opar, D. A. (2016). Architectural adaptations of muscle to training and injury: a narrative review outlining the contributions by fascicle length, pennation angle and muscle thickness. Br J Sports Med, 50(23), 1467-1472.
- Tomlinson, D., Hennis, P., & Murphy, E. (2018). A pilot study investigating the impact of glycogen storage disease (type III) on skeletal muscle properties and habitual physical activity patterns in young and middle-aged adults. Journal of Sports Sciences.
- Phadke, R., Puthucheary, Z., Rawal, J., McPhail, M., Sidhu, P., Rowlerson, A., ... & Montgomery, H. (2015). Fasciitis frequently accompanies myopathy in acute critical illness muscle wasting: Evidence from qualitative ultrasound and muscle biopsy analysis. Neuromuscular Disorders, 25, S250.
- https://mfroeling.github.io/QMRITools/
- Hodgson, J. A., Finni, T., Lai, A. M., Edgerton, V. R., & Sinha, S. (2006). Influence of structure on the tissue dynamics of the human soleus muscle observed in MRI studies during isometric contractions. Journal of Morphology, 267(5), 584-601.
- Kellis, E. (2018). Biceps femoris fascicle length during passive stretching. Journal of Electromyography and Kinesiology, 38, 119-125.
- Bolsterlee, B., Finni, T., D’Souza, A., Eguchi, J., Clarke, E. C., & Herbert, R. D. (2018). Three-dimensional architecture of the whole human soleus muscle in vivo. PeerJ, 6, e4610.
Figures
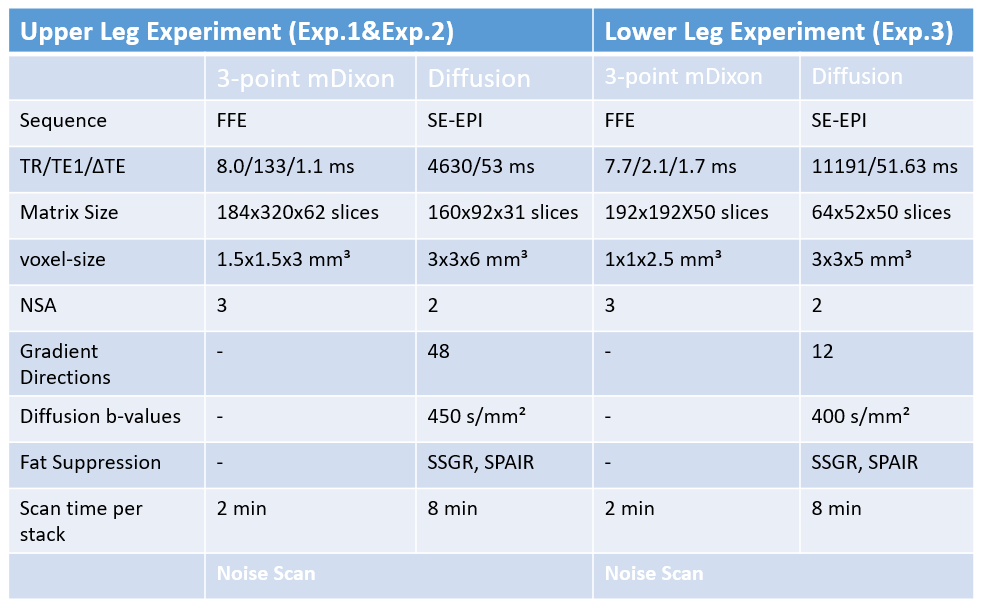
Figure 1:The table shows the scanning parameters of the three experiments in this study.
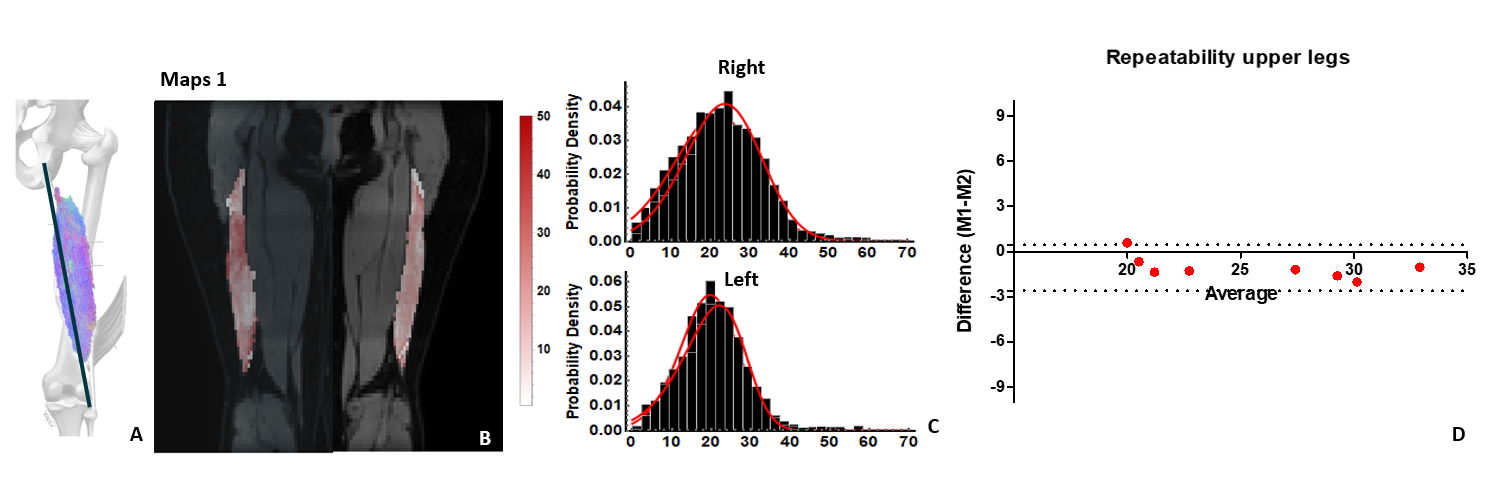
Figure 2: Exp.1: (A) Fiber angle color maps (FACM) of left
and right BFlh muscles overlaid on the anatomical image. The fiber-angle
reference line was defined between both BFlh attachments. (B) Fiber-angle
distributions of left and right leg BFlh of the repeated measurements for a
representative subject (C) Bland-Altman analysis of the mean BFlh fiber
orientations of all subjects.
Figure
3: Exp.2: (top) Fiber-angle distributions and FACM
of Tibialis Anterior and Soleus muscles for the dorsal flexion, neutral, and
plantar flexion foot positions. The dashed lines and numbers indicate the mean
fiber-angle. (bottom) Bland-Altman plots for the mean fiber-angles of Tibialis
Anterior and Soleus. The three foot positions are indicated with different
colors.
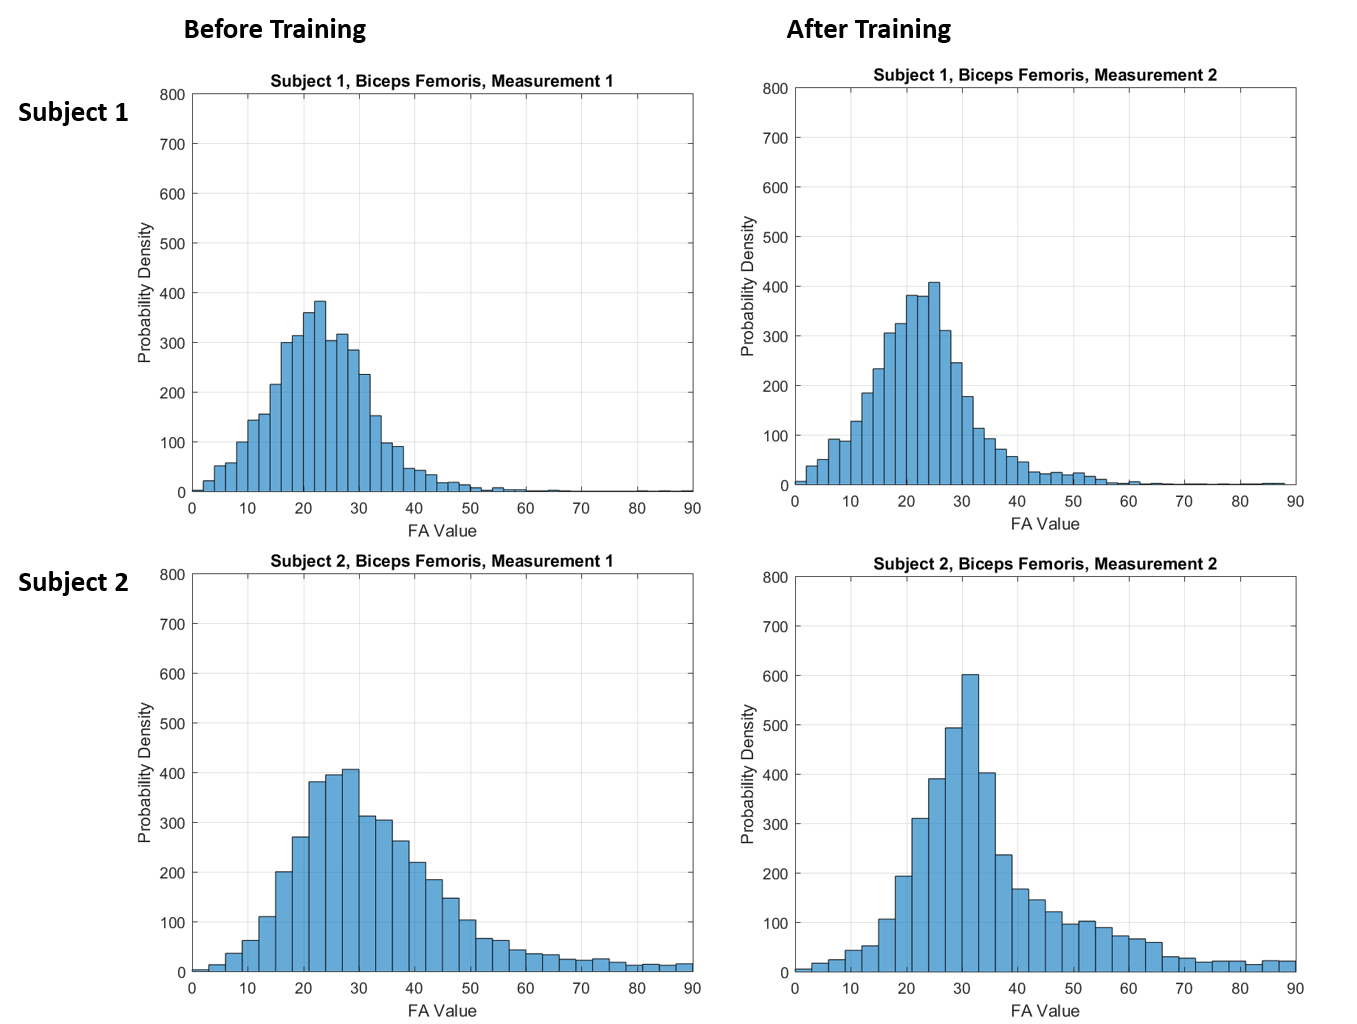
Figure 4: Exp.3: Fiber-angle distributions for the left
Biceps Femoris of 2 subjects before and after a training intervention. For
subject 1 (top) no changes in the fiber-angle distribution were visible,
whereas for subject 2 (bottom) a clear change in the fiber-angles due to
training was observed.
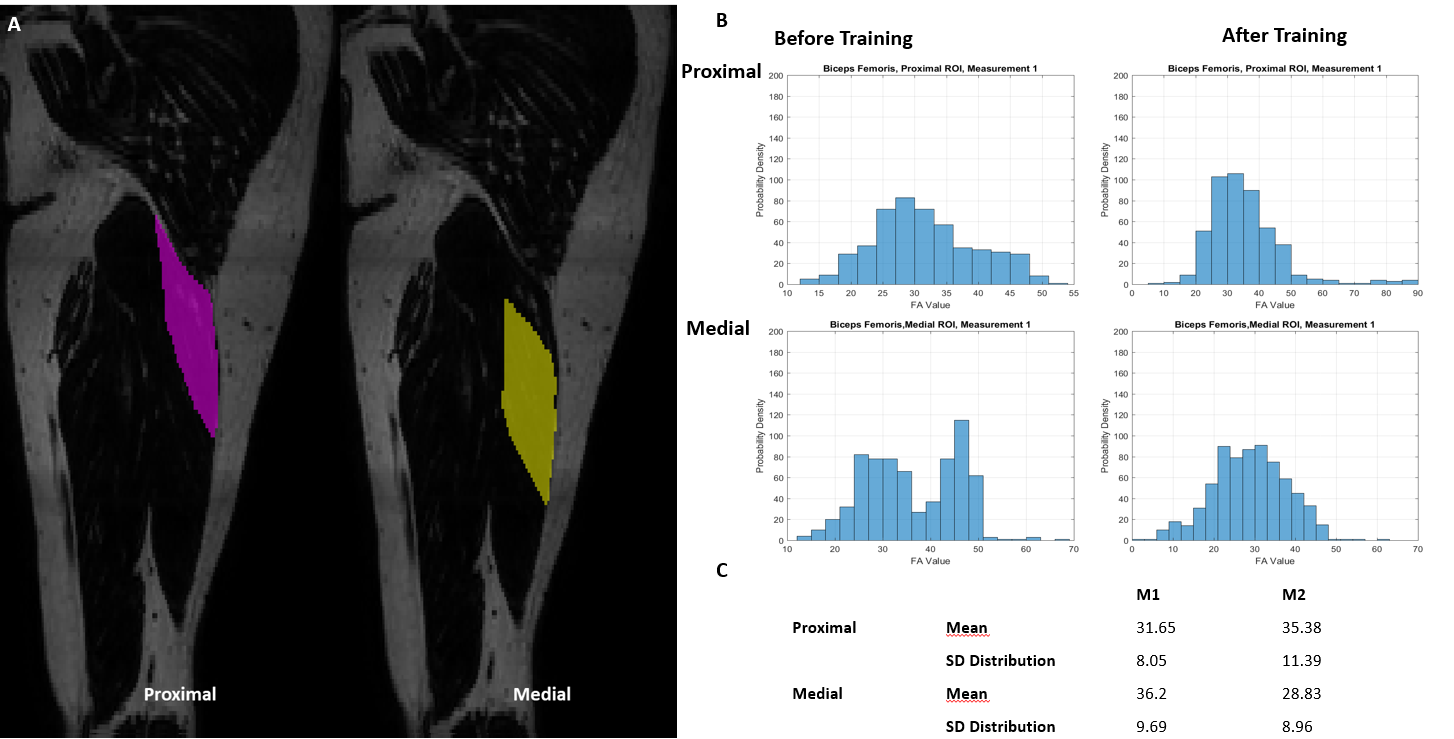
Figure 5: Exp.3: (A) Proximal and medial ROIs in the
Biceps Femoris muscle of a representative subject. (B) Fiber-angle
distributions in proximal and medial ROIs before and after the training
intervention. (C) Mean values and standard
deviation of the distributions.