2714
Evaluation of Interrater comparability of manual and tractography based thigh muscle segmentation of diffusion tensor images1Neurology, BG UK Bergmannsheil, Bochum, Germany, 2Radiology, UMC Utrecht, Utrecht, Netherlands
Synopsis
Muscle diffusion tensor imaging is a quantitative magnetic resonance image (MRI) technique, which can provide information about muscular microstructure and integrity. Due to high intermuscular variability, the manual separation of the muscles is essential. Here, we have compared three methods, which allow assessing of diffusion properties of the thigh muscles. In each of the three investigated methods, two independent raters performed the muscle segmentation. We could show, that volume-based tractography proved to be the most reliable and robust method (ICC = 0.923-0.985) and has the advantage to achieve additional information about muscle architecture.
Introduction
Muscle diffusion tensor imaging is a quantitative magnetic resonance image (MRI) technique, which can provide information about muscular microstructure and integrity. Separation of different muscles is essential to evaluate intermuscular differences and variances, which have been described by different anatomical, ultrasound and DTI studies. The commonly used methods to assess DTI metrics in different muscles are manual segmentation-based parameter maps, ROI based tractography or volume-based tractography. All these methods require manual intervention by either drawing ROIs to segment fibers gained from tractography or by segmenting the muscle tissue slice-by-slice on an anatomical image and may therefore have a subjective bias. To circumvent this bias and to allow pooling data from different cohorts, it is important to mitigate the effect of interrater reliability. Therefore, the purpose of the present study was to compare three different methods to evaluate diffusion metrics with respect to their inter-rater reliability and their ability to detect intramuscular differences. The three methods are i) manual segmentation (MSB), ii) tract-based analysis (TBA) and iii) volume-based tractography (VBT).Methods
30 healthy volunteers underwent a magnetic resonance (MR) examination in a 3T scanner and 16-channel Torso XL coil of the upper legs. Participants were instructed to lie still in a feet-first supine position. The MRI protocol included T1-weighed (T1w) for an anatomical reference, T2-weighed as well as SE-EPI DWI in an axial slice order from proximal to distal (total acquisition time 27 minutes). To avoid shimming artifacts due to large field of view (FOV) the upper leg region was divided into three FOV’s of 480x264x150mm³ along the z-axis (stacks). For accurate merging, the stacks had an overlap of 10mm. Data was preprocessed akin to Schlaffke et al using QMRITools software (Mathematica 11)1–3. In short, DWI data were merged, denoised and motion corrected by registration to the T2-data. Tensors were estimated using the Matlab-based toolbox ExploreDTI and a ROBUST tensor estimation approach 4,5. Subsequently, deterministic whole leg fiber tracking was performed using ExploreDTI (Matlab)6 using a maximum angle of 15°, a FA range of 0.1 – 0.6 and 1.5mm step size 3,7 and parameter maps for FA, MD, RD and λ1 were calculated. Separation of six thigh muscles (biceps femoris, semimembranosus, semitendinosus, rectus femoris, vastus lateralis and vastus medialis) was performed using three methods by two independent raters each: i) based on the T1w images, the masks were then smoothed, eroded, registered to diffusion space and overlaid on the parameter maps (MSB). ii) by drawing gates within ExploreDTI based on the whole leg tractography to obtain fiber bundles for each muscle separately (TBA). iii) Masks from MSB were used to split the preprocessed diffusion data to perform tractography within the resulting segments (VBT; see Figure 1 for schematic overview). The inter-rater reliability was assessed using ICC analysis, Pearson correlations and Bland-Altman plots.Results
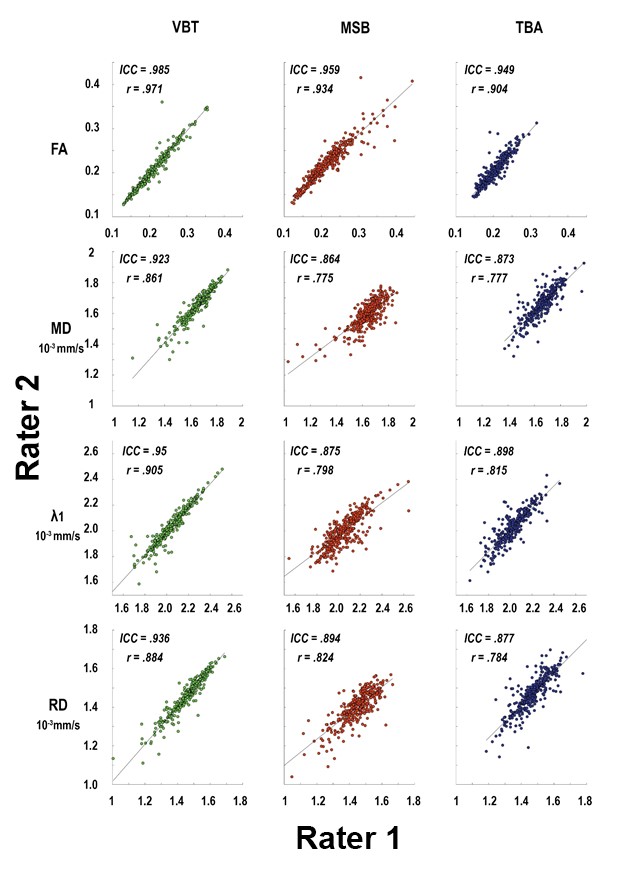
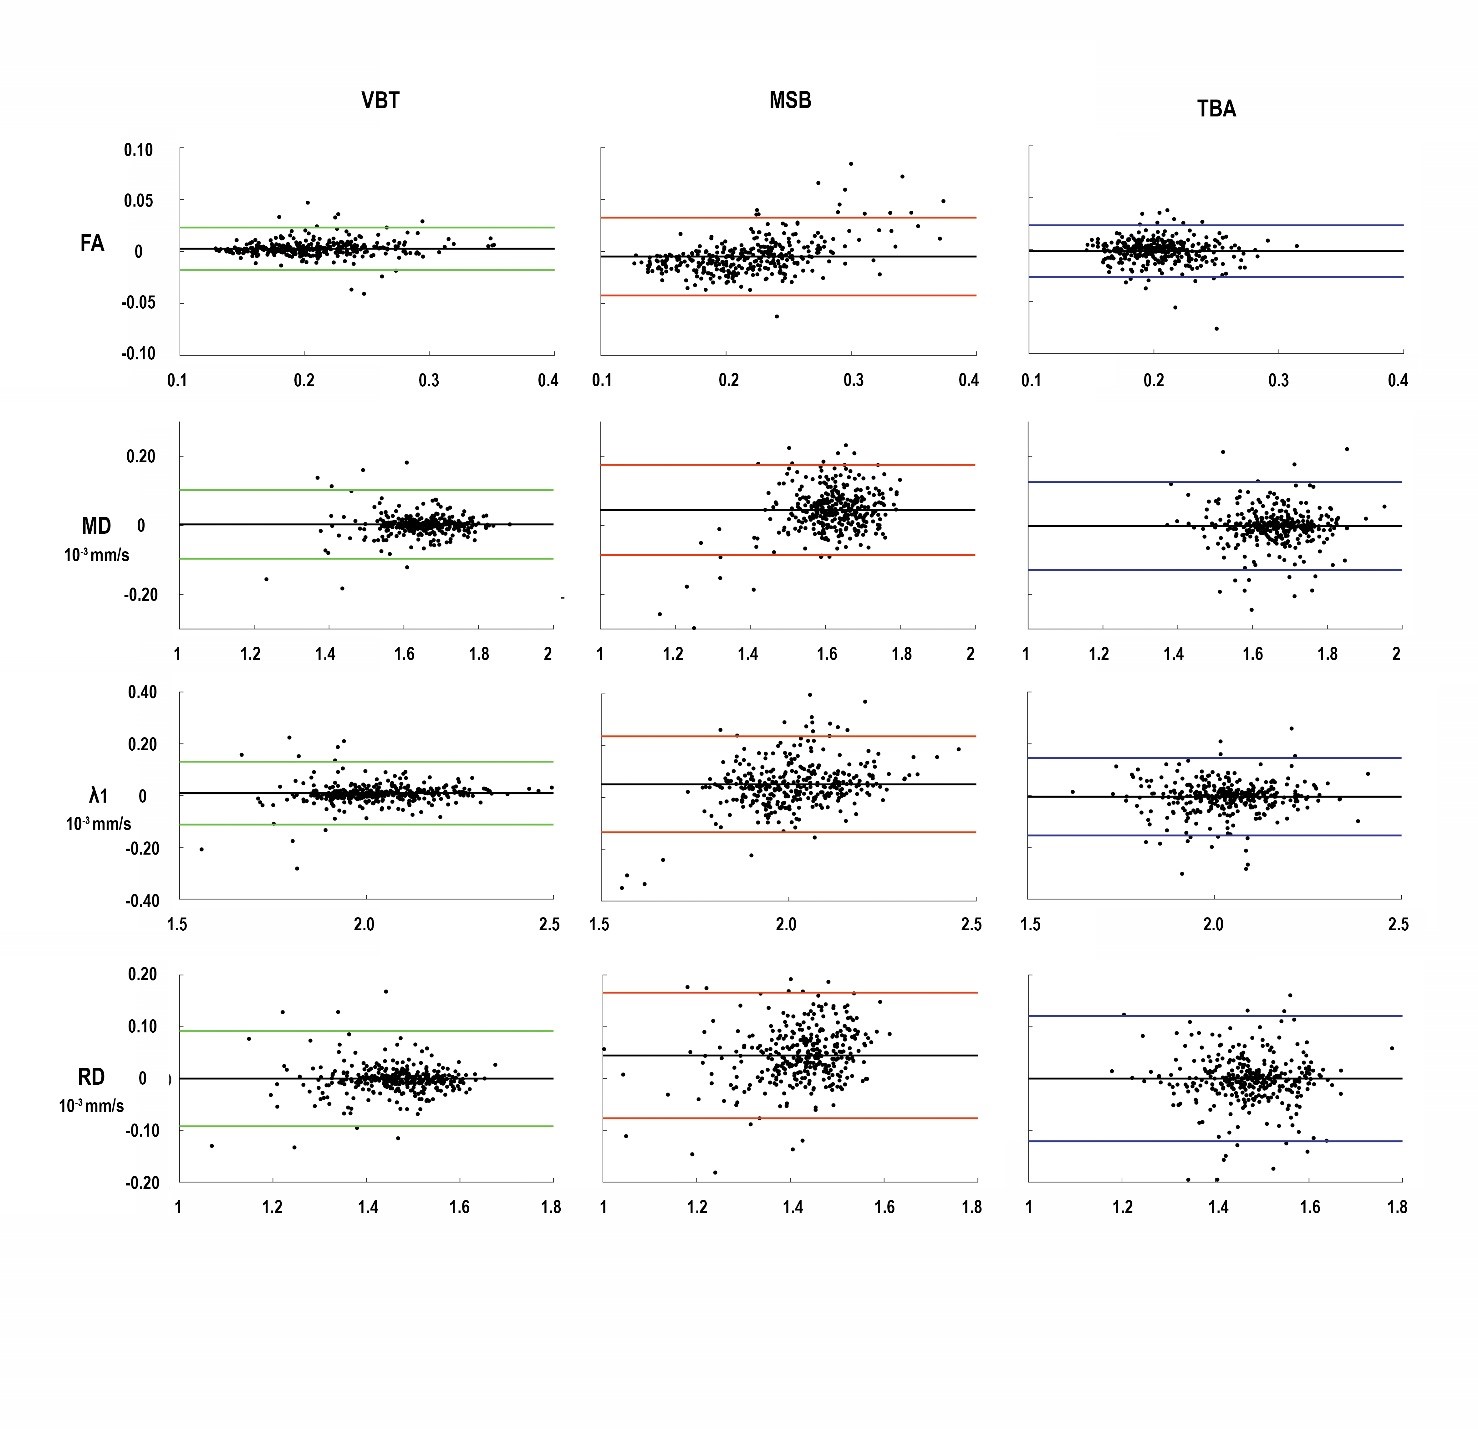
The scatter plots in Figure 2 illustrate the correlation of interrater measurements including Pearson correlation coefficient (r) and intraclass-correlation coefficient (ICC) in each graph. Inter-rater reliability for all methods in all muscles was high, with all ICC greater than 0.864. Highest inter-rater reliability for all diffusion parameters was found for VBT (ICC ≥ 0.923; see Fig 3). Pearson correlation coefficient showed a strong correlation between raters (r ≥ 0.775). The highest correlation between raters was found for VBT (r ≥ 0.861). Bland-Altman Plots show the lowest limits of agreement for VBT (see Figure 3).Discussion
In MSB each voxel is weighted equally, which means that one sample is obtained for each voxel. Thus, in comparison to tract-based analysis less data points are generated. Furthermore, in MSB analysis requires no tractography and is therefore not susceptible to low SNR regions where tractography fails. In comparison TBA achieves similar robust results in the assessment of intramuscular variability and rater dependency, but TBA weights the diffusion information on tract density. In regions with reliable and homogeneous diffusion signal - e.g. in tightly packed muscle belly of a healthy muscle – more and longer fiber tracts are generated as in regions of muscle fascia and aponeurosis. The diffusion metrics in tractography are calculated for each step of the fiber tracts. Therefrore, regions with a higher tract density are overrepresented and influence the result of total muscle diffusion data. For VBT interrater-reliability was found to be highest for all assessed diffusion parameters (ICC ≥ 0.92). Here, the weighting of the diffusion information is the same as in TBA, however, by restricting the tractography within a mask, no fibers may be calculated outside the specified volume. This indicates that DTI data should be analyzed by volume-based tractography to achieve robust and reliable results, when multiple raters are taking into consideration or when pooling data from different centers.Conclusion
Diffusion data can be assessed by both tractography and manual segmentation with high inter-rater reliability, with VBT proved to be the most reliable. Although volume-based tractography as well as tract-based analysis have the advantage to achieve additional information about muscle architecture, they may miss pathological muscle regions in patients. This should be taken into consideration, when choosing either one of those methods for muscle segmentation.Acknowledgements
We thank Philips Germany for continuous scientific support and specifically Dr. Burkhard Mädler for valuable discussion. JF and LS received funding from the Deutsche Forschungsgemeinschaft Projectnumber 122679504 SFB874 (TP-A1 to JF, TP-A5 to LS).References
1. Schlaffke L,
Rehmann R, Rohm M, et al. Multicenter evaluation of stability and
reproducibility of quantitative MRI measures in healthy calf muscles. NMR
Biomed. 2019:1-14. doi:10.1002/nbm.4119  .
.
2. Froeling M.
QMRTools: a Mathematica toolbox for quantitative MRI analysis. J. Open
Source Softw. 2019;4(38):1204. doi:10.21105/joss.01204
3. Schlaffke L, Rehmann R, Froeling M, et al. Diffusion Tensor Imaging of the Human Calf : Variation of Inter- and Intramuscle-Specific Diffusion Parameters. J Magn Reson Imaging 2017:1-12.
4. Leemans A, Jeurissen B, Sijbers J, Jones DK. ExploreDTI: a graphical toolbox for processing, analyzing, and visualizing diffusion MR data. 17th Annu. Meet. Intl Soc Mag Reson Med 2009:3537.
5. Tax CMW, Otte
WM, Viergever M a, Dijkhuizen RM, Leemans A. REKINDLE: Robust extraction of
kurtosis INDices with linear estimation. Magn. Reson. Med.
2015;73(2):794-808. doi:10.1002/mrm.25165 .
6. Basser PJ, Pajevic S, Pierpaoli C, Duda J, Aldroubi A. In Vivo Fiber Tractography Using DT-MRI Data. Magnenetic Reson. Med. 2000;44:625-632.
7. Froeling M, Oudeman J, Strijkers GJ, et al. Muscle Changes Detected with Diffusion-Tensor Imaging after Long-Distance Running. Radiology 2015;274(2):548-562.
Figures