2713
Muscle Diffusion tensor imaging shows changes in non-fat infiltrated muscles in late-onset Pompe disease (LOPD)1Neurology, BG UK Bergmannsheil, Bochum, Germany, 2Radiology, UMC Utrecht, Utrecht, Netherlands
Synopsis
Quantitative MRI-markers are essential for monitoring disease progression in late-onset pompe disease (LOPD). Using muscle diffusion tensor imaging (mDTI) and mDixon we evaluated differences in diffusion parameters in six thigh and seven calf muscles - with <10% and >10% fat-fraction - of 18 LOPD and 29 healthy controls (HC). Upper leg muscles with <10% fat-fraction showed significant differences in MD, RD, λ1-3 and MD positively correlated with 6-MWT (p=0.003). mDTI reveals an increased diffusion restriction in muscles of LOPD-patients with and without fat-infiltration and could reflect structural changes prior to fatty degeneration.
Introduction
Patients with late-onset glycogen storage disease type II, i.e. Pompe disease, (LOPD) show symptoms from elevated serum creatine-kinase to slowly progressive limb girdle weakness. To monitor therapeutic approaches and the disease course, non-invasive quantitative imaging markers are essential1. In LOPD and dystrophic myopathies Dixon imaging quantify fatty degeneration over time and is able to measure disease progression on an individual basis when fatty degeneration is already irreversibly present2–7. Muscle diffusion tensor imaging (mDTI) provides information about muscular microstructure and integrity by quantifying the directional diffusion properties of water molecules in muscle tissue8–10. By quantifying water diffusion in muscles, mDTI could provide additional sensitive information about change is muscle tissue prior to fat infiltration. Since mDTI is sensitive for changes in water diffusion, it could be highly susceptible towards the intracellular pathology in LOPD and therefore give additional information about muscles that are not yet affected by fatty degeneration. Therefore, the purpose of this study was to evaluate differences in diffusion parameters in thigh and calf muscles in LOPD patients, which do not yet exhibit fat infiltration (<10% fat fraction) using muscle diffusion tensor imaging (mDTI) and mDixon compared to healthy controls (HC).Methods
In this prospective study, we evaluated thigh and calf-muscles of 18 LOPD patients and 29 HC. MRI scans were performed at 3T and comprised muscle diffusion tensor imaging (SE-EPI), T2-weighted and mDixonquant imaging. Data preprocessing was performed akin to Schlaffke et al., 11,12 using QMRITools13. In short, diffusion data were denoised using a principal component analysis method. Next, the diffusion data was corrected for subject motion and eddy current distortions using affine registration and aligned to T2-data using non-rigid registration. The diffusion tensor was estimated using an iWLLS tensor estimation with outlier detection14. Mean values of the eigenvalue (λ1), mean diffusivity (MD), radial diffusivity (RD) and fractional anisotropy (FA) were obtained from deterministic tractography for six separated thigh and seven separated calf muscles in both legs. Available fat fractions were compared between LOPD patients and healthy controls using 2-sample t-Tests for thigh and calf muscles separately. In a subsequent analysis, all single muscles with a fat fraction higher than 10% (or without assessed fat fraction) were excluded, to evaluate the diffusion differences between controls and low-fat LOPD muscles. Furthermore, 6-minute-walking-test (6-MWT) data was obtained in 15/18 LOPD patients and correlated with mDTI metrics.Results
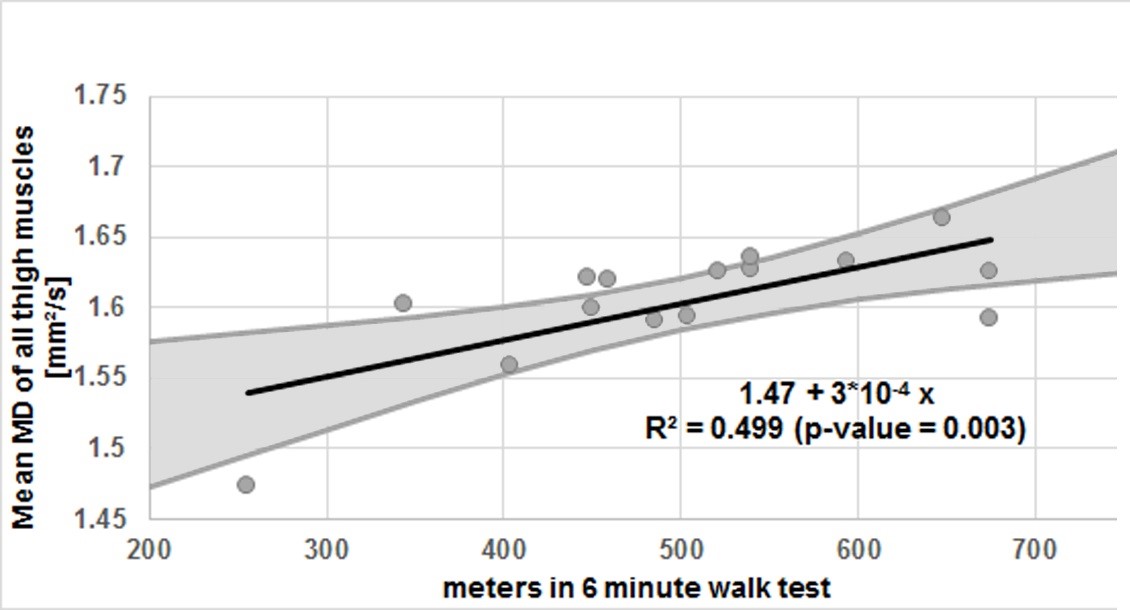
In all muscles the SNR, which was estimated based on the noise measures, was comparable between groups: Control: mean 41.7±9, LOPD patients: mean 40.0±8 (p = 0.166). For the thigh muscles all diffusion parameters were significantly different between patients and controls (all p < 0.004). In the calf, all parameters except for FA (p=0.731) showed a significant difference (all p < 0.044). See Figure 1 for example images of a patient and a matched control. For calf muscles with <10% fat fraction no significant differences were found in any of the diffusion parameters. In contrast, in thigh muscles with less than 10% fat fraction, all diffusion parameters, except FA, still showed significant differences. In these thigh muscles, we found that all DTI parameters were lower in patients compared to controls. For λ1, MD and RD, the differences reached significance with a p-value < 0.0001. Figure 1 shows the mean values of the diffusion parameters of the low-fat thigh muscles separately. Mean and radial diffusivity is higher in controls compared to patients in all six thigh muscles (see Figure 2). Furthermore, the mean diffusivity of the thigh muscles positively correlated significant (p=0.003) with the walking distance (in meter) that was achieved during the 6 minute walk test (See Figure 3). Other diffusion parameters did not show a significant correlation with the 6 minute walk test.Discussion
We could show that in the analysis of all thigh muscles, all mDTI metrics were significantly different between the groups. In the calf muscles, this was also seen except for the FA. The calf muscles are known to be affected at a later disease stage. These results were expected, since the degree of muscle degeneration with all muscles included was also considerable. Muscles that already show fatty degeneration in mDixon imaging and T1w images are expected to be impaired in diffusion. Interestingly in thigh muscles with a fat fraction of <10% the mDTI metrics MD, RD and λ1 were also significantly different as compared to the healthy control group. This demonstrates that mDTI could be able to capture disease specific structural alterations in skeletal muscles of LOPD patients with a yet normal fat fraction. The 6MWT data of our LOPD group are in line with previously reported data according walking distance in LOPD15.Conclusion
mDTI metrics could reveal significant diffusion restrictions in muscles of LOPD patients without fat infiltration and thus reflect possible structural abnormalities in muscles of LOPD patients prior to fatty degeneration. Furthermore, we found a high correlation between MD and the 6MWT, which is currently the clinical gold-standard. Taken together, we hypothesize that mDTI might be a quantitative method for the evaluation of disease progression in LOPD.Acknowledgements
This work was funded by a research grant from Sanofi-GenzymeReferences
1. Strijkers GJ,
Araujo ECA, Azzabou N, et al. Exploration of new contrasts, targets, and MR
imaging and spectroscopy techniques for neuromuscular disease-A workshop report
of working group 3 of the biomedicine and molecular biosciences COST action
BM1304 MYO-MRI. J. Neuromuscul. Dis. 2019;6(1):1-30.
doi:10.3233/JND-180333  .
.
2. Carlier PG, Marty B, Scheidegger O,
Loureiro P, Sousa D. Skeletal Muscle Quantitative Nuclear Magnetic Resonance
Imaging and Spectroscopy as an Outcome Measure for Clinical Trials. J.
Neuromuscul. Dis. 2016;3:1-28. doi:10.3233/JND-160145 .
3. Horvath JJ, Austin SL, Case LE, et al.
Correlation between quantitative whole-body muscle magnetic resonance imaging
and clinical muscle weakness in pompe disease. Muscle and Nerve
2015;51(5):722-730. doi:10.1002/mus.24437 .
4. Willis TA, Hollingsworth KG, Coombs A, et
al. Quantitative Muscle MRI as an Assessment Tool for Monitoring Disease
Progression in LGMD2I: A Multicentre Longitudinal Study. PLoS One
2013;8(8):6-12. doi:10.1371/journal.pone.0070993 .
5. Figueroa-Bonaparte S, Segovia S, Llauger
J, et al. Muscle MRI findings in childhood/adult onset pompe disease correlate
with muscle function. PLoS One 2016;11(10):1-19.
doi:10.1371/journal.pone.0163493 .
6. Morrow JM, Sinclair CDJ, Fischmann A, et
al. MRI biomarker assessment of neuromuscular disease progression: A
prospective observational cohort study. Lancet Neurol. 2016;15(1):65-77.
doi:10.1016/S1474-4422(15)00242-2 .
7. Carlier PG, Marty B, Scheidegger O, et
al. Skeletal Muscle Quantitative Nuclear Magnetic Resonance Imaging and
Spectroscopy as an Outcome Measure for Clinical Trials. J. Neuromuscul. Dis.
2016;3(1):1-28. doi:10.3233/JND-160145 .
8. Budzik J-F, Balbi V, Verclytte S, Pansini V, Thuc V Le, Cotten A. Diffusion Tensor Imaging in Musculoskeletal Disorders. RadioGraphics 2014;34(3):E56-E72.
9. Damon B, Li K, Bryant ND. Magnetic
resonance imaging of skeletal muscle disease. In: Handbook of Clinical
Neurology.Vol 136.; 2016:827-842. doi:10.1016/B978-0-444-53486-6.00041-7 .
10. Oudeman J, Nederveen AJ, Strijkers GJ, Maas
M, Luijten PR, Froeling M. Techniques and applications of skeletal muscle
diffusion tensor imaging: A review. J. Magn. Reson. imaging 2015:1-16.
doi:10.1002/jmri.25016 .
11. Schlaffke L, Rehmann R, Froeling M, et al. Diffusion Tensor Imaging of the Human Calf : Variation of Inter- and Intramuscle-Specific Diffusion Parameters. J Magn Reson Imaging 2017:1-12.
12. Schlaffke L, Rehmann R, Rohm M, et al.
Multicenter evaluation of stability and reproducibility of quantitative MRI
measures in healthy calf muscles. NMR Biomed. 2019:1-14.
doi:10.1002/nbm.4119 .
13. Froeling M. QMRTools: a Mathematica toolbox
for quantitative MRI analysis. J. Open Source Softw. 2019;4(38):1204.
doi:10.21105/joss.01204 .
14. Veraart J, Novikov DS, Christiaens D,
Ades-aron B, Sijbers J, Fieremans E. Denoising of diffusion MRI using random
matrix theory. Neuroimage 2016;142:394-406. Available at:
http://dx.doi.org/10.1016/j.neuroimage.2016.08.016 .
15. Van Der Ploeg AT, Clemens PR, Corzo D, et
al. A randomized study of alglucosidase alfa in late-onset Pompe’s disease. N.
Engl. J. Med. 2010;362(15):1396-1406. doi:10.1056/NEJMoa0909859 .
Figures