2710
The effect of ageing on skeletal muscle as assessed by quantitative MR imaging: an association with frailty and muscle strength1University of Leeds, Leeds, United Kingdom
Synopsis
The proportion of older people in the population is increasing. It is known that muscle health deteriorates with age, resulting in a loss of muscle mass and strength, known as sarcopenia. This study demonstrates that ageing is associated with a significant increase in fat fraction and T2 and a significant decrease in muscle volume, grip strength and muscle power. Quantitative MRI parameters correlated with frailty index, grip strength and muscle power. Therefore, quantitative MRI measurements have the potential to be useful markers of age and muscle health and can be used in the management and treatment of sarcopenia and frailty.
Background:
The proportion of older people in the population is increasing, from 461 million people older than 65 years in 2004 to an estimated 2 billion people by 2050 (1,2). Skeletal muscles undergo changes with ageing, including myosteatosis, fatty infiltration, atrophy and changes in muscle microstructure, which can result in an increased risk of serious injury from sudden falls and sudden fracture, especially if the thigh muscles are compromised (3). These changes to skeletal muscle can cause sarcopenia which can result in frailty. The criteria for sarcopenia include low muscle mass, low physical function, and low muscle strength. Up to 50% of people older than 85 years are estimated to be frail, and these people have a substantially increased risk of falls, disability, long term care, lower quality of life and death (4). In the search for interventions to reduce frailty, the identification of sub-clinical muscular features using MRI offers many opportunities. It has the potential to enable better targeting of interventions based on well defined quantitative measures that are associated with frailty. Quantitative MRI may detect the muscle deficit component of sarcopenia and frailty by measuring fat fraction, T2, muscle volume and diffusion, which could help improve the understanding of muscle pathology. The aims of this study where to investigate whether MRI-based measurements of quantitative T2, fat fraction (FF), diffusion tensor imaging (DTI) and muscle volume can detect differences within the muscles between young, middle and older participants and to assess for the first time how these measures compare with frailty index, gait speed and muscle power measurements.Methods:
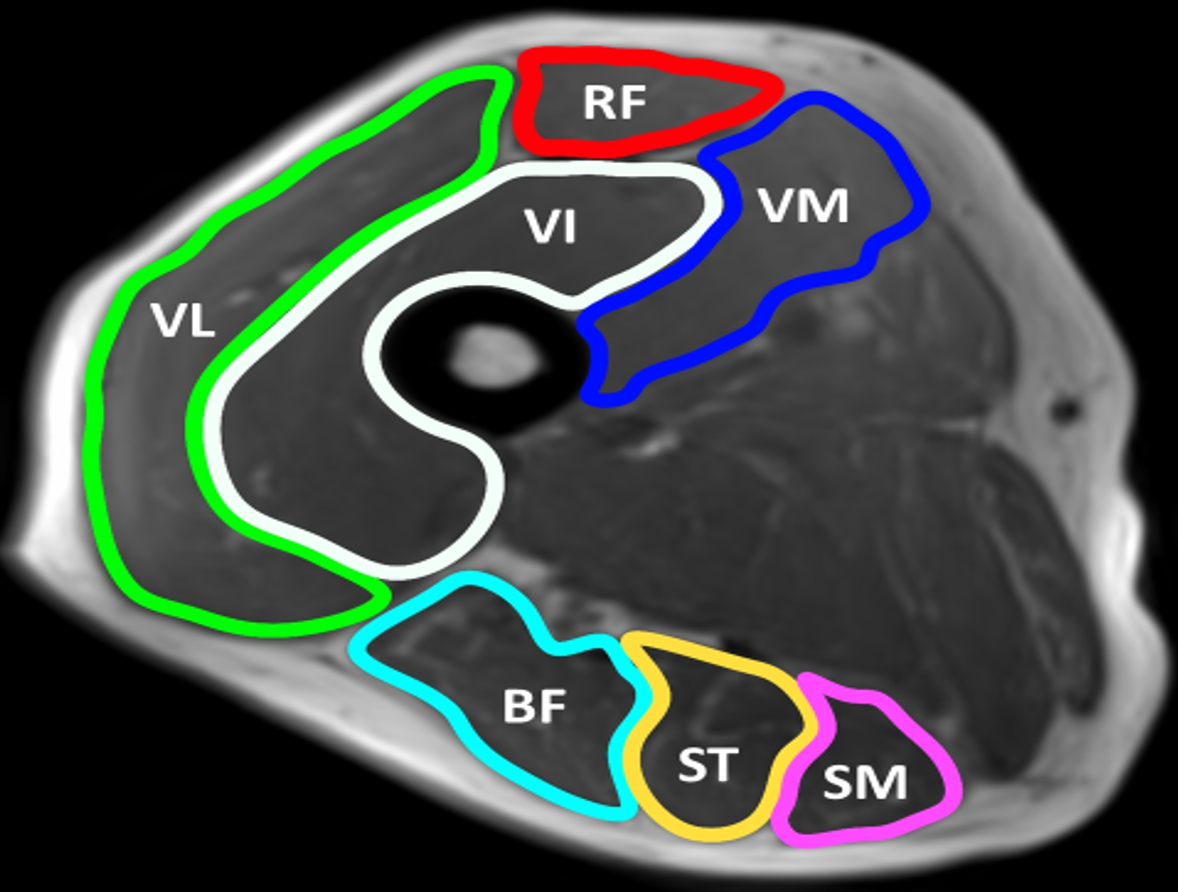
This study was conducted using a cross-sectional design. 18 ‘young’ (range 18-30 years), 18 ‘middle-aged’ (31-68 years) and 18 ‘older’ (>69 years). The age classifications were based on the European MyoAge study (5). MR data was acquired using a MAGNETOM Verio 3T MR scanner. Two small four-channel flex coils were wrapped around the dominant thigh and placed with the distal end of both coils positioned 4cm from the superior edge of the patella. Muscle volume, T2, fat fraction and diffusion were measured. Regions of interest were contoured around the individual muscles of the hamstrings and quadriceps. STEAM-EPI imaging sequence was used to measure diffusion along 6 diffusion directions, 2-point Dixon imaging to assess fat fraction and a fat-suppressed turbo-spin echo (TSE) sequence to measure the transverse relaxation time (T2). For T2 measurements, axial images were obtained using a T2 weighted, multi-slice echo (MESE) sequence, with SPAIR fat suppression with an echo train length of 16, and echo times of 9.6, 19.2, 28.8, 38.4, 48.0, 57.6, 67.2, 76.8, 86.4, 96.0, 105.6, 115.2, 124.8, 134.4, 144.0, 153.6ms and a repetition time of 1500ms.Frailty was assessed using the English Longitudinal Study of Ageing (ELSA) frailty index. All participants had knee extension and flexion power measured using an isokinetic knee extension-flexion (concentric-concentric) dynamometer at 60 degrees a second and handgrip strength measured using an isometric handheld dynamometer. Gait speed was measured by conducting the 4m walk test.
Offline image analysis was performed using MATLAB. Statistical analyses were performed using SPSS. One-Way ANOVA with Bonferroni post hoc analysis was used to test for significant differences. Spearman's rank correlation was used to measure correlation.
Results:
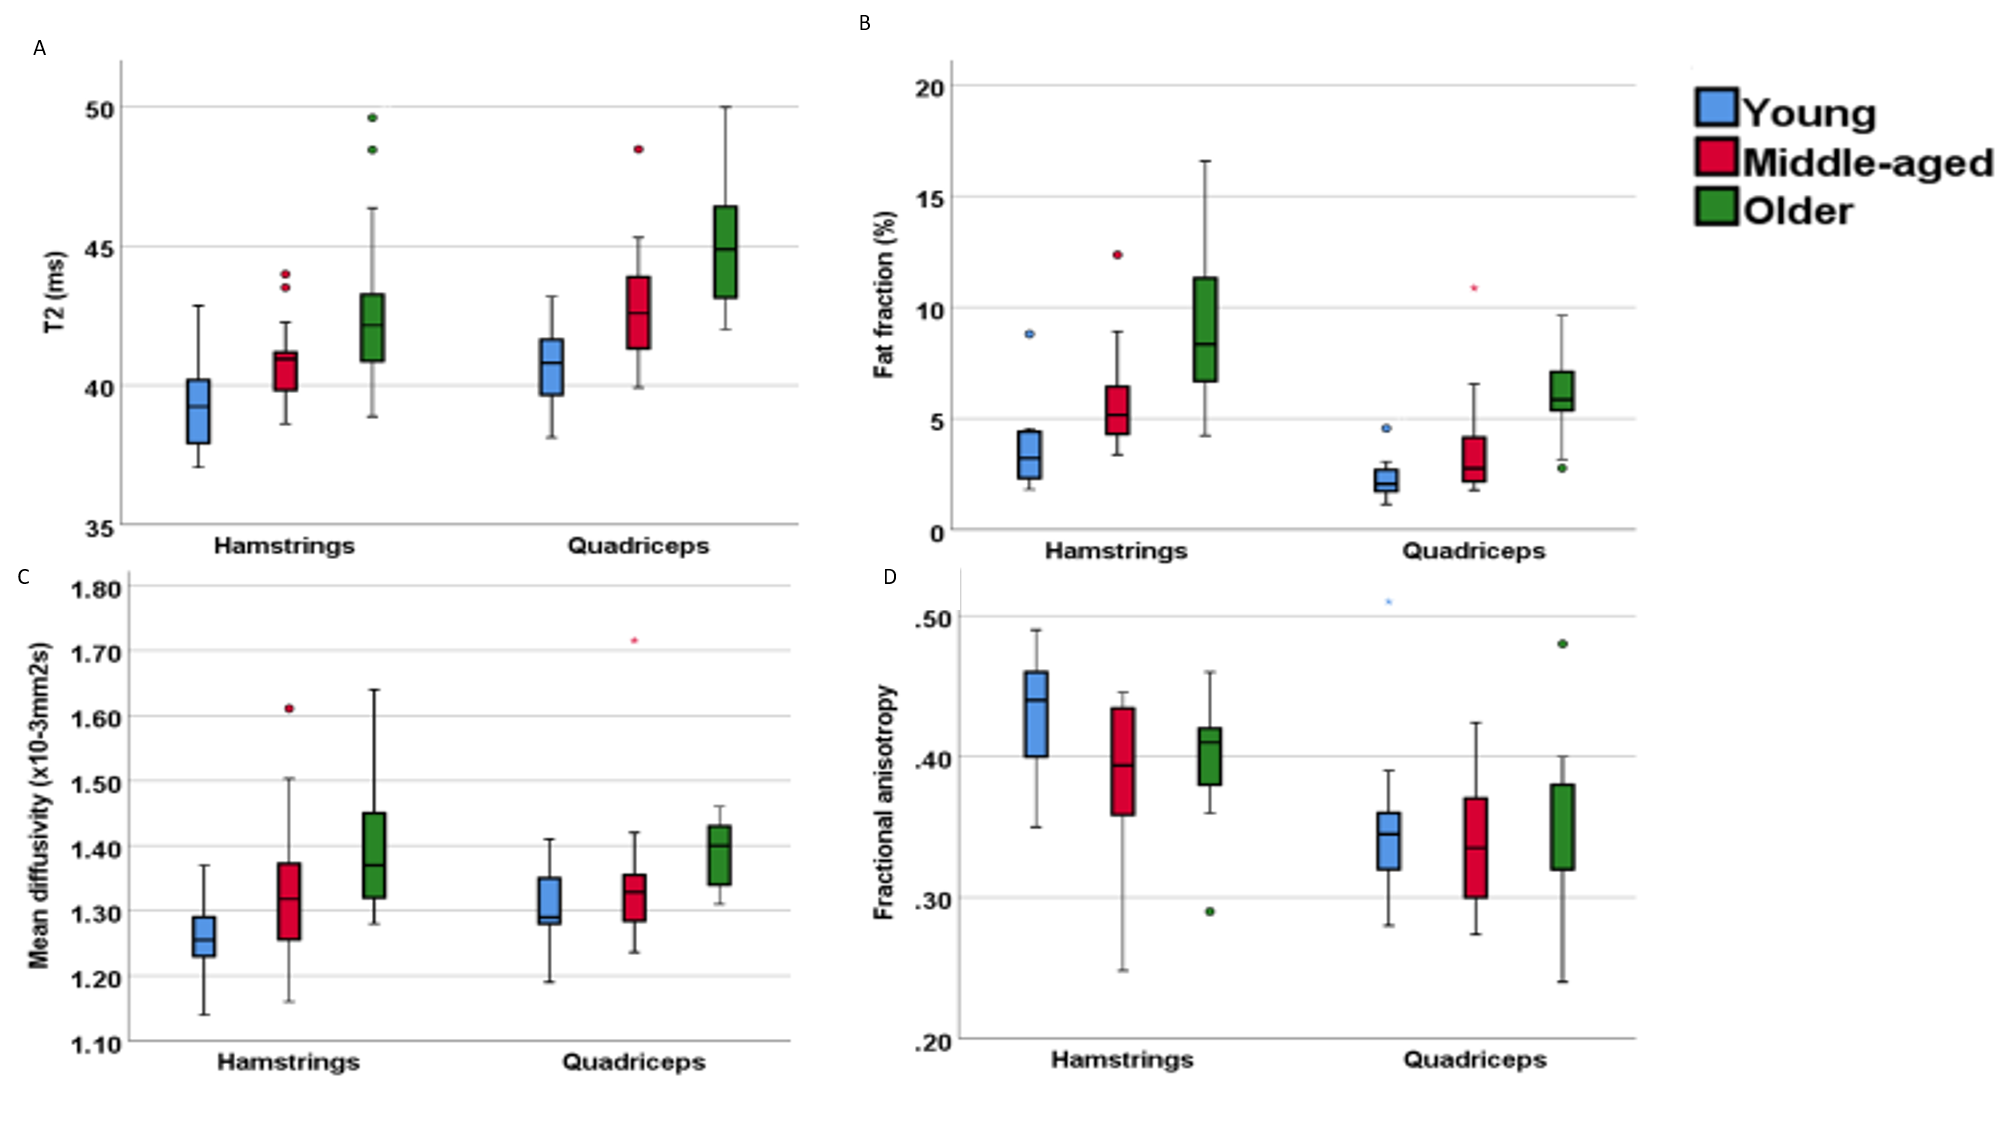
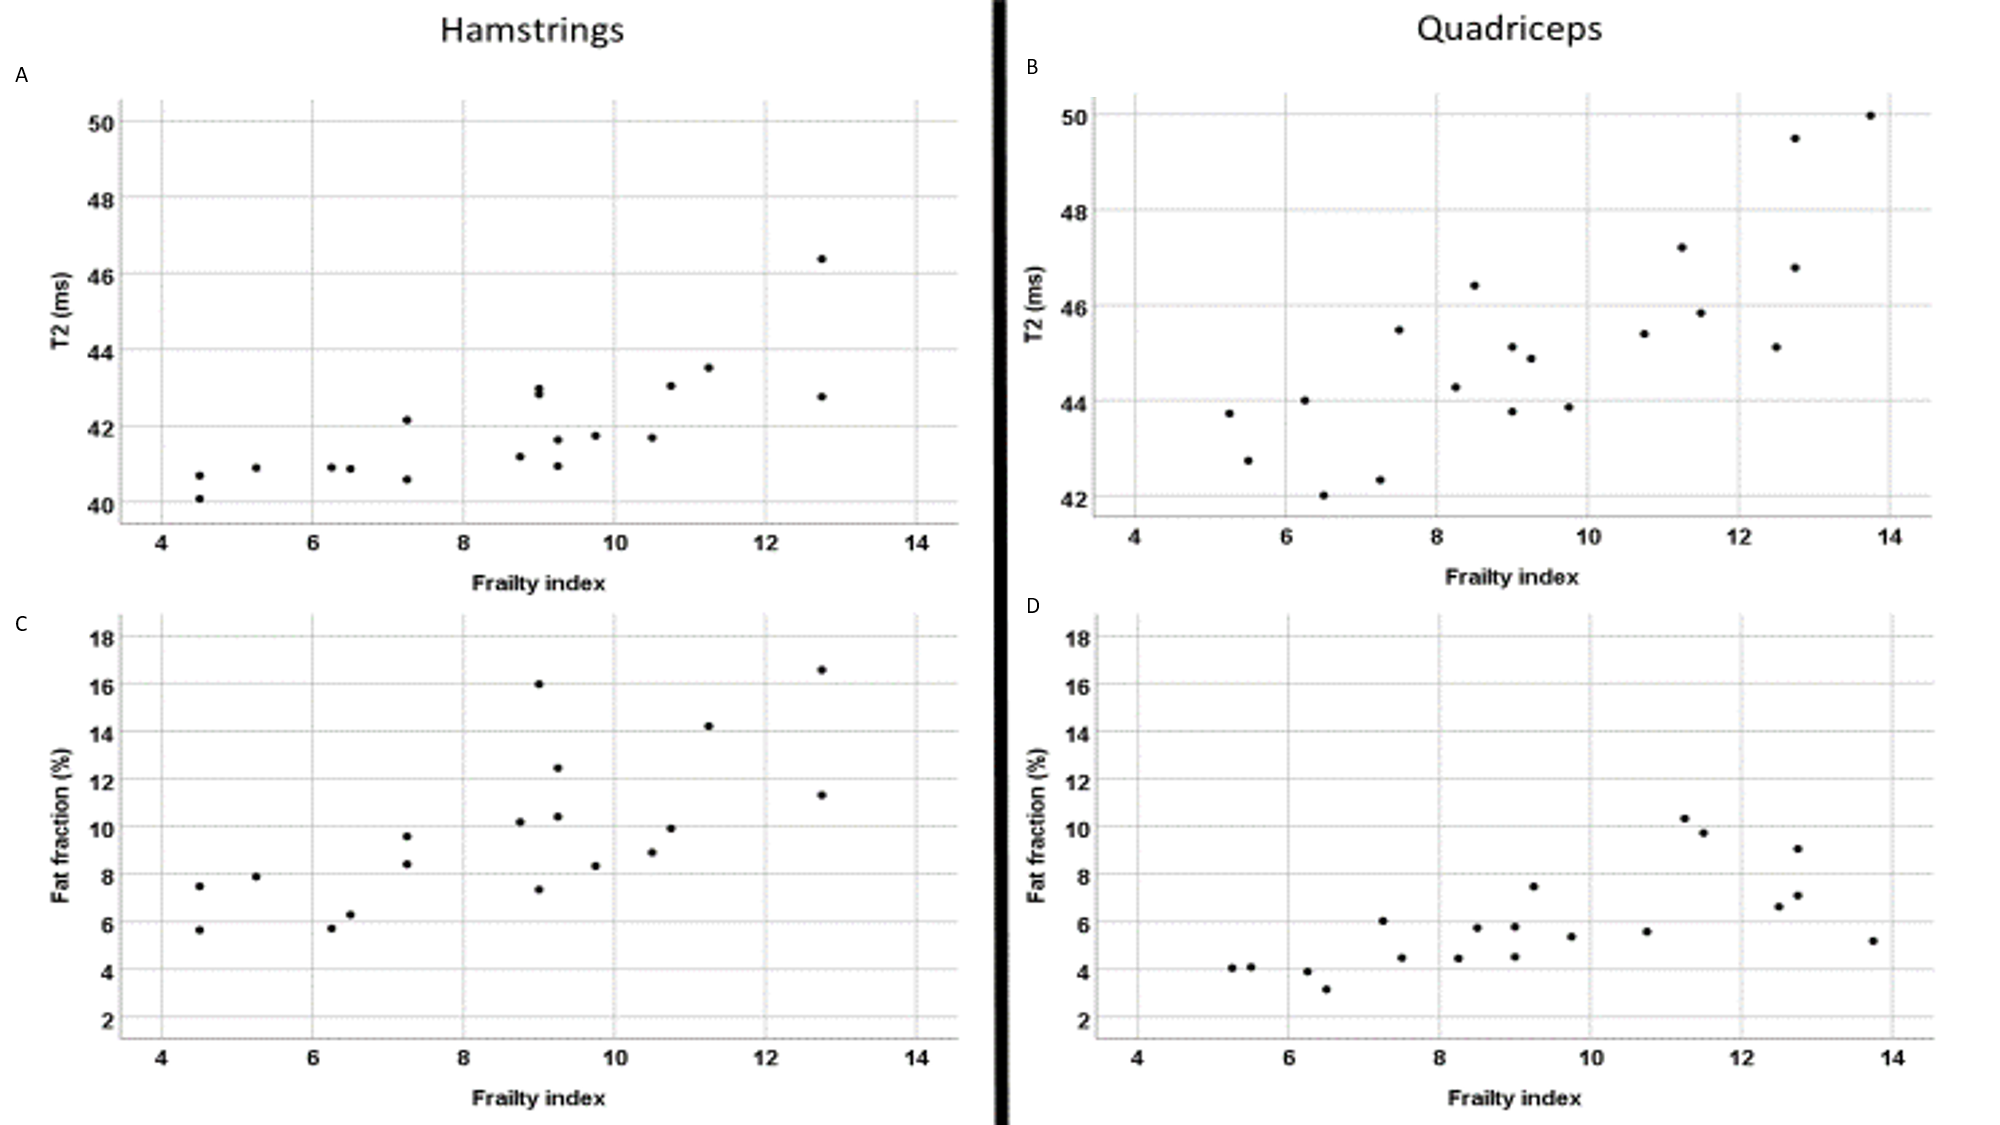
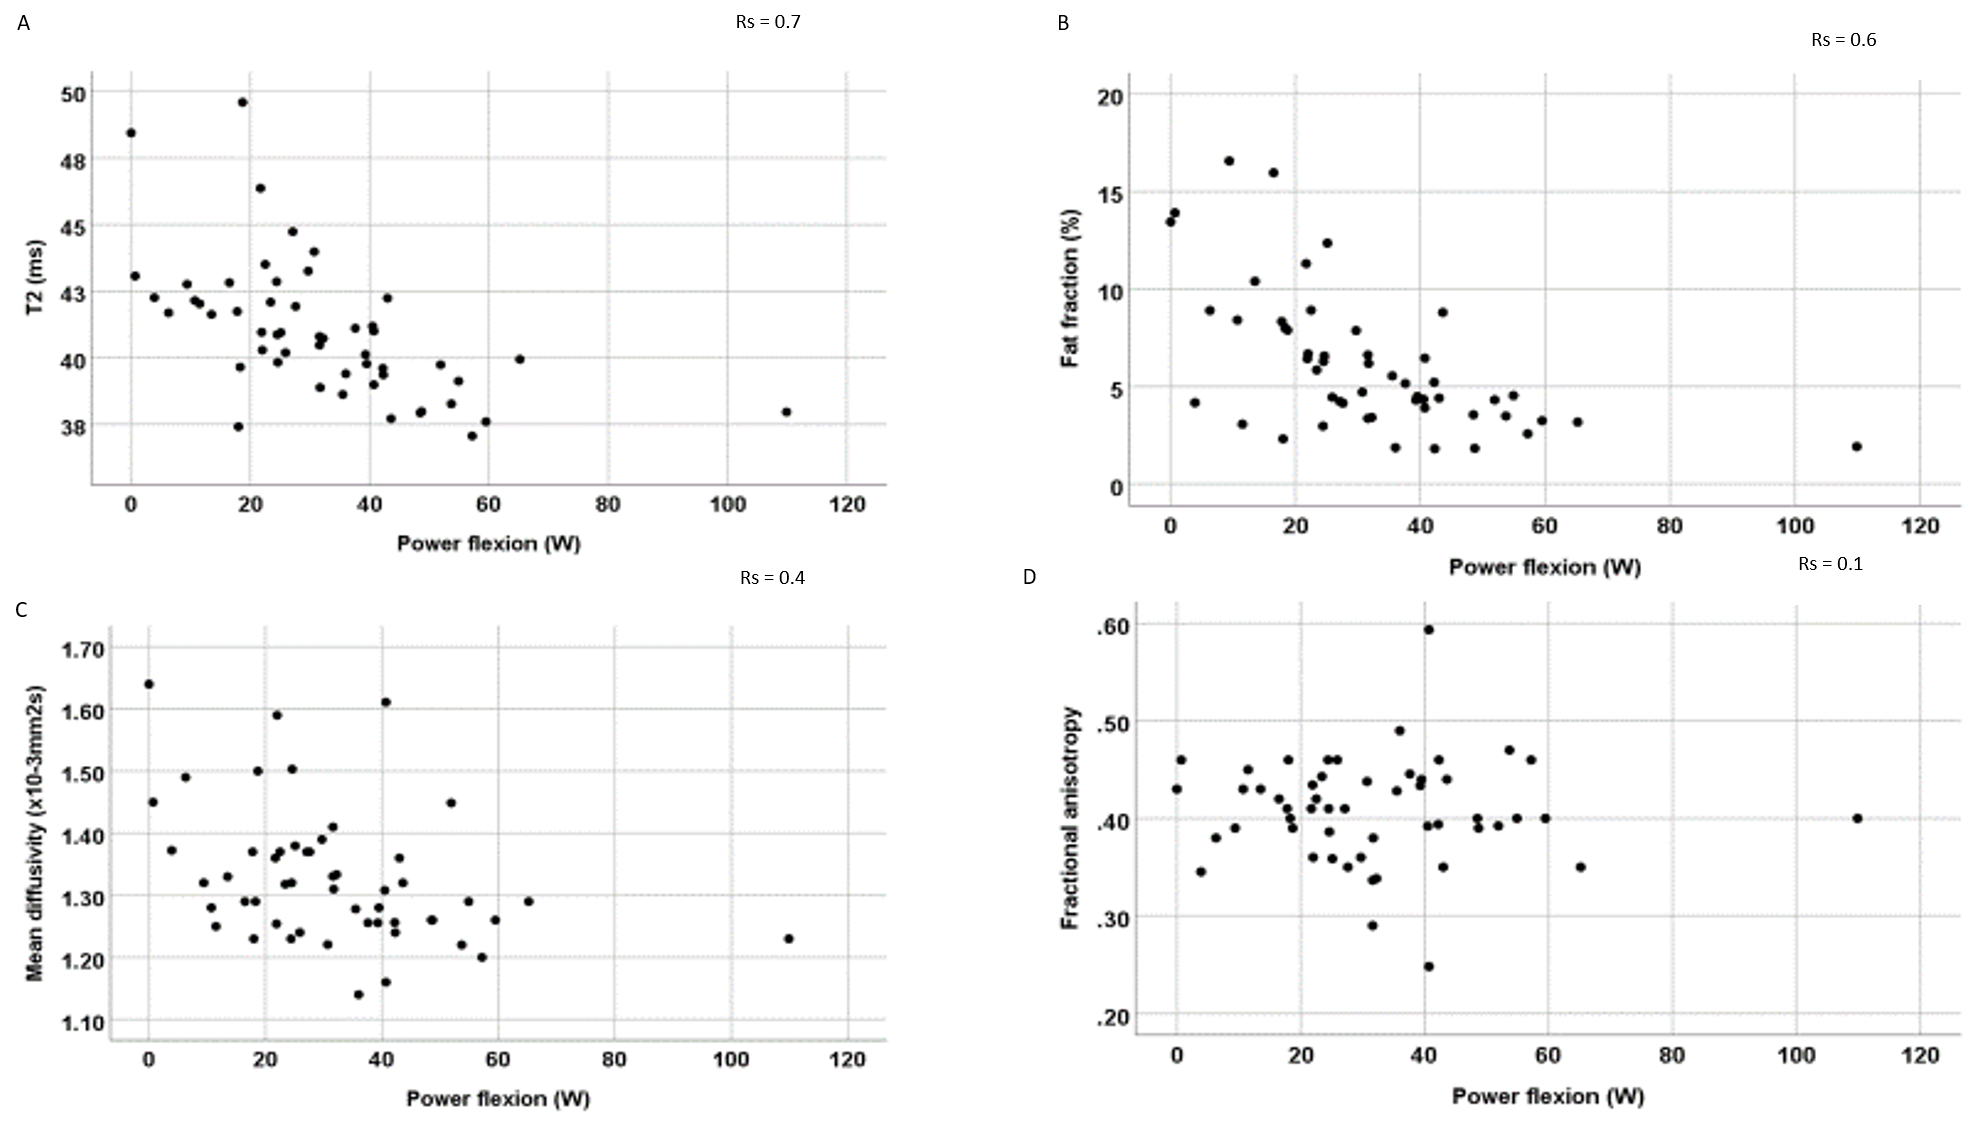
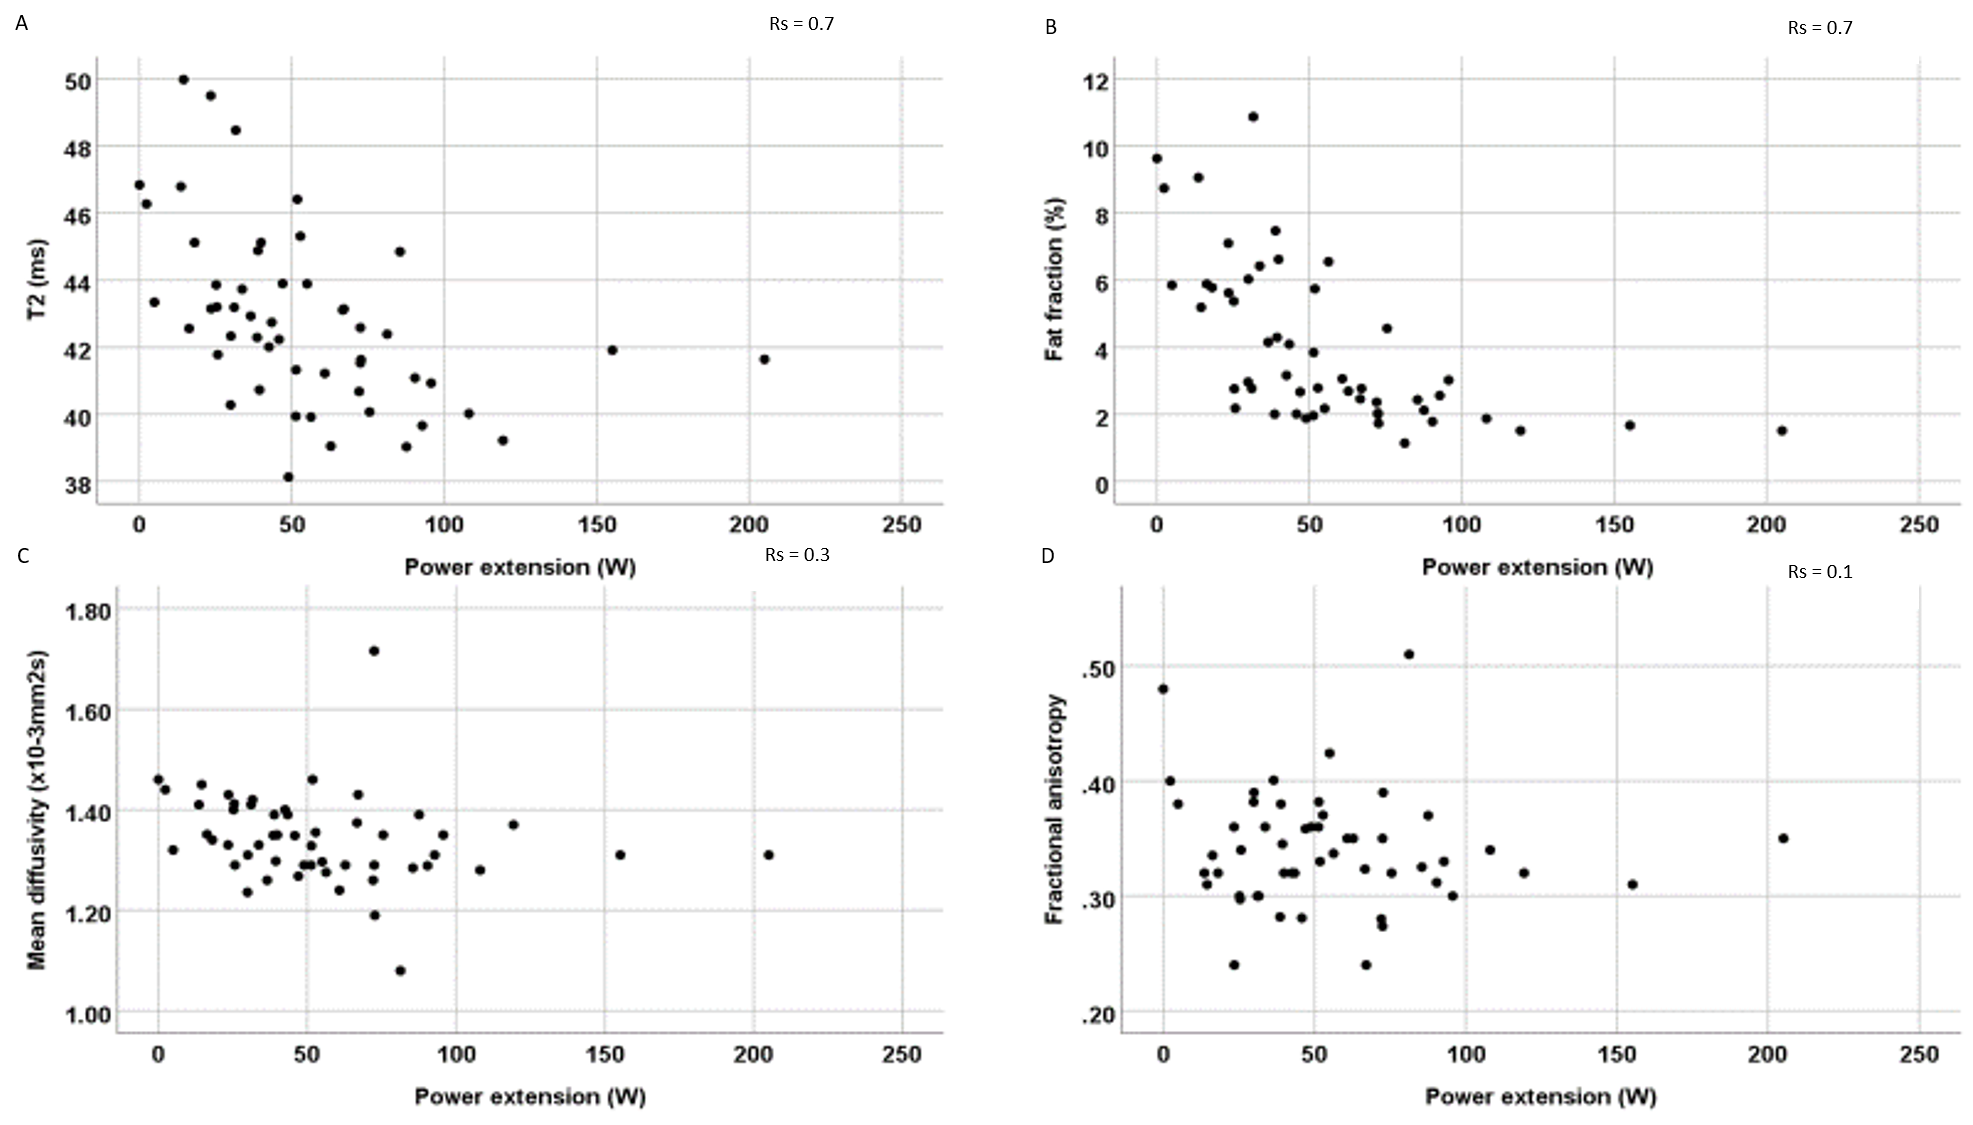
Fat fraction, mean diffusivity and T2 values were significantly higher in the older age group compared to the young group. In the quadriceps, there were differences of 4% (p<0.001) in fat fraction, of 0.11 x10⁻³mm2s (p=0.002) in mean diffusivity and of 4.3ms (p<0.001) in T2. In the hamstrings, there were differences of 6% (p<0.001) in fat fraction, of 0.14 x10⁻³mm2s (p<0.001) in mean diffusivity and of 3.5ms (p<0.001) in T2. There were significant differences in muscle power flexion of 27W (p<0.001) and extension of 56W (p<0.001) and a difference in muscle volume of 397cm3 (p=0.006) between the old and young groups. There were significant differences in handgrip strength of 13.7kg (p<0.001) between young and older participants. The differences between young and middle-aged, and middle-aged and older participants followed this same trend.In older participants, within the hamstrings, T2 correlated with frailty index (rs=0.8;p<0.001), muscle power flexion (rs=0.6;p=0.01) and gait speed (rs=0.4,p=0.05). Fat fraction correlated with frailty index (rs=0.7;p<0.001), muscle power flexion (rs=0.6;p=0.001) and gait speed (rs=0.4;p=0.02). Within the quadriceps T2 correlated with frailty index (rs=0.8;p<0.001), muscle power extension (rs=0.6;p<0.001) and gait speed (rs=0.5;p=0.007). Fat fraction correlated with frailty index (rs=0.7;p<0.001), muscle power extension (rs=0.7;p<0.001) and gait speed (rs=0.6;p=0.001). Muscle volume of the thigh correlated with frailty index (rs=0.6;p<0.001), muscle power flexion (rs=0.6;p<0.001), muscle power extension (rs=0.6;p<0.001) and gait speed (rs=0.6;p=0.01).
Conclusions:
We have identified in the most extensive study to date that quantitative MR measurements can detect muscle differences between young, middle-aged and older participants. Older participants had significantly higher T2, FF and mean diffusivity and significantly lower muscle volume, grip strength, and muscle power. This study has shown for the first time a correlation between quantitative MRI measurement for T2, FF and muscle volume with frailty. This demonstrates that quantitative MRI is a useful marker of frailty and could be used as a diagnostic and management tool in ageing muscle.Acknowledgements
This paper presents independent research funded/supported by the National Institute for Health Research (NIHR) Leeds Biomedical Research Centre (BRC). The views expressed are those of the author(s) and not necessarily those of the NIHR or the Department of Health and Social Care. We are grateful to radiographer Dominic Bertham for carrying out the MR studiesReferences
1. Kinsella, K.G. and D.R. Phillips, Global aging: The challenge of success. Vol. 60. 2005.
2. Goodchild, M.F., in the World of Web 2.0. International Journal, 2007. 2(2): p. 27-29.
3. Visser, M., et al., Skeletal muscle mass and muscle strength in relation to lower-extremity performance in older men and women. J Am Geriatr Soc, 2000. 48(4): p. 381-6.
4. Fried, L.P., et al., Frailty in older adults: evidence for a phenotype. The Journals of Gerontology Series A: Biological Sciences and Medical Sciences, 2001. 56(3): p. M146-M157.
5. McPhee, J.S., et al., Physiological and functional evaluation of healthy young and older men and women: design of the European MyoAge study. Biogerontology, 2013. 14(3): p. 325-37.
Figures