2708
Detecting Muscle Activity using a 0.5T Upright Open MRI – A Pilot Study Using a Double Echo Steady State Sequence to Measure T2 in Biceps and Triceps
Noor Shaikh1,2,3, Andrew Yung4, Honglin Zhang5, John Street2,6, Cornelia Laule2,7,8,9, Thomas Oxland2,3,6, and David Wilson2,5,6
1Biomedical Engineering, University of British Columbia, Vancouver, BC, Canada, 2ICORD, University of British Columbia, Vancouver, BC, Canada, 3Mechanical Engineering, University of British Columbia, Vancouver, BC, Canada, 4UBC MRI Research Center, University of British Columbia, Vancouver, BC, Canada, 5Centre for Hip Health and Mobility, University of British Columbia, Vancouver, BC, Canada, 6Orthopaedics, University of British Columbia, Vancouver, BC, Canada, 7Radiology, University of British Columbia, Vancouver, BC, Canada, 8Physics & Astronomy, University of British Columbia, Vancouver, BC, Canada, 9Pathology & Laboratory Medicine, University of British Columbia, Vancouver, BC, Canada
1Biomedical Engineering, University of British Columbia, Vancouver, BC, Canada, 2ICORD, University of British Columbia, Vancouver, BC, Canada, 3Mechanical Engineering, University of British Columbia, Vancouver, BC, Canada, 4UBC MRI Research Center, University of British Columbia, Vancouver, BC, Canada, 5Centre for Hip Health and Mobility, University of British Columbia, Vancouver, BC, Canada, 6Orthopaedics, University of British Columbia, Vancouver, BC, Canada, 7Radiology, University of British Columbia, Vancouver, BC, Canada, 8Physics & Astronomy, University of British Columbia, Vancouver, BC, Canada, 9Pathology & Laboratory Medicine, University of British Columbia, Vancouver, BC, Canada
Synopsis
We used a 0.5T upright open MRI to investigate T2 as a marker for muscle activity. Six volunteers’ arms were imaged with a Double Echo Steady State (DESS) sequence while relaxing (30min), following weighted bicep curls, and again after relaxing (20min). Directly after bicep curls T2 increased (average 41%) in the biceps but not the triceps, then subsequently decreased (average 14%) with relaxing. Intra-rater repeatability was promising. T2 standard deviation was relatively high, which is likely due to tissue heterogeneity. This preliminary study supports the potential of using DESS in upright open MRI to assess muscle injury or dysfunction.
Introduction
Changes in muscle physiology with exercise and disease can be monitored with quantitative magnetic resonance imaging (MRI), including measures of T2. Regional differences in T2 can indicate varying muscle recruitment and also correspond to electromyographic (EMG) measures1,2. Typically however, though activities for muscle recruitment are done upright in varying postures, imaging is performed supine. This brings into question whether upright imaging in postures of interest may provide more physiologically accurate information about muscle changes with activity. Additionally, many sequences used for T2 measurement (ie. balanced steady-state free precession, spin-echo multi-contrast, Carr-Purcell-Meiboom-Gill) have limitations including long imaging time, requiring T1 knowledge, off-resonance banding, or systematic errors in T2 estimation particularly as T2/T1~13–7. An alternate approach is a Double Echo Steady State (DESS) sequence, which was used to successfully measure T2 in cartilage with benefits of reduced imaging time and systematic error8. The objective of this study was to determine if muscle activity can be detected using a DESS sequence to measure changes in T2 in upright/weight bearing postures in a 0.5T upright open MRI.Methods
Experimental protocol: Six healthy volunteers were imaged with a 1 channel neck coil while seated in a 0.5T upright open MRI (MROpen, Paramed) using a 3D-DESS sequence (TR/TE=16/6ms, FOV=30cm, scan matrix=160*128, 76 slices, slice thickness=2.3mm (0mm gap), NEX=1, time=2min13s). Slices were prescribed coronally covering the right upper arm (elbow to shoulder). As T2 in muscle can remain elevated for up to 30min after activity4, volunteers first relaxed their arm and were imaged after 10, 20, and 30min. While remaining seated in the scanner, they then performed bicep curls (2-5kg sandbag) until their arm felt exhausted (1-3min). After the last curl and while still holding the sandbag in flexion, their arm was imaged again. They then dropped the sandbag, relaxed their arm again and were imaged after 10 and 20min of rest (Figure 1).Analysis and statistics: Voxel-wise T2 was calculated by fitting to a DESS signal equation8 with a T1 global estimator of 500ms (extrapolated from literature9) using in-house software (Matlab) to produce T2 maps of each slice. Using 3D Slicer, biceps brachii (combined with brachialis) and triceps brachii regions were manually segmented axially in the center of the muscle and along their length every 5 slices to determine mean T2 (Figure 2). A one-way repeated measures ANOVA with Bonferroni’s post-hoc test assessed the effect of muscle activity (bicep curl) on mean and standard deviation of T2 for each muscle (p<0.05, Statistica). Intra-rater repeatability, where the same rater manually re-segmented muscle regions 2 times, was evaluated using intraclass correlation coefficient ((ICC)(3,1)).
Results
T2 mean: T2 maps from immediately after the activity visually showed increased T2 in the biceps/brachialis, but not the triceps, as well as increased T2 heterogeneity over the entire cross-section (Figure 3). Quantitative analysis demonstrated that muscle activity significantly increased the biceps/brachialis, but not the triceps mean T2 (Figure 4). For the biceps/brachialis, we found no change in T2 for the 3 pre-activity scans (mean T2 36.2±10.5ms). Post-hoc analysis showed that activity significantly increased mean T2 to 48.7±20.8ms (+41%) compared to the 30min pre-activity scan. T2 subsequently significantly decreased by an average of 17% by 20min after activity (to 40.4±11.4ms) (Figure 4A). In contrast, we found no change in triceps T2 across all time-points (average T2 of 33.8±8.1ms) (Figure 4B).T2 standard deviation: Muscle activity also significantly increased biceps/brachialis and triceps T2 standard deviation compared to 30min pre-activity (biceps/brachialis: +126% (9.2ms to 20.8ms); triceps: +56% (7.0ms to 11.0ms)).
Intra-rater repeatability: The ICCs for mean T2 were 0.97 (biceps/brachialis) and 0.90 (triceps), and for standard deviation were 0.93 (biceps/brachialis) and 0.91 (triceps).
Discussion
Our finding that muscle T2 increased with muscle activity and decreased with subsequent rest, supports that muscle activity is detectable using a DESS sequence in an upright open MRI. The increases in T2 in the biceps/brachialis, but not the triceps, also aligns with previous studies showing that, with elbow flexion, biceps brachii demonstrate high EMG activity whereas triceps brachii demonstrate low EMG activity10,11. Intra-rater repeatability was within the range of excellent (0.9-1.0)12, which provides confidence in our manual-based analysis approach. The observed standard deviations may be due to intrinsic tissue heterogeneity but may also be compounded by scanner-related technical limitations. Lower resolution of the 0.5T upright open MRI can impact detailed segmentation of muscle compared to fat and fascia. In this analysis, sample regions were selected in the center of muscles and may have inadvertently included other tissues. Motion during scanning may also have contributed to T2 standard deviation because of the upright postures allowed by the scanner, even though volunteers were asked to remain still and were stabilized with supporting structures.Conclusion
To our knowledge, this is the first study demonstrating changes in T2 with muscle activity using a DESS sequence in an upright open MRI. MRI of muscles in upright postures could enable studying muscle injury and dysfunction in postures which are more clinically relevant than supine. Imaging multiple muscles simultaneously may also provide insight into muscle compensation due to injury and disease to help inform clinical intervention.Acknowledgements
We thank the study participants for their time. Funding for the work was received from Natural Sciences and Engineering Research Council of Canada (NSERC) and Medtronic Canada.References
- Price TB, Kamen G, Damon BM, et al. Comparison of MRI with EMG to study muscle activity associated with dynamic plantar flexion. Magn Reson Imaging. 2003;21(8):853-861.
- Cagnie B, Elliott JM, O’Leary S, D’hooge R, Dickx N, Danneels L. Muscle functional MRI as an imaging tool to evaluate muscle activity. J Orthop Sports Phys Ther. 2011;41(11):896-903.
- Hiepe P, Gussew A, Rzanny R, et al. Interrelations of muscle functional MRI, diffusion-weighted MRI and (31)P-MRS in exercised lower back muscles. NMR Biomed. 2014;27(8):958-970.
- Varghese J, Scandling D, Joshi R, et al. Rapid Assessment of Quantitative T1, T2, and T2* in Lower Extremity Muscles in Response to Maximal Treadmill Exercise. NMR Biomed. 2015;28(8):1-23.
- Dickx N, Dʼhooge R, Cagnie B, Deschepper E, Verstraete K, Danneels L. Magnetic Resonance Imaging and Electromyography to Measure Lumbar Back Muscle Activity. Spine (Phila Pa 1976). 2010;35(17):E836-E842.
- De Ridder EMD, Van Oosterwijck JO, Vleeming A, Vanderstraeten GG, Danneels LA. Muscle functional MRI analysis of trunk muscle recruitment during extension exercises in asymptomatic individuals. Scand J Med Sci Sport. 2015;25(2):196-204.
- Dickx N, Cagnie B, Achten E, Vandemaele P, Parlevliet T, Danneels L. Differentiation between deep and superficial fibers of the lumbar multifidus by magnetic resonance imaging. Eur Spine J. 2010;19(1):122-128.
- Heule R, Ganter C, Bieri O. Rapid estimation of cartilage T2 with reduced T1 sensitivity using double echo steady state imaging. Magn Reson Med. 2014;71(3):1137-1143.
- Mcmahon KL. Magnetic Resonance Imaging: The Underlying Principles. 2011;41(11):806-819.
- Cools AM, Borms D, Cottens S, Himpe M, Meersdom S, Cagnie B. Rehabilitation Exercises for Athletes With Biceps Disorders and SLAP Lesions. Am J Sports Med. 2014;42(6):1315-1322.
- Borms D, Ackerman I, Smets P, Van den Berge G, Cools AM. Biceps Disorder Rehabilitation for the Athlete. Am J Sports Med. 2016;45(3):642-650.
- Hu Z-J, He J, Zhao F-D, Fang X-Q, Zhou L-N, Fan S-W. An assessment of the intra- and inter-reliability of the lumbar paraspinal muscle parameters using CT scan and MRI. Spine (Phila Pa 1976). 2011;36(13):868-874.
Figures
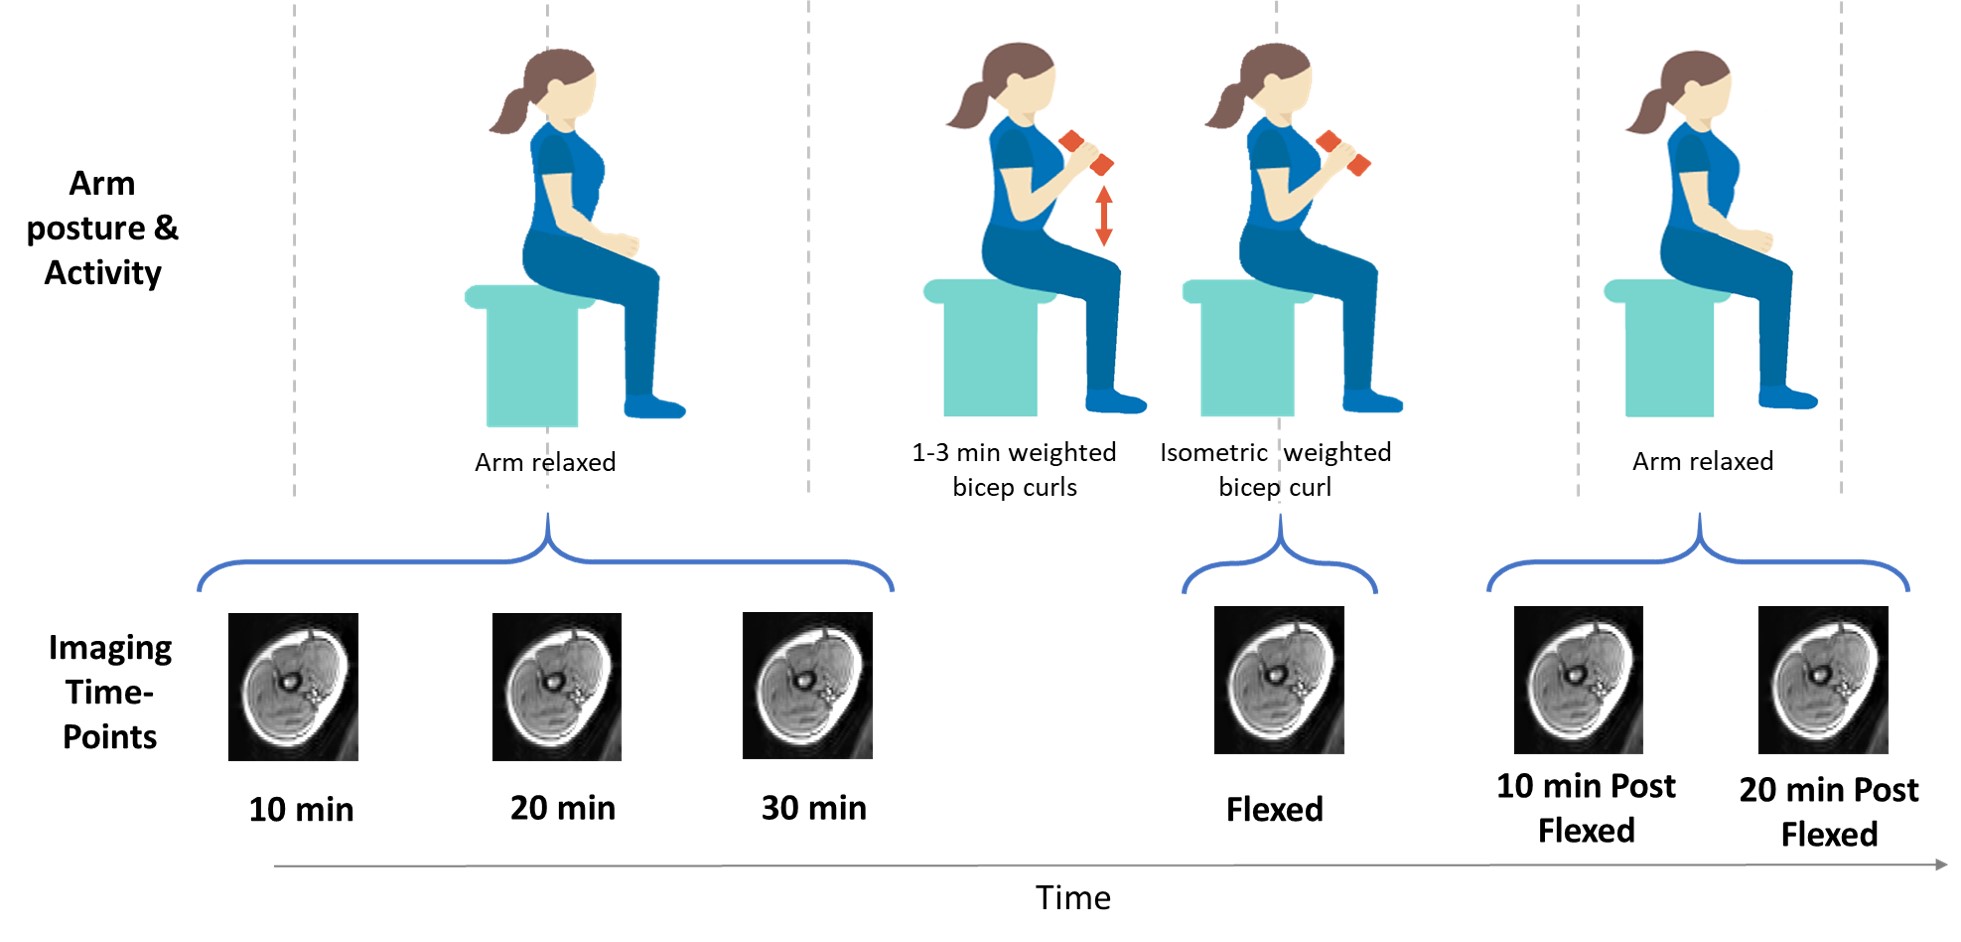
Imaging
time-points relative to arm postures and activity.
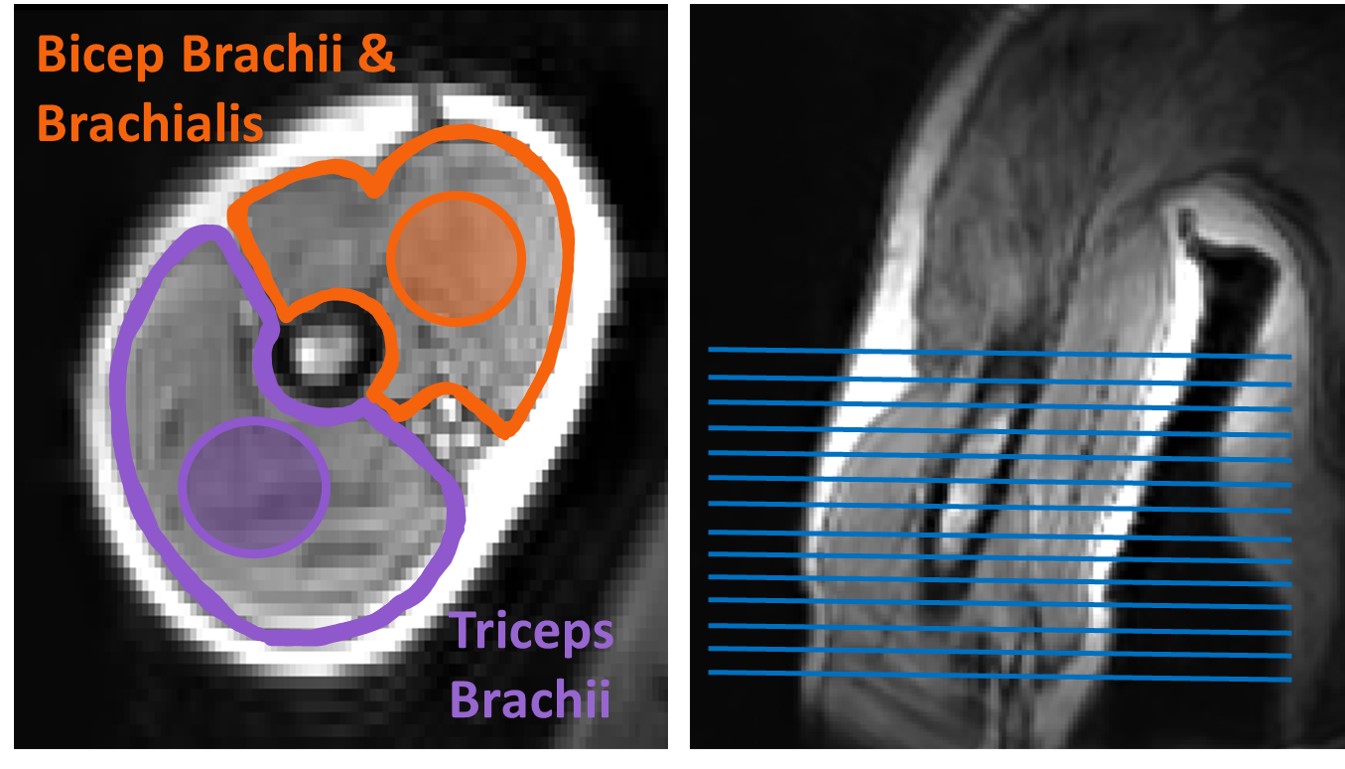
Biceps
brachii/brachialis and triceps with example segmentation (regions shaded within
the muscles), and coverages of segmented slices.
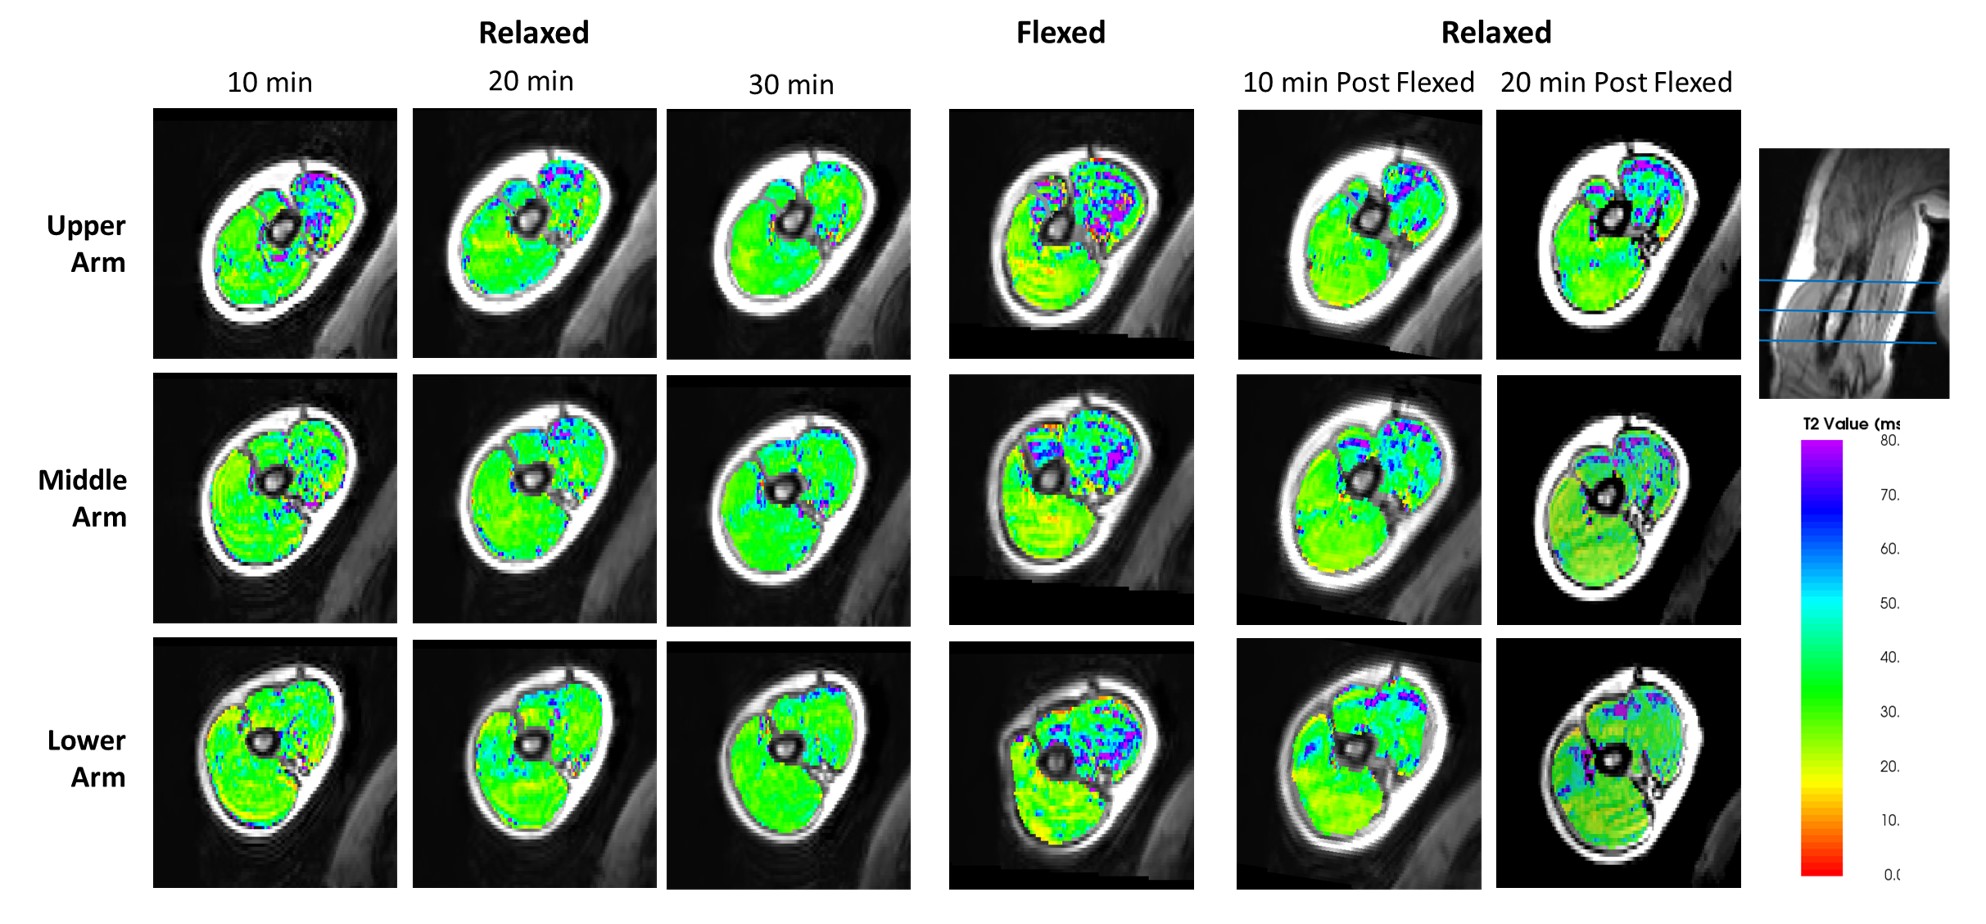
Example T2 maps of the biceps brachii/brachialis and
triceps from the upper, middle and lower region of the arm.
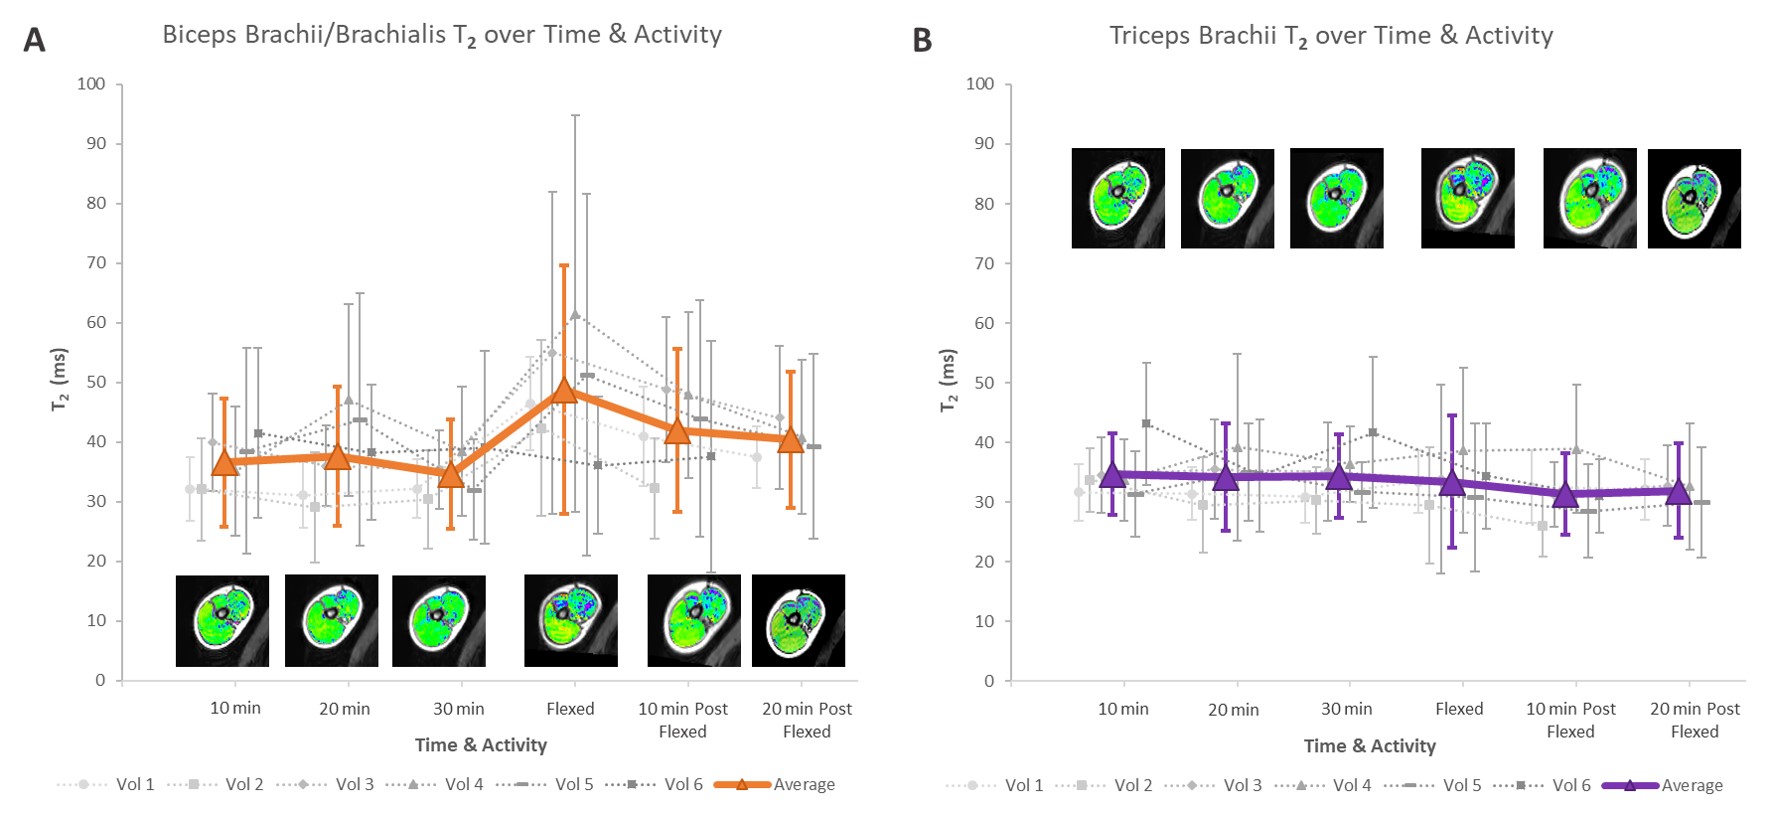
Muscle activity
affects biceps/brachialis T2 but not triceps T2; A) Biceps/Brachialis: there was a significant
difference in mean T2 between Flexed and all time-points except 10 min Post
Flexed (17-41% difference) and a significant difference in T2 standard deviation
between Flexed and all other time-points (34-55% difference). B) Triceps: mean
T2 was not significantly different at any time point, but T2 standard deviations
was higher at Flexed relative to 30min pre-activity (56% difference).