2707
Variability of Diffusion Tensor MRI, 2-Point Dixon fat fraction and T2 relaxation in ROIs of thigh muscle in rheumatoid arthritis patients1Leeds Biomedical Research Centre, Leeds, United Kingdom, 2Department of Health Sciences, University of York, York, United Kingdom, 3Leeds institute of Rheumatic and Musculoskeletal Medicine, University of Leeds, Leeds, United Kingdom
Synopsis
Muscular weakness is associated with fatty infiltration and changes to muscle fibre structure. Quantitative magnetic resonance imaging (MRI) may be able to detect subtle muscle changes in rheumatoid arthritis (RA) patients. Before this method is used, variability of MRI measurements involving regions of interest (ROI) must first be measured. Fat fraction, T2 measurement and diffusion tensor imaging was performed on 19 participants with RA. Intra-rater and inter-rater variability of MRI measurements for thigh muscle ROIs were assessed. Inter-rater and intra-rater variability scores were high, suggesting that these measurements are sufficiently precise to allow the study of subtle changes to muscle.
Introduction
MRI allows the analysis of muscles in vivo while also being non-invasive. Evidence suggests that quantitative MRI measurements may be able to detect changes in muscle related to conditions such as rheumatoid cachexia caused by rheumatoid arthritis (RA) 1. Rheumatoid cachexia is a form of muscle loss attributed to chronic inflammation resulting in increased skeletal muscle deterioration and weakness 2. This deterioration in RA patients is believed to be related to the severity of the arthritis 3. Furthermore, muscle composition may be affected by the deposition of fat inside muscle fibres 4. MRI is considered to be the gold standard method for the evaluation of muscle volumes and micro structure 5 as well as intra-muscular and inter-muscular fat 4. Quantitative MRI measurement has become an increasingly important tool for the diagnosis of muscle disorders, disease tracking and detection of sub clinical muscle disease 6,7. Fat fraction (FF) using the Dixon chemical shift imaging method measures intramuscular fat 8; Diffusion tensor imaging (DTI) parameters, such as mean diffusivity and fractional anisotropy, are sensitive to changes in muscle micro structure 9,10. Measurements of T2 relaxation times of muscle, with areas of high free water content in muscle (as in areas of inflammation caused by RA) manifest as higher T2 values compared to T2 values of normal tissue 11. It may be possible to use these quantitative MRI measurements to clinically assess muscular changes at an early stage and identify pathology. Before this technique is clinically tested the variability of these measurements must firstly be established. The aim of this study was to evaluate the variability of quantitative measures of FF, DTI and T2 within the thigh muscles of participants in a study involving nineteen RA diagnosed volunteers.Methods
This study utilised STEAM-EPI diffusion, 2-point Dixon with a 3D gradient echo readout (VIBE) and a multi-echo spin echo (MESE) SPAIR sequence to measure T2, (figure 3). 19 RA participants who provided written informed consent to the MUSCLE II study (Magnetic Resonance Imaging and Ultra Sound CLinical Evaluation of muscle pathology II; REC:17/EM/0079) had an MRI of their thigh. ROIs were then drawn by two researchers using digital imaging software around the muscle groups that make up the hamstrings and quadriceps in the thigh. These ROIs of muscle were drawn on the middle slice (20 of 40) of the in-phase 2-point VIBE Dixon volume. The ROIs were then copied on to the corresponding slice of the STEAM-EPI diffusion and MESE series, (Figure 3). Mean values for each parameter for the hamstrings and quadriceps were obtained by combining these ROIs and taking the mean value over all ROIs. For intra-rater repeatability, the chosen 19 MRI data sets were contoured twice by the same researcher at a 6-month interval between measurements to reduce bias. For inter-rater reproducibility the same 19 MRI data sets was contoured independently by two researchers. Variability was measured using the intra-class correlation coefficient (ICC). Agreement between the two measurement techniques was measured using Bland-Altman plots. For ICC, a two-way mixed model with absolute agreement was used. ICC values between the two measurements are defined as: above 0.60 are classed as good and values above 0.75 are classed as excellent 12.Results
(Figures 1 & 2) Bland Altman plots show there is good intra-rater variability and inter-rater variability of MRI measures for hamstring and quadricep muscle groups. ICC measurements (figure 4) show excellent agreement for intra-rater variability and inter-rater variability 12.Conclusion
It has been observed that there is low variability in FF and DTI measurements for healthy participants 13. We have now shown that in patients with RA, Inter-rater and intra-rater variability scores were high, providing excellent ICC results for FF, DTI and T2 measurements. This implies that the measurements have sufficient precision to detect subtle changes in muscle. This further suggests that these techniques have the potential to be used to investigate changes in muscle in response to RA disease process,1,2.Acknowledgements
This paper presents independent research supported by the National Institute for Health Research (NIHR) and Leeds Biomedical Research Centre (BRC). The views expressed are those of the author(s) and not necessarily those of the NIHR or the Department of Health and Social Care.References
1. von Haehling, S. & Anker, S. D. Cachexia as a major underestimated and unmet medical need: facts and numbers. J. Cachexia. Sarcopenia Muscle 1, 1–5 (2010).
2. Masuko, K. Rheumatoid cachexia revisited: a metabolic co-morbidity in rheumatoid arthritis. Front. Nutr. 1, 20 (2014).
3. Filippin, L. I. et al. Temporal development of muscle atrophy in murine model of arthritis is related to disease severity. J. Cachexia. Sarcopenia Muscle 4, 231–238 (2013).
4. Hausman, G. J., Basu, U., Du, M., Fernyhough-Culver, M. & Dodson, M. V. Intermuscular and intramuscular adipose tissues: Bad vs. good adipose tissues. Adipocyte 3, 242–255 (2014).
5. Pons, C. et al. Quantifying skeletal muscle volume and shape in humans using MRI: A systematic review of validity and reliability. PLoS One 13, e0207847 (2018).
6. Díaz-Manera, J., Llauger, J., Gallardo, E. & Illa, I. Muscle MRI in muscular dystrophies. Acta Myol. myopathies cardiomyopathies Off. J. Mediterr. Soc. Myol. 34, 95–108 (2015).
7. Fischer, D., Bonati, U. & Wattjes, M. P. Recent developments in muscle imaging of neuromuscular disorders. Curr. Opin. Neurol. 29, 614–620 (2016).
8. Burakiewicz, J. et al. Quantifying fat replacement of muscle by quantitative MRI in muscular dystrophy. J. Neurol. 264, 2053–2067 (2017).
9. Damon, B. M. et al. Skeletal muscle diffusion tensor-MRI fiber tracking: rationale, data acquisition and analysis methods, applications and future directions. NMR Biomed. 30, (2017).
10. Novikov, D. S., Jensen, J. H., Helpern, J. A. & Fieremans, E. Revealing mesoscopic structural universality with diffusion. Proc. Natl. Acad. Sci. 111, 5088–5093 (2014).
11. Johnston, J. H. et al. Quantitative Skeletal Muscle MRI: Part 1, Derived T2 Fat Map in Differentiation Between Boys With Duchenne Muscular Dystrophy and Healthy Boys. Am. J. Roentgenol. 205, W207–W215 (2015).
12. Cicchetti, D. V. Guidelines, criteria, and rules of thumb for evaluating normed and standardized assessment instruments in psychology. Psychol. Assess. 6, 284–290 (1994).
13. Farrow, M. et al. Normal values and test–retest variability of stimulated-echo diffusion tensor imaging and fat fraction measurements in the muscle. Br. J. Radiol. 92, 20190143 (2019).
Figures
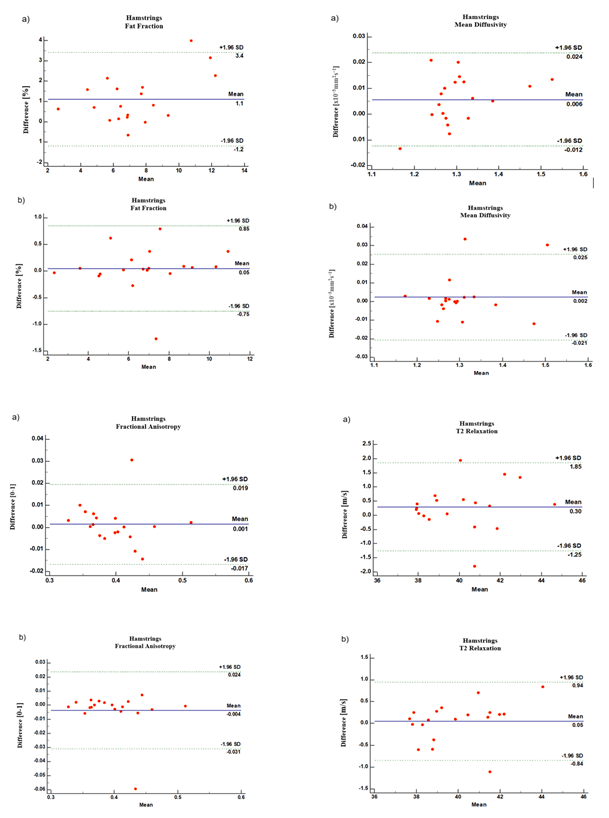
Figure 1:
Inter-rater (a) & Intra-rater (b) variability Bland-Altman plots for Fat fraction; Mean diffusivity; Fractional Anisotropy and T2 relaxation of the hamstrings muscle group.
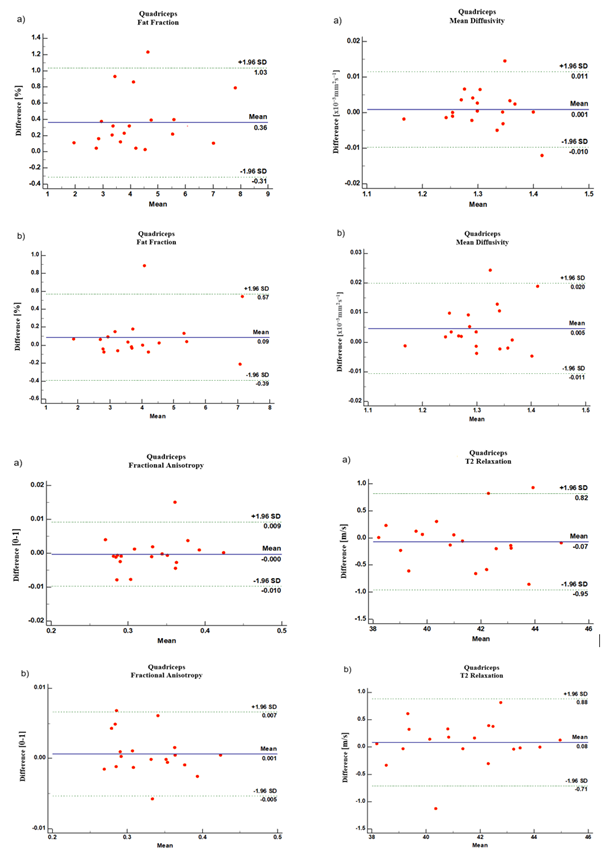
Figure 2:
Inter-rater (a) & Intra-rater (b) variability Bland-Altman plots for Fat fraction; Mean diffusivity; Fractional Anisotropy and T2 relaxation of the hamstrings muscle group.
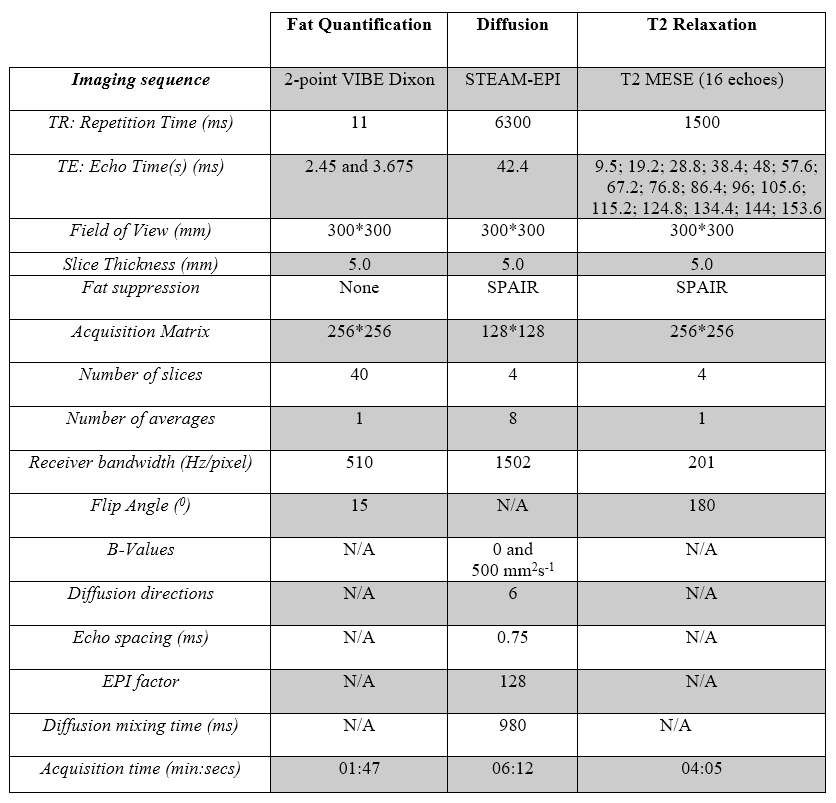
Figure 3:
parameters employed for 2-point VIBE Dixon, fat quantification, in vivo diffusion and T2 relaxation MRI measurements.
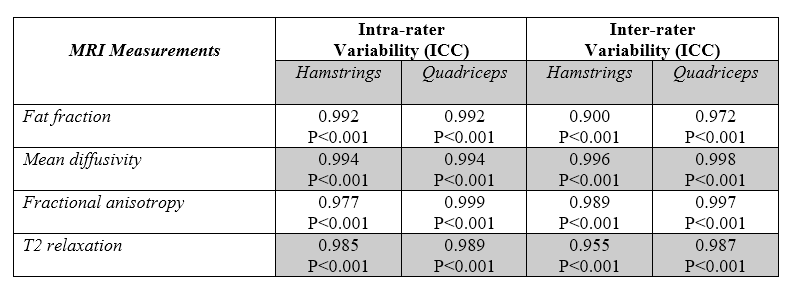
Figure 4:
Inter-rater and intra-rater variability measured using intraclass correlation coefficient (ICC)