2706
Detecting motor unit activity during volitional muscle contraction – Motor Unit MRI1Newcastle Magnetic Resonance Center, Institute of Cellular Medicine, Newcastle University, Newcastle upon Tyne, United Kingdom, 2Northern Medical Physics and Clinical Engineering, Freeman Hospital, Newcastle upon Tyne NHS Foundation Trust, Newcastle upon Tyne, United Kingdom, 3Newcastle Biomedical Research Centre (BRC) NIHR, Newcastle University, Newcastle upon Tyne, United Kingdom, 4Institute of Neuroscience, Newcastle University, Newcastle upon Tyne, United Kingdom
Synopsis
Motor units (MUs) play a fundamental role in muscle physiology and disease. They can be imaged using a diffusion weighted imaging technique, motor unit MRI (MUMRI). Previous work activated MUs using electrical stimulation, limiting MUMRI to muscles innervated from superficial nerves. Here, we demonstrated the feasibility of MUMRI during volitional muscle activation. We confirmed that the MU activity detected with MUMRI during muscle contraction increased with b-value, force level and was dependent on the diffusion-sensitisation direction. This work allows us to image MUs in situations reflecting real muscle physiology making it a promising tool for studying motor neuron diseases.
Introduction
A motor unit (MU) consists of a motor neuron and the muscle fibres that it innervates. Each muscle contains many MUs and the size and activation pattern of these MUs plays a fundamental role in muscle physiology and disease. For example, in motor neuron disease (MND), motor neuron death reduces the number of MUs, while the remaining MUs increase in size. When a motor neuron fires, the innervated muscle fibres contract, causing signal voids on diffusion weighted (DW) images. This allows us to image MUs with MRI, a technique called MUMRI.1,2 Previous work activated MUs using electrical stimulation, limiting MUMRI to muscles innervated from superficial nerves. To make MUMRI more clinically applicable, here we aim to image MU activity during volitional muscle activation. We hypothesised that if the signal voids on DW images during volitional muscle activation indeed represent MU activity, these voids will become more frequent and prominent with increasing diffusion sensitivity (b-value; increases the sensitivity to the twitch and likelihood of capturing the contraction), and force of contraction (increases the number of MUs firing).Materials & Methods
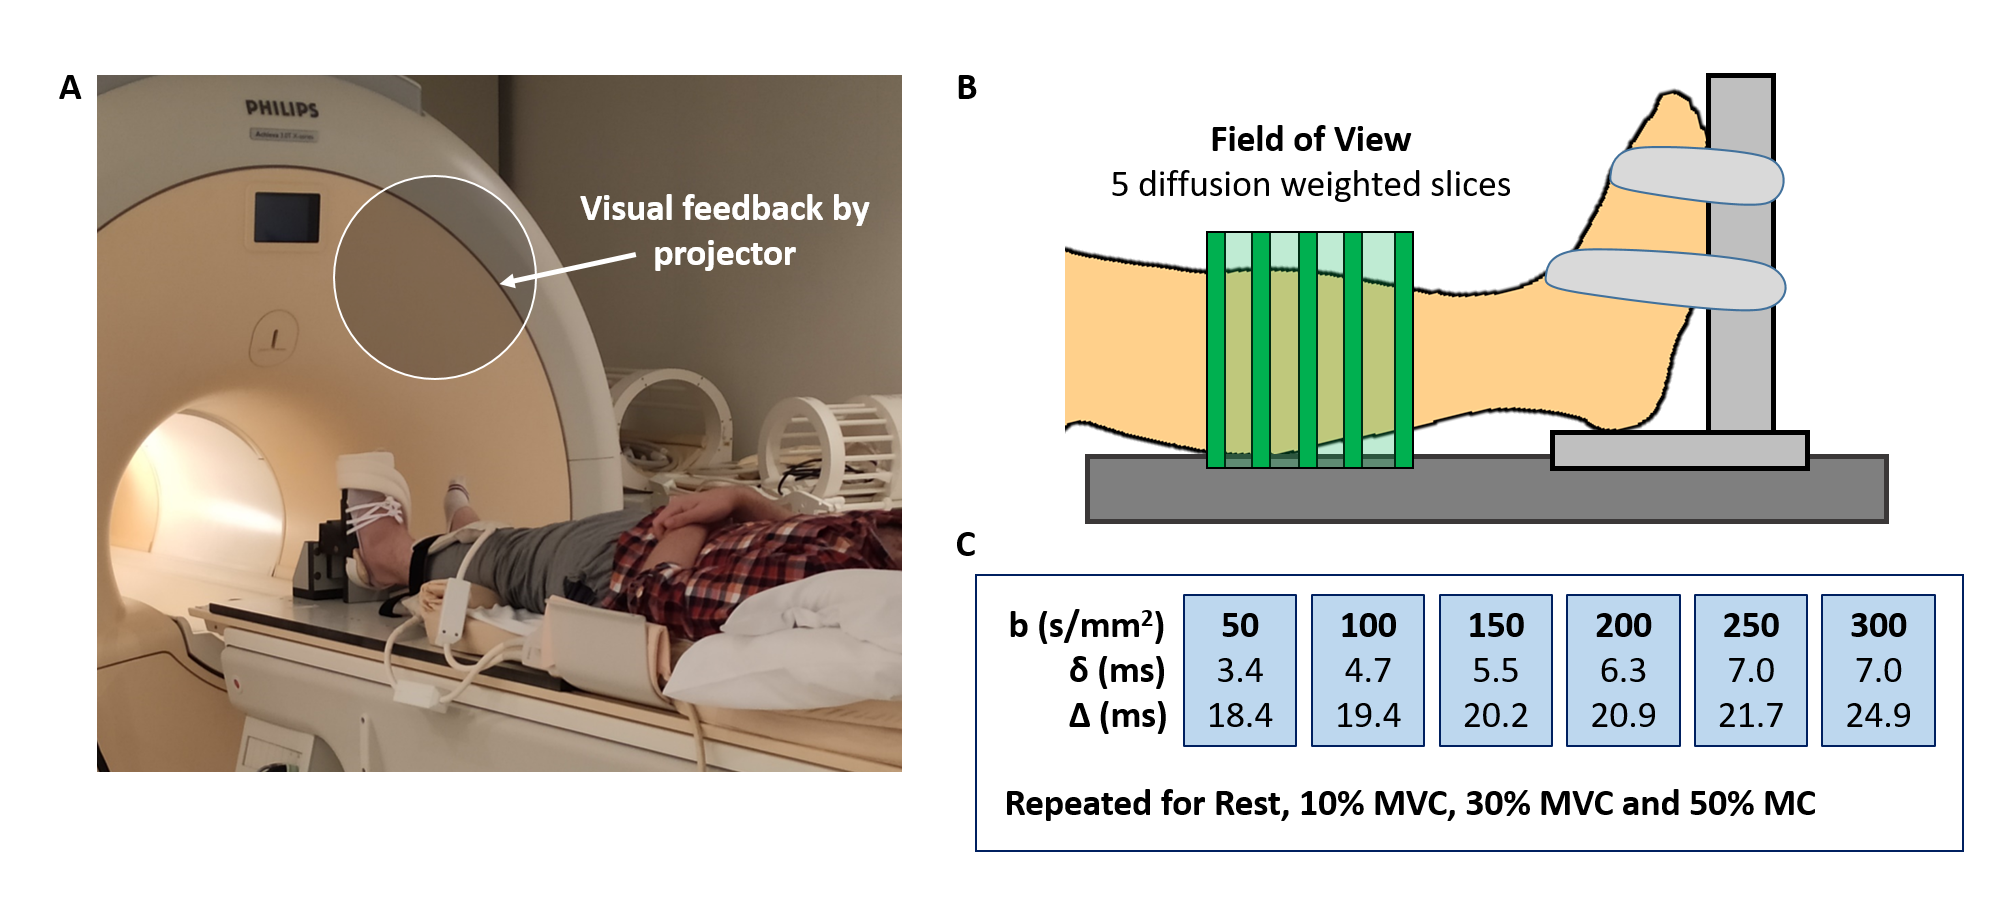
Data-acquisition: Leg muscles of 6 healthy volunteers were scanned using a 3T Philips MR scanner with a pair of FlexM coils (Fig.1). Five transversal DW slices were acquired during rest for six b-values (SE-EPI with fat suppression, voxel size=1.5x1.5x7.5mm, TR/TE=1000/39-49ms, diffusion-sensitisation direction: feet-head, b=50,100,150,200,250, and 300s/mm2). Thereafter, volunteers performed isometric ankle dorsiflexion (n=5) or plantarflexion (n=2) at a percentage of their maximum force (MVC; 10%, 30% and 50%) using an MR compatible ergometer. They held this force for 30sec and DW images were acquired during this 30sec contraction (1 image/sec). Each force level was performed for all b-values (randomized order). For one volunteer undertaking plantarflexion, DW images were acquired with diffusion-sensitisation set for all three directions (b=150s/mm2, contraction duration: 90sec).Data-analysis: All images were registered to rest and a region of interest (ROI) was drawn around the muscles of the anterior compartment (dorsiflexion) or posterior compartment (plantarflexion). Within this ROI, signal voids were automatically detected with Matlab. A signal void was defined as a group of connected voxels where the signal intensity dropped >50% compared to rest, and being >4 voxels (>9mm2) in cross-sectional area (CSA; 9mm2 being the minimal MU CSA found during electrical stimulation). Furthermore, the spatial distribution of MU activity was assessed by calculating the coefficient of variation (CoV; SD/Mean x 100%) on a voxel-wise basis, creating a CoV map. Per b-value and force level, the number of voids, CSA of these voids, the average CoV, and relative CoV (CoVrelative; CoV Exercise/CoV Rest) were determined. The dependence of these outcome measures to force level and b-value was assessed with multivariate regression.
Results
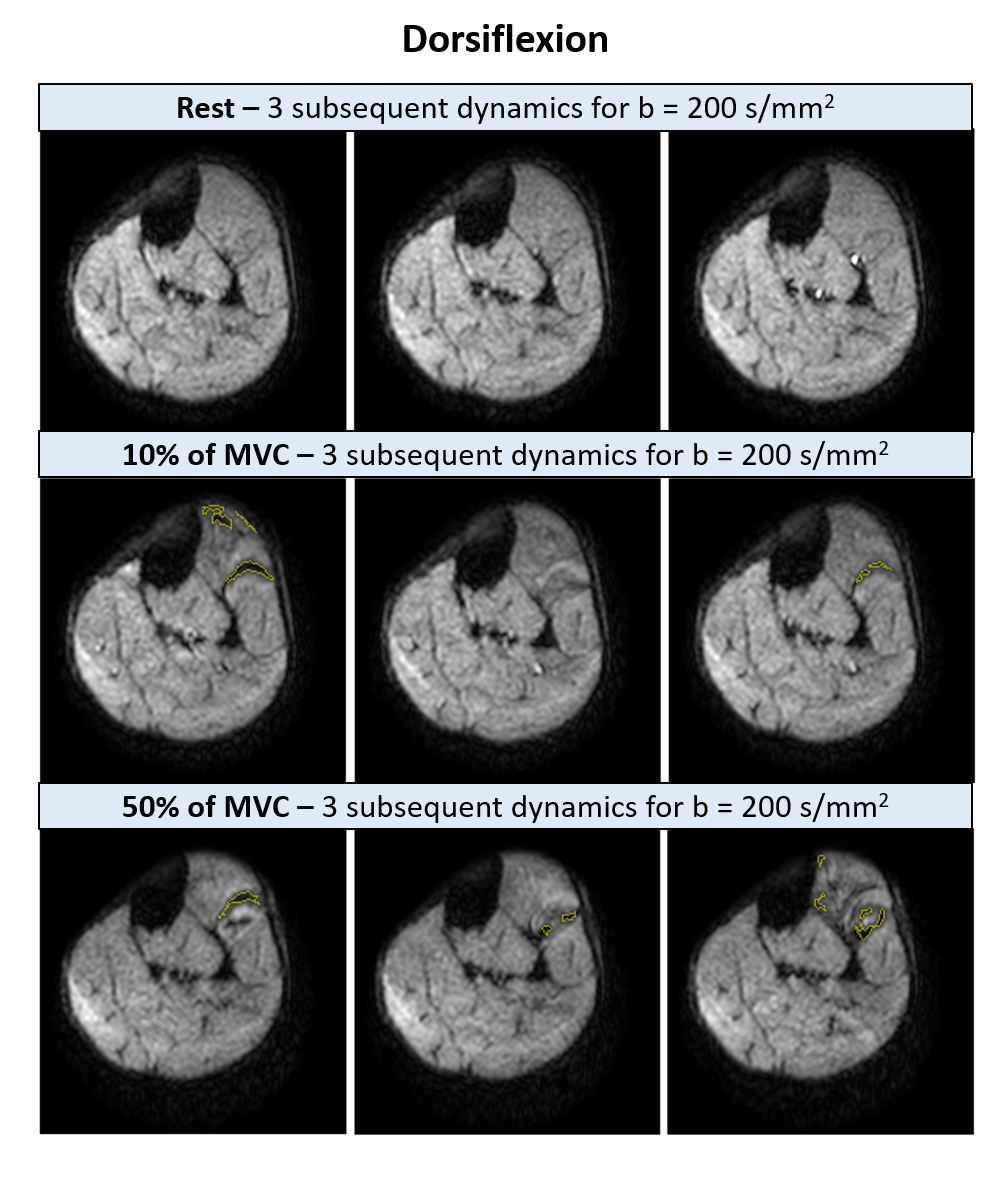
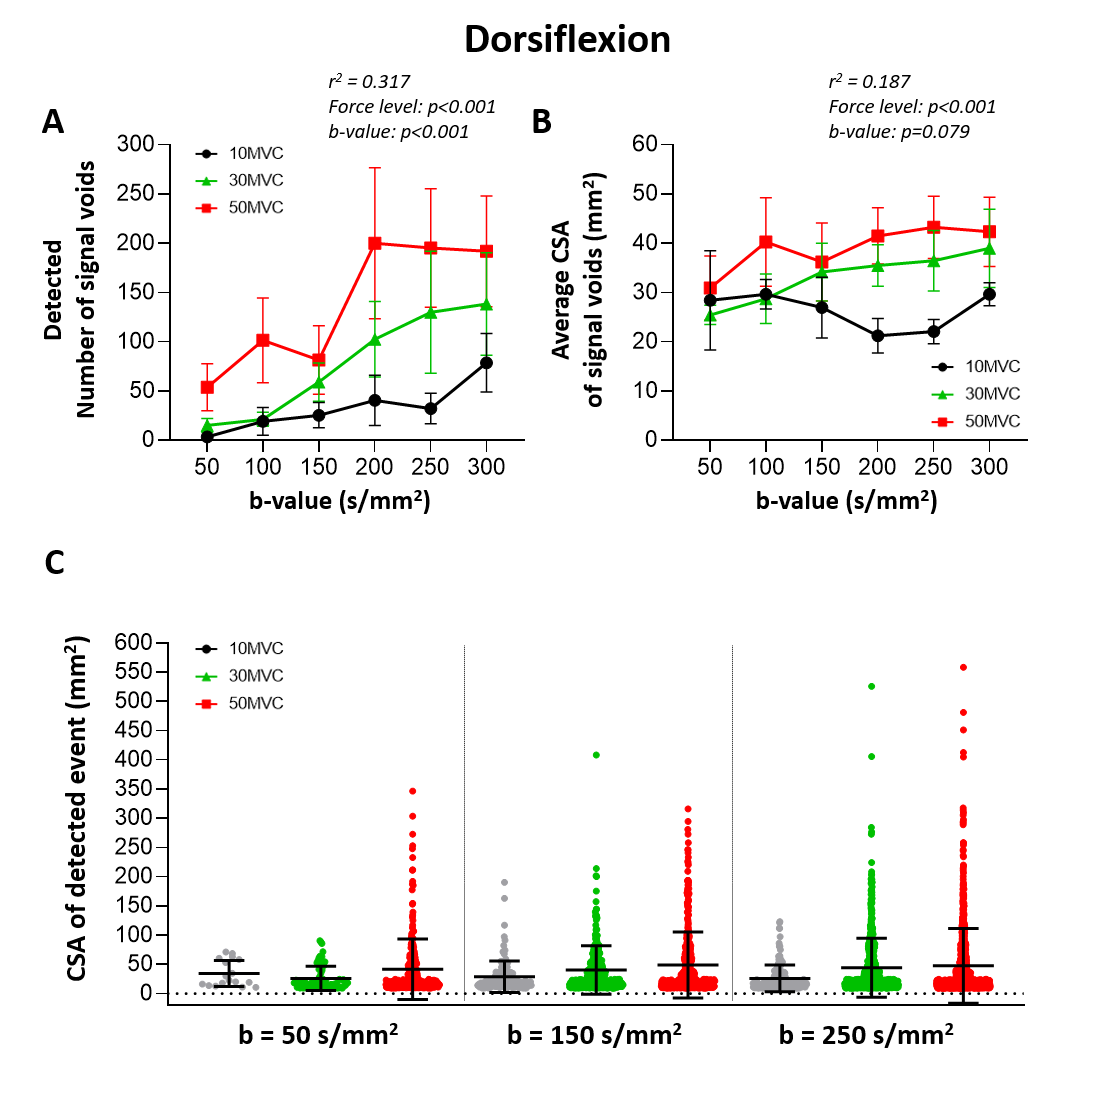
Ankle dorsiflexionSignal void detection: The muscles in the anterior compartment showed multiple signal voids for all b-values and force levels (see examples for b=200s/mm2 in Fig.2). On average 89±101 (mean±SD) signal voids with a median CSA of 42mm2 (range: 10.2–170.6mm2) were detected per acquisition, calculated over all volunteers, b-values and force levels. The number of signal voids increased with higher force levels (p<0.001) and higher b-values (p<0.001), and the average CSA of these voids increased only with force level (p<0.001)(Fig.3A/B). At least 75% of the voids had a CSA <60mm2, voids larger than this were especially detected with higher force levels or b-values (Fig.3C).
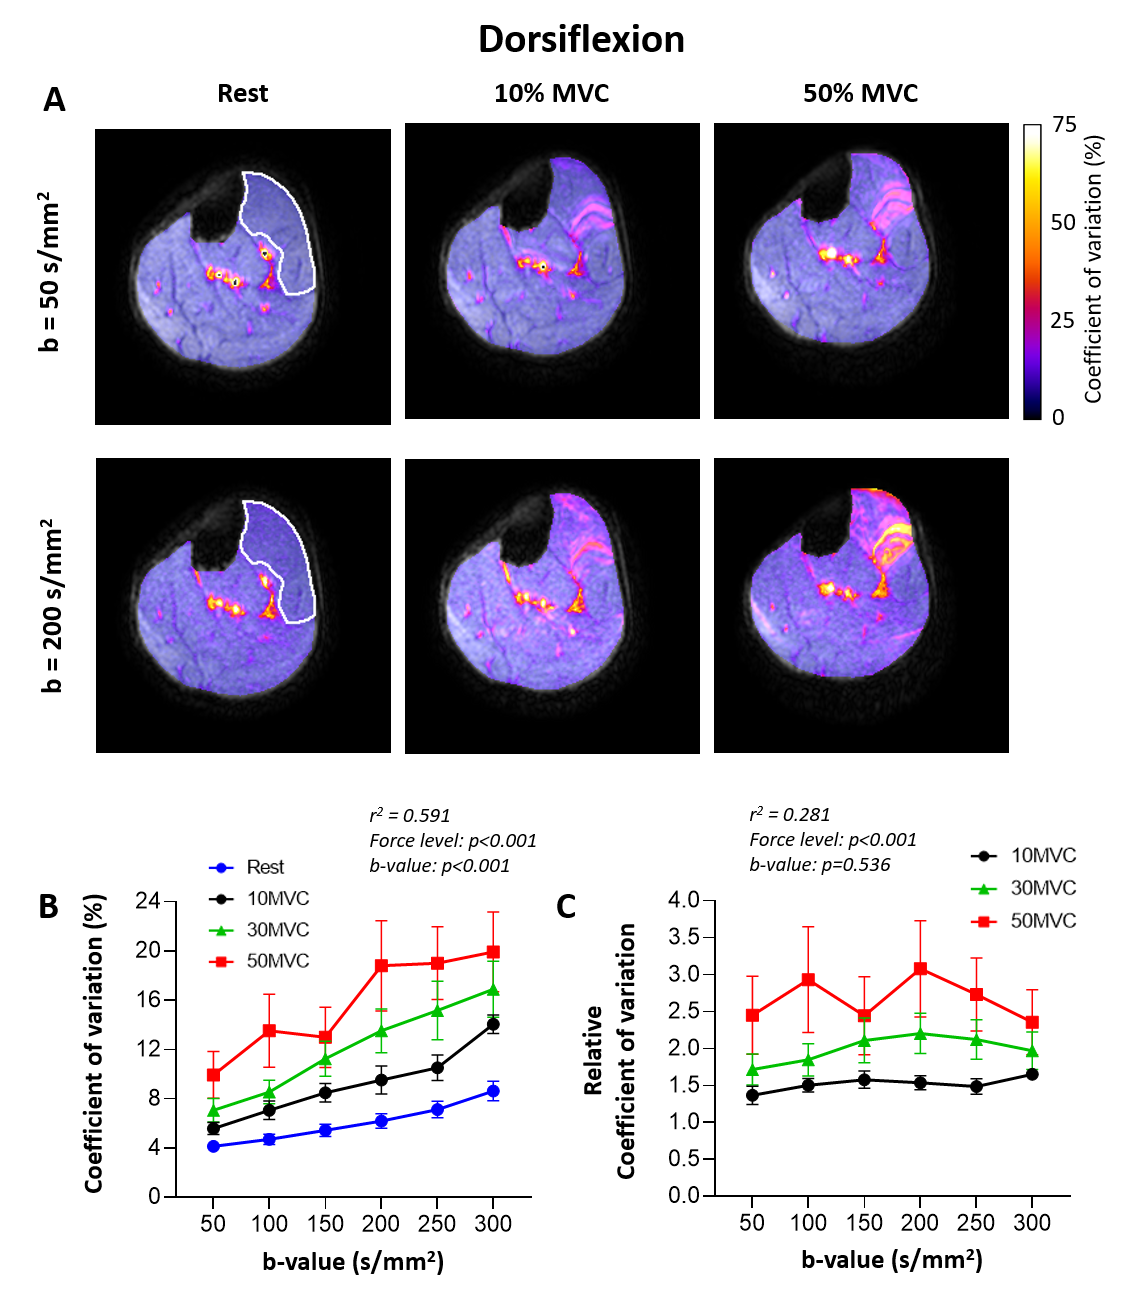
Coefficient of variation: The signal intensity varied most in the extensor digitorum and the superficial tibialis anterior compartment (Fig.4A). The CoV increased with higher force levels (p<0.001) and higher b-values (p<0.001), while CoVrelative only depended on force level (p<0.001)(Fig.4B/C).
Plantarflexion
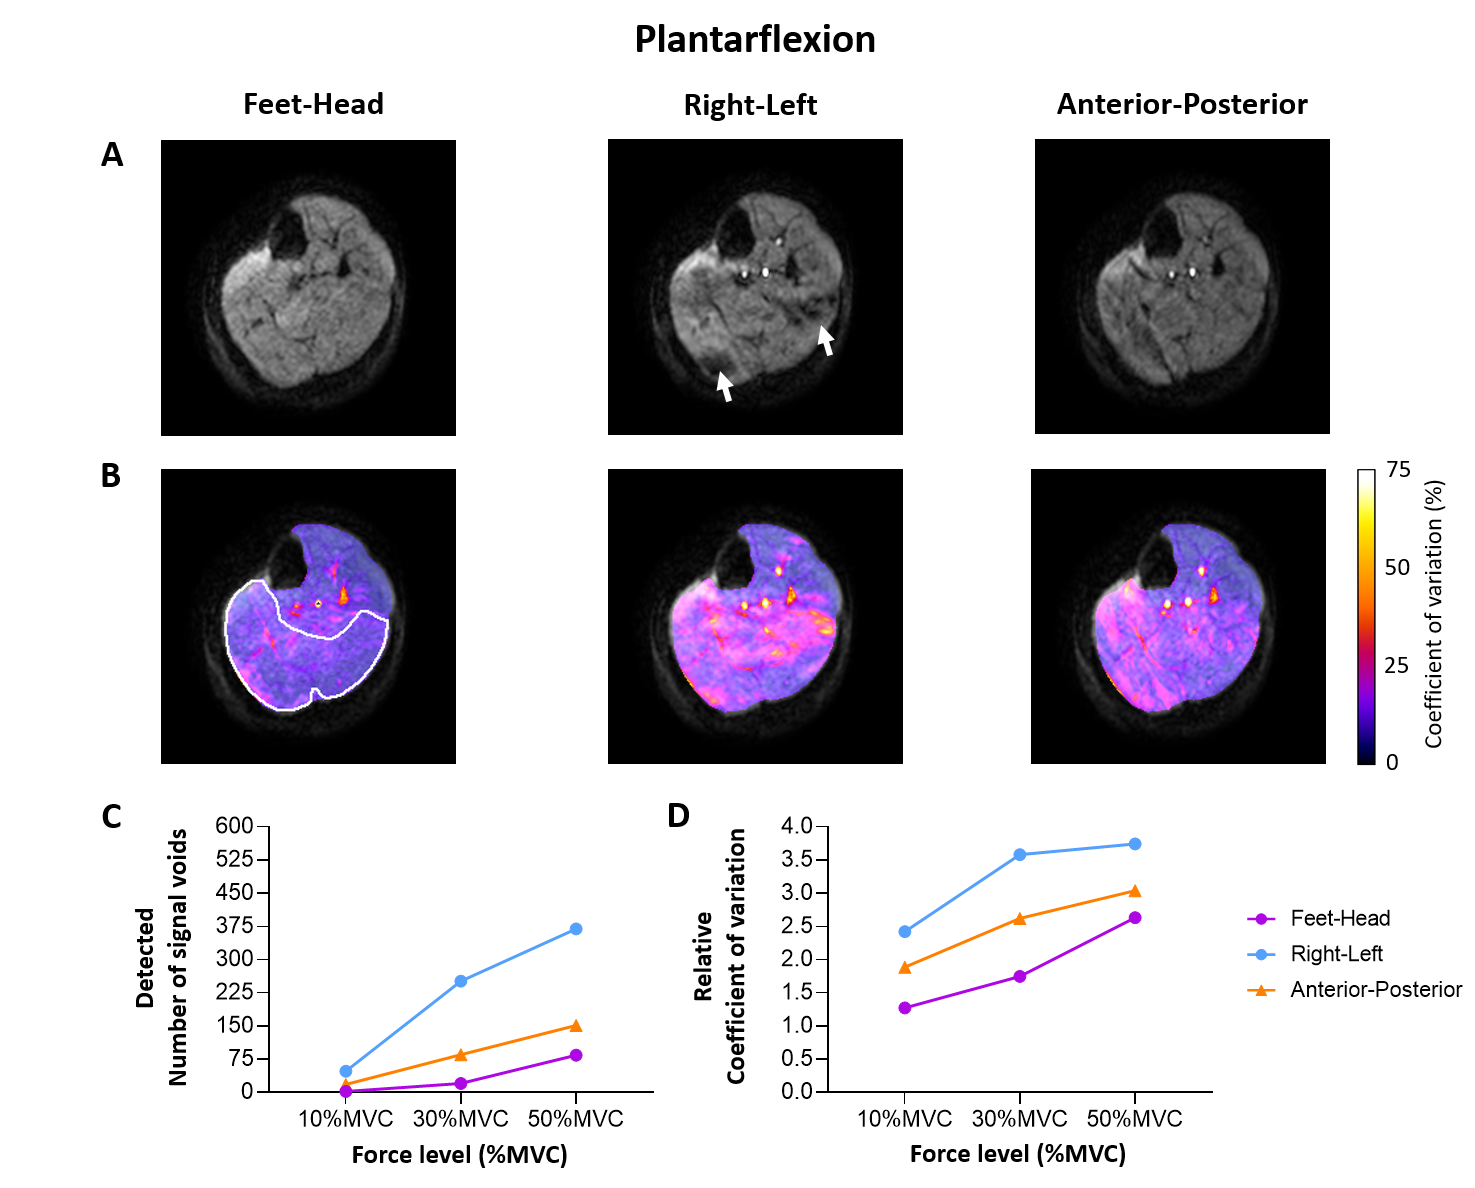
The DW images acquired during plantarflexion with feet-head diffusion-sensitisation showed almost no signal voids and only a minimal increase in CoV. Interestingly, the acquisition of the DW images with diffusion-sensitisation for all three directions revealed that the signal voids are best visible in the right-left diffusion direction (Fig.5).
Discussion
We confirmed our hypothesis that the amount of signal voids detected with MUMRI during ankle dorsiflexion increases with b-value and force level. The size of these signal voids was in the same order as for EMG studies for 10%MVC, but increased with 30-50%MVC.3 This suggests that higher force levels require the recruitment of larger MUs or multiple closely positioned MUs. This implies that signal voids on DW images during volitional muscle activation represent MU activity, but do not always reflect a single MU.Furthermore, the ability to detect a MU is influenced by the diffusion-sensitisation direction. This is probably explained by the muscle fibre direction since the pennation angle of the posterior compartment muscles is larger than the anterior compartment muscles.4 To estimate MU size, ideally, we want to detect single MUs. Therefore, we need to find a trade-off between the diffusion sensitivity/direction and force level such that sufficient signal voids are detected that reflect single MUs, all within a feasible time-period of an isometric muscle contraction.
Conclusion
We demonstrated the feasibility of MUMRI during volitional muscle activation, allowing us to move from studying MUs under a non-physiological condition of electrical stimulation to situations reflecting real muscle physiology. This improves the clinical applicability, making it a promising tool for following disease progression in MND and muscle physiology research.Acknowledgements
This research was co-funded by Muscular Dystrophy UK (8GRO-PG36-0246-1), the MRC Newcastle Confidence in Concept award and the NIHR Newcastle Biomedical Research Centre (BRC).
References
1Steidle G et al., Addressing spontaneous signal voids in repetitive single‐shot DWI of musculature: spatial and temporal patterns in the calves of healthy volunteers and consideration of unintended muscle activities as underlying mechanism. NMR Biomed, 2015; 28:801-810
2Whittaker R, et al. Functional magnetic resonance imaging of human motor unit fasciculation in amyotrophic lateral sclerosis. Annals of Neurology. 2019; 85: 455-9.
3Stålberg E, Dioszeghy P. Scanning EMG in normal muscle and in neuromuscular disorders. Electroencephalography and Clinical Neurophysiology. 1991; 81(6); 403-16.
4Sopher et al. The influence of muscle pennation angle of cross-sectional area on contact forces in the ankle joint. J Strain Analysis. 2017 52(1); 12-33.
Figures