2703
The Molecular Basis for 31P MRS-Based Phosphocreatine Muscle Resynthesis Rate Measurements in Healthy Adults1Pennington Biomedical Research Center, Baton Rouge, LA, United States, 2Stillman College, Tuscaloosa, AL, United States
Synopsis
Dynamic phosphorus magnetic resonance spectroscopy (31P-MRS) is a method used for in vivo studies of skeletal muscle function including measurements of phosphocreatine (PCr) synthesis rate during recovery from submaximal exercise. However, the molecular events underlying the PCr resynthesis rate are still under debate. Therefore, our goal was to assess the PCr resynthesis rate from 31P-MRS spectra collected from the skeletal muscle (vastus lateralis) of healthy adults and investigate associations between PCr resynthesis and levels of mitochondria-related transcripts and proteins in the same muscle (NAMPT, NQO1, PGC-1α, and SIRT1).
Purpose
Dynamic phosphorus magnetic resonance spectroscopy (31P-MRS) is a method used for in vivo studies of skeletal muscle function including measurements of phosphocreatine (PCr) synthesis rate during recovery from submaximal exercise. However, the molecular events underlying the PCr resynthesis rate are still under debate. Therefore, our goal was to assess the PCr resynthesis rate from 31P-MRS spectra collected from the skeletal muscle (vastus lateralis) of healthy adults and investigate associations between PCr resynthesis and levels of mitochondria-related transcripts and proteins in the same muscle (NAMPT, NQO1, PGC-1α, and SIRT1).Methods
As part of the CALERIE II study (Clinical Trials registration: NCT00427193, NCT02695511), 28 men and women, aged 20-50 years, with body mass index (BMI) from 22.0 to 27.9 kg/m2 at the screening visit, underwent a maximal aerobic fitness test for measurement of maximum oxygen uptake (VO2 peak), a 31P-MRS exam for measurement of PCr resynthesis rate, and a muscle biopsy for measurement of mRNA and protein levels of select mitochondria-related genes. Cardiopulmonary fitness was performed by continuously measuring weighted oxygen uptake (VO2) with an integrated metabolic measurement system (ParvoMedics TrueOne® 2400, Sandy, UT) during exercise on a programmable treadmill (Trackmaster® TmX425C, Carefusion, Newton, KS). In vivo 31P-MRS was performed on a GE 3T Signa HDxt magnet (GE Healthcare, Milwaukee, WI, USA). A single loop surface coil, 6 cm in diameter, was used to acquire localized and T1-relaxed 31P spectra. Standard acquisition parameters were as follows: pulse width (PW) 304 µs, repetition time (TR) 15 s, number of excitations (NEX) 16, sweep width1 5 kHz, number of points (NP) 4096, 1 dummy scan and 16 total scans. During a separate 31P MRS acquisition, the participant was instructed to begin isometric leg kicking2, during which MRS data was collected as follows: TR 1.5 s, average spectra acquired at a rate of 6 seconds per spectrum for a total of 75 spectra. The relative height of the PCr peak was monitored in real time, and the participant was instructed to stop kicking when the PCr peak height was reduced to 40 ± 10% of baseline. This range has shown to provide adequate PCr depletion while maintaining physiological pH.3 The post-processing of spectra was executed with jMRUI version 5.24 and quantitation of metabolite peaks was performed in the time domain with the AMARES (Advanced Method for Accurate, Robust, and Efficient Spectral fitting) algorithm.5 Confirmed PCr resonance peak data was transferred into Matlab (MathWorks, Natick, MA) and fitted with a mono-exponential equation $$f(t) = PCr0+PCr1(1-exp(-t/tau))$$where the PCr peak at each moment in time (t) is expressed as a function of the recovery rate (tau) and scaling coefficients (PCr0 and PCr1). Participants provided approximately 600 mg of muscle using the Bergstrom technique6 in the vastus lateralis. The tissue was further processed for mRNA and protein extractions. Statistical analysis was performed using STATA® software version 12.0 (StataCorp LP, College Station, TX, USA). Separate linear regression models had PCr resynthesis rate as the dependent variable, and VO2 peak, one mRNA level among PGC-1α, NAMPT, SIRT1, or NQO1, or one protein level among PGC-1α, NAMPT, SIRT1, or NQO1 as the independent variable.
Results and Discussion
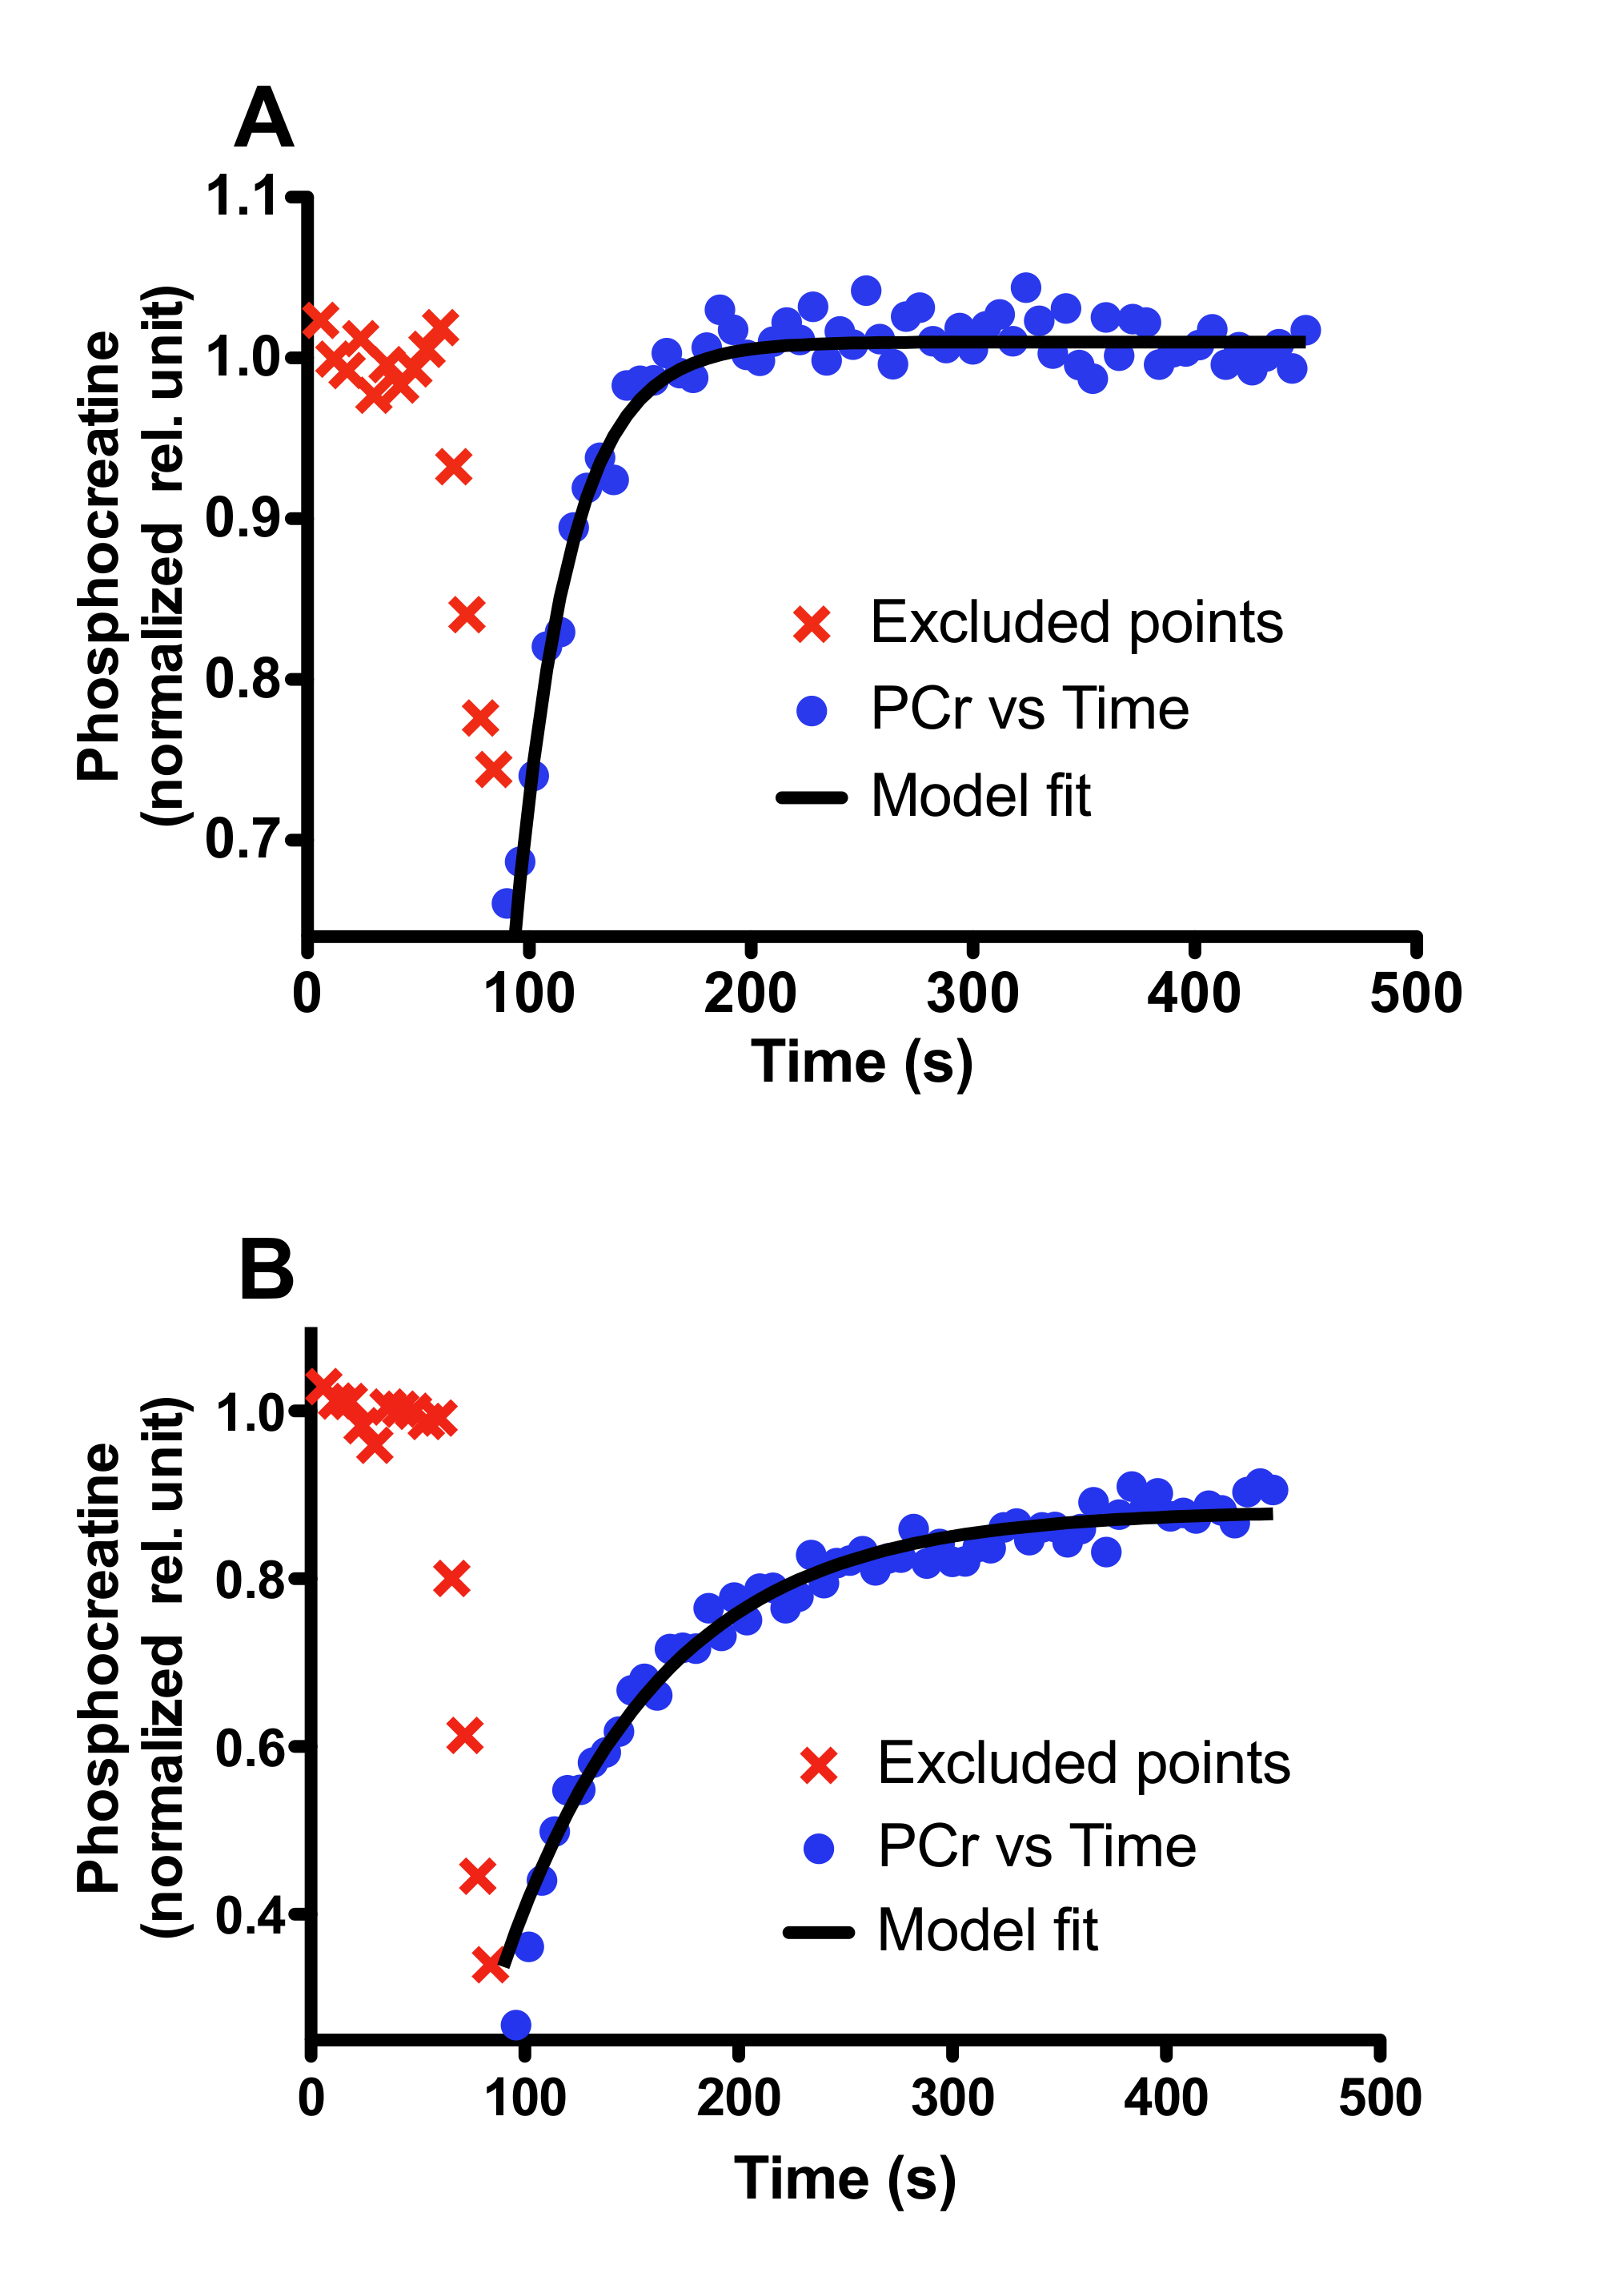
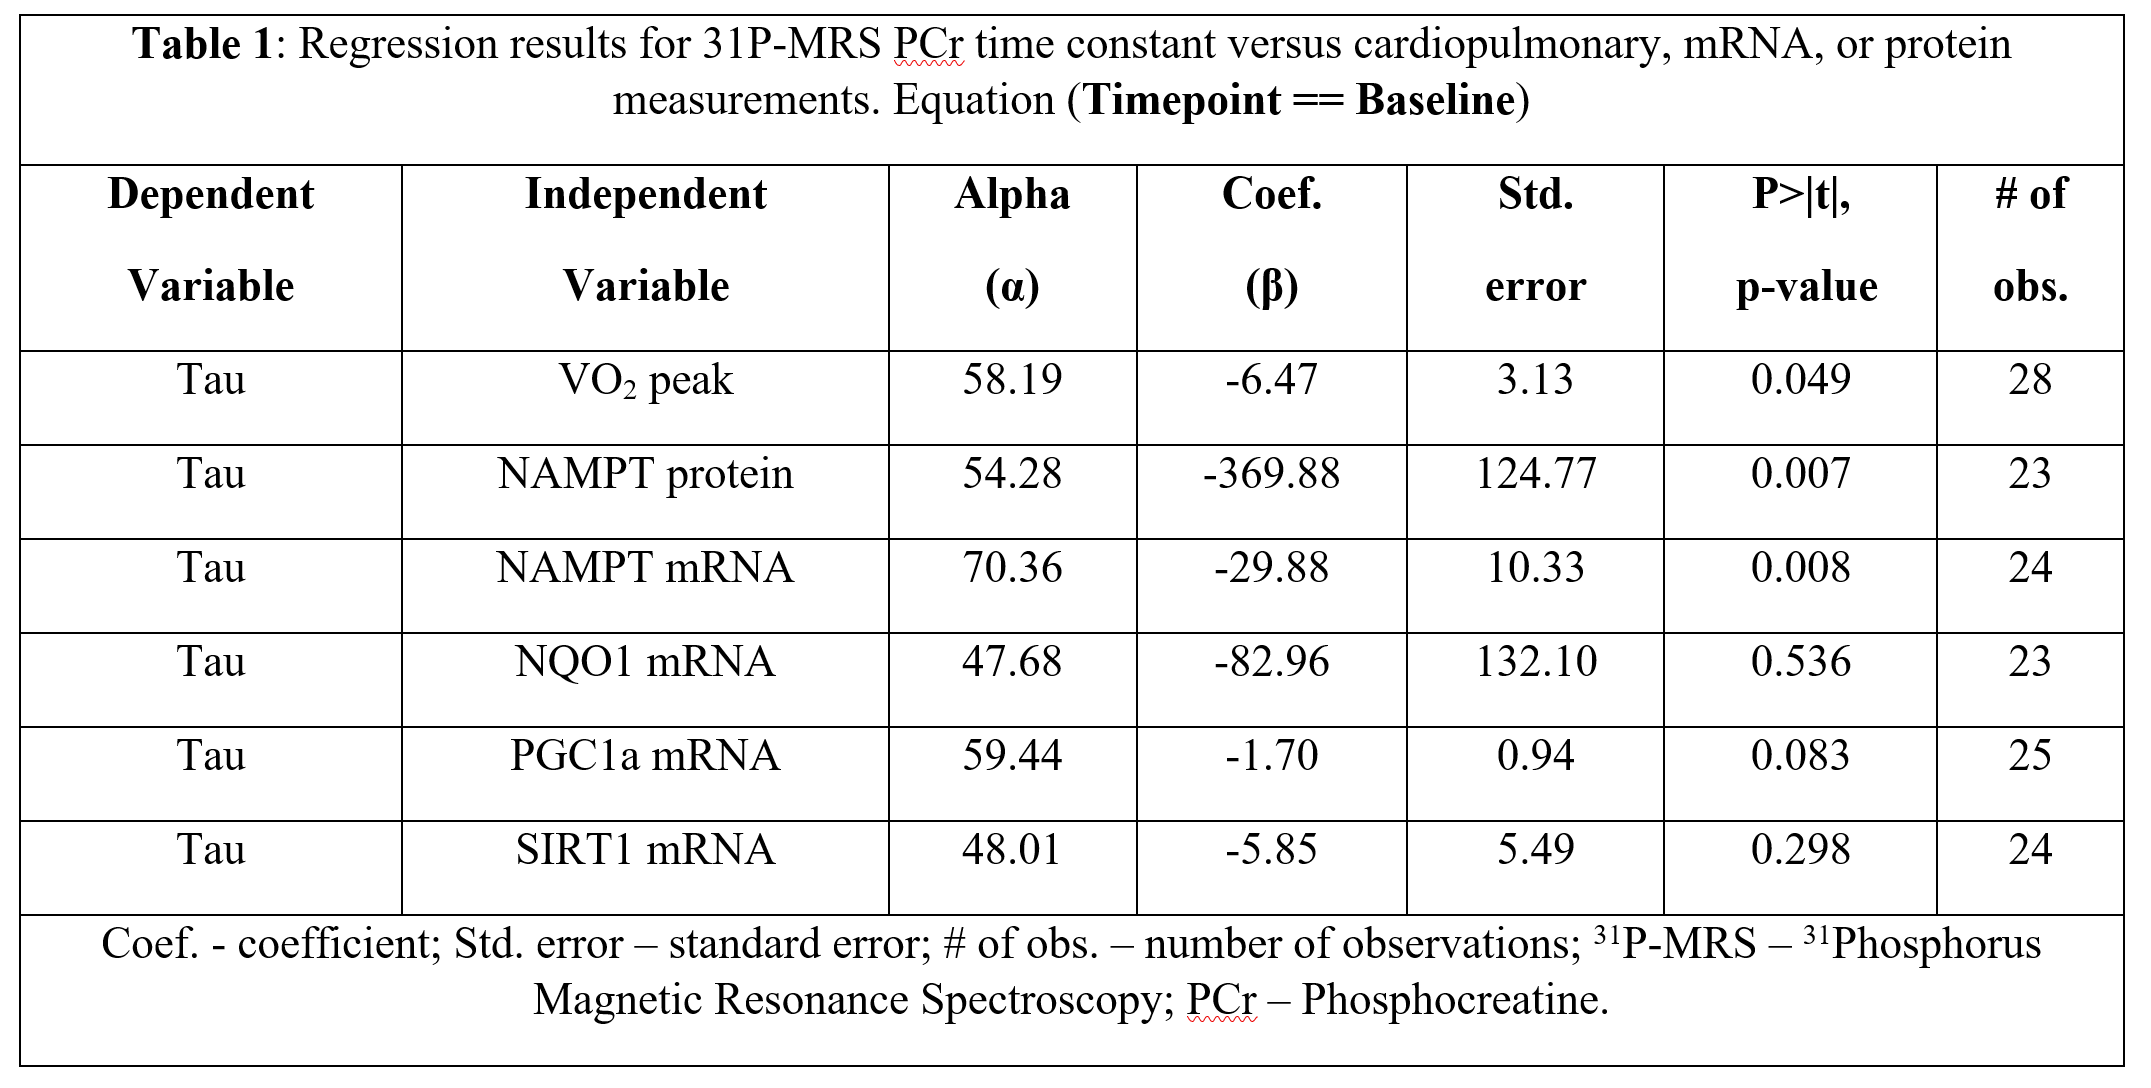
Representative time courses of PCr are illustrated in Figure 1 for fast and slow PCr resynthesis rate. PCr resynthesis times calculated from mono-exponential model fits were indicated as relatively short (24.1 s) and long (73.3 s). Greater VO2 peak and NAMPT protein levels were associated with faster PCr resynthesis time at baseline (p<0.05) (Table 1). In addition, greater NAMPT mRNA level was associated with faster PCr resynthesis time (p<0.05). However, mRNA levels of PGC-1α, SIRT1 and NQO1 were not significantly associated with PCr resynthesis time (Table 1).The association between NAMPT protein levels and PCr resynthesis rate is biologically relevant, given the role it plays in energy metabolism. In mammals, NAMPT is a rate-limiting enzyme that directly catalyzes the condensation of nicotinamide (NAM) with α-D-5-phosphoribosyl-1-pyrophosphate to synthesize nicotinamide mononucleotide (NMN). NMN is a pivotal precursor in the biosynthesis of nicotinamide dinucleotide (NAD+). However, mammals lack the capacity to directly convert NAM into NMN. Therefore, it is biologically important to salvage and recycle NAD+. Synthesized NAD+ becomes a key cofactor in oxidative phosphorylation within the inner mitochondrial membrane. Oxidative phosphorylation leads to adenosine triphosphate (ATP) production, which in turn influences the coupled reactions of creatine kinase that are crucial for contraction and relaxation of myocyte and therefore critically determines PCr resynthesis rate. Two human studies have supported the importance of NAMPT as well.2,7 We however present the first confirmation that elevated NAMPT protein levels may be directly involved in faster PCr resynthesis rate in healthy adults who did not undergo exercise training.
Acknowledgements
We very much appreciate the support and contribution of Lauren M. Sparks, Connie Murla, and clinical staff of the Pennington Biomedical Clinical Cores. Also, we appreciate the diligence of our research participants throughout the duration of the study.
The research project described here was supported by the National Institutes of Health Grants: R01 AG030226, U01 AG020478, and funded in part by P30 DK072476 and U54 GM104940. Additional support was provided by the Pennington Biomedical Research Foundation.
References
- Cordente AG, Lopez-Vinas E, Vazquez MI, Swiegers JH, Pretorius IS, Gomez-Puertas P, Hegardt FG, Asins G, Serra D. Redesign of carnitine acetyltransferase specificity by protein engineering. J Biol Chem 2004; 279(32), 33899-33908.
- Costford SR, Bajpeyi S, Pasarica M, Albarado DC, Thomas SC, Xie H, Church TS, Jubrias SA, Conley KE, Smith SR. Skeletal muscle NAMPT is induced by exercise in humans. Am J Physiol Endocrinol Metab 2010; 298(1), E117-126.
- Moon RB, Richards JH. Determination of intracellular pH by 31P magnetic resonance. J Biol Chem 1973; 248(20), 7276-7278.
- Vanhamme L, van den Boogaart A, Van Huffel S. Improved method for accurate and efficient quantification of MRS data with use of prior knowledge. J Magn Reson 1997; 129 (1), 35-43.
- Stefan D, Cesare FD, Andrasescu A, Popa E, Lazariev A, Vescovo E, Strbak O, Williams S, Starcuk Z, Cabanas M, Ormondt Dv, Graveron-Demilly D. Quantitation of magnetic resonance spectroscopy signals: the jMRUI software package. Meas Sci Technol 2009; 20.
- Bergstrom J. Percutaneous needle biopsy of skeletal muscle in physiological and clinical research. Scand J Clin Lab Invest 1975; 35 (7): 609-616.
- Haus JM, Solomon TP, Marchetti CM, O'Leary VB, Brooks LM, Gonzalez F, Kirwan JP. Decreased visfatin after exercise training correlates with improved glucose tolerance. Med Sci Sports Exerc 2009; 41(6):1255-1260.
Figures