2702
Comparison of measurements of intramuscular fat from T1-weighted and mDixon MRI scans in people with and without spinal cord injury
Bart Bolsterlee1,2, Elizabeth A Bye3,4, Junya Eguchi1,5, Joanne Glinsky3, Jeanette Thom5, and Robert D Herbert1,5
1Neuroscience Research Australia, Randwick, Australia, 2Graduate School of Biomedical Engineering, University of New South Wales, Randwick, Australia, 3John Walsh Centre for Rehabilitation Research, Sydney University, Sydney, Australia, 4Spinal Injury Unit, Prince of Wales Hospital, Randwick, Australia, 5School of Medical Sciences, University of New South Wales, Randwick, Australia
1Neuroscience Research Australia, Randwick, Australia, 2Graduate School of Biomedical Engineering, University of New South Wales, Randwick, Australia, 3John Walsh Centre for Rehabilitation Research, Sydney University, Sydney, Australia, 4Spinal Injury Unit, Prince of Wales Hospital, Randwick, Australia, 5School of Medical Sciences, University of New South Wales, Randwick, Australia
Synopsis
Accurate quantification of fat content of human muscles could help assess disease status and test effectiveness of interventions in people with neurological conditions, whose muscles are frequently infiltrated with fat. We compared two commonly used MRI methods based on T1-weighted and mDixon scans to quantify intramuscular fat in 112 muscles from people with and without spinal cord injury. Fat fraction measurements agreed well in muscles with high proportions of fat, but the T1-weighted method could not be used in muscles with small proportions of fat. We recommend against the use of T1-weighted methods to quantify intramuscular fat.
Introduction
Healthy muscles are composed predominantly of water and contractile proteins, but also contain small amounts of fat1. Muscles affected by various neurological conditions, e.g. stroke, cerebral palsy or spinal cord injury, frequently have an increased proportion of fat2, which may contribute to weakness and increased stiffness of these muscles. Accurate quantification of intramuscular fat content could help assess disease status and progression, and test the effectiveness of interventions aimed at reducing intramuscular fat content.The primary aim of this study was to compare measurements of whole-muscle fat fraction in human muscles using two commonly used MRI methods. The first method uses T1-weighted scans to classify voxels as ‘fat’ or ‘muscle’ based on an intensity threshold2,3. The second method uses mDixon scans in which differences in chemical shift frequency between water and fat are used to quantify, for each voxel, a fat proportion4. We compare a total of 224 fat fraction measurements before and after strength training in individuals with spinal cord injury and able-bodied individuals.
Methods
We used previously published T1-weighted and mDixon MRI scans of the left or right thigh of nine individuals with partially paralysed muscles following spinal cord injury (group SCI; median (IQR) age 47 (37 to 66) years; see ref 5 for details of participant characteristics). Here we report further analyses of those data and of new scans from 11 able-bodied young individuals (group AB; age 20 (19 to 22) years) (Fig. 1).Scans were obtained both before and after a six-week (SCI) or eight-week (able-bodied) progressive resistance training program of the upper leg5. Measurements of fat fractions were made on a total of 112 muscles (68 from participants with SCI and 44 from able-bodied participants), both before and after training.
The following scan parameters were used. mDixon: 2-point 3D multi-echo mDixon fast field echo (FFE) sequence, TR/TE1/TE2=5.9/3.5/4.6ms, field of view (FOV)=180 × 180mm, acquisition matrix=180 × 180 (reconstructed to 192 × 192), slice=1 mm, number of slices=320 and scan time of 334 s. T1-weighted: TSE sequence, TR/TE=700/12 ms, FOV=180 × 180 mm, acquisition matrix=256 × 188 (reconstructed to 864 × 864), slice=4 mm, number of slices=80.
The four quadriceps muscles were manually segmented on the scans. In the group with SCI, the four hamstring muscles were also segmented. Segmentations were cropped by 2 mm to ensure exclusion of all extramuscular tissues. T1-weighted scans were corrected for B0-inhomogeneities. For each muscle and slice of the T1-weighted scan, voxels were classified as either ‘fat’ or ‘muscle’ using a fuzzy C-means clustering algorithm (exponent 2, max. iterations 200, end tolerance 0.01)6. Whole-muscle fat fraction was calculated (%fat T1) by dividing the number of ‘fat’ voxels by the total number of ‘fat and ‘muscle’ voxels, excluding slices for which visual inspection revealed implausible classification. Muscles for which more than 50% of slices were deemed implausible were excluded from further analysis. From the mDixon scans, fat fractions per voxel were calculated by dividing the intensity of the mDixon fat image by the sum of the intensities of the mDixon water and fat image. Fat fractions per muscle (%fat mDixon) were calculated as the average fat fraction of all voxels assigned to that muscle.
Fat fraction measurements from T1 and mDixon scans were compared using the mean signed difference, the mean absolute difference and the absolute agreement intraclass correlation coefficient (ICC) adjusted for clustering at the level of participant, muscle and time of measurement (pre/post training). The strength training intervention appeared to not affect the structure5 and proportion of fat in muscles, so we used the pre- and post-training data to determine minimal detectable differences (MDD) for both methods.
Results
Fat fraction measurements were successfully obtained from mDixon scans for all muscles. The %fat mDixon in the able-bodied group was 5.7 ± 1.6 % and in the group with SCI 22.3 ± 18.3 % (values are mean ± SD).In the group with SCI, 31/136 (23%) of measurements from T1-weighted scans were excluded. The excluded muscles had a smaller proportion of fat (7.4%, measured from mDixon) than the group average (22.3%). In the able-bodied group, the algorithm could not find a distinctive threshold between fat and muscle, so it was not possible to obtain plausible measurements of %fat from T1-weighted scans. A plausible threshold could also not be identified manually.
There was high agreement (ICC = 0.76, 95% CI 0.67 to 0.84) between %fat mDixon and %fat T1 in muscles of people with SCI (Fig. 2). The mean absolute difference between the measures was 5.1 ± 6.2%. There was little systematic difference between the methods: the mean signed difference was 1.1 ± 8.0%.
The minimal detectable difference in the group with SCI was 4.2% and 8.9% using the mDixon and T1-weighted measures, respectively.
Conclusion
T1-weighted and mDixon measurements of intramuscular fat fractions agreed well in muscles with high proportions of fat (group with SCI), but we could not obtain plausible measurements of intramuscular fat using the T1-weighted method in muscles with small proportions of fat. The T1-weighted measures were also less reproducible than the mDixon measures. We recommend the use of mDixon methods rather than T1-weighted methods for quantification of intramuscular fat fraction.Acknowledgements
The authors acknowledge the facilities and scientific and technical assistance of NeuRA Imaging, a node of the National Imaging Facility, a National Collaborative Research Infrastructure Strategy (NCRIS) capability.References
- Addison O, Marcus RL, Lastayo PC, Ryan AS. Intermuscular fat: a review of the consequences and causes. Int J Endocrinol. 2014;article ID 309570.
- Gorgey AS, Dudley GA. Skeletal muscle atrophy and increased intramuscular fat after incomplete spinal cord injury. Spinal cord. 2007;45(4):304-309.
- Johnson DL, Miller F, Subramanian P, Modlesky CM. Adipose tissue infiltration of skeletal muscle in children with cerebral palsy. J Pediatr. 2009;154(5):715-720.
- Noble JJ, Charles-Edwards GD, Keevil SF, Lewis AP, Gough M, Shortland AP. Intramuscular fat in ambulant young adults with bilateral spastic cerebral palsy. BMC Musc Dis. 2014;15(1):236.
- Bye EA, Harvey LA, Glinsky JV, Bolsterlee B, Herbert RD. A preliminary investigation of mechanisms by which short-term resistance training increases strength of partially paralysed muscles in people with spinal cord injury. Spinal cord. 2019.
- Davis DL, Kesler T, Gilotra MN, et al. Quantification of shoulder muscle intramuscular fatty infiltration on T1-weighted MRI: a viable alternative to the Goutallier classification system. Skeletal Radiol. 2019;48(4):535-541.
Figures
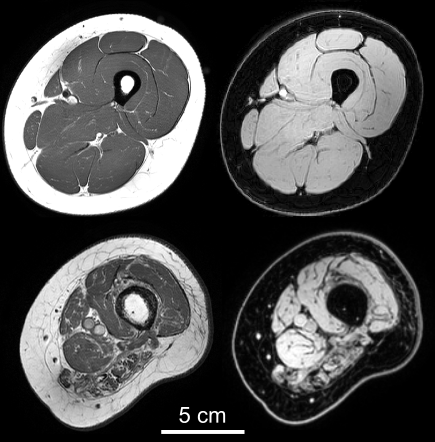
Example of a T1-weighted (left column) and mDixon
water image (right) from an able-bodied individual (top row) and an individual
with partially paralysed hamstring muscles following spinal cord injury (bottom).

Fat percentage calculated with mDixon and
T1-weighted methods in muscles of people with spinal cord injury (n=105). The
diagonal line is the line of identity.