2700
Compressed sensing three-directional 3D velocity imaging of the skeletal muscle during evoked isometric contraction of the arm
Xeni Deligianni1,2, Francesco Santini1,2, Anna Hirschmann3, Ning Jin4, Nicolas Place5, Oliver Bieri1,2, and Claudia Weidensteiner1,2
1Radiology/Division of Radiological Physics, University Hospital of Basel, Basel, Switzerland, 2Biomedical Engineering, University of Basel, Basel, Switzerland, 3Radiology, University Hospital of Basel, Basel, Switzerland, 4Siemens Medical Solutions, Cleveland, Cleveland, OH, United States, 5Institute of Sport Sciences, University of Lausanne, Lausanne, Switzerland
1Radiology/Division of Radiological Physics, University Hospital of Basel, Basel, Switzerland, 2Biomedical Engineering, University of Basel, Basel, Switzerland, 3Radiology, University Hospital of Basel, Basel, Switzerland, 4Siemens Medical Solutions, Cleveland, Cleveland, OH, United States, 5Institute of Sport Sciences, University of Lausanne, Lausanne, Switzerland
Synopsis
MRI of the upper extremities is important for the follow-up of muscle dystrophies. The goal of this study was to investigate the feasibility of 4D-velocity imaging during neuromuscular electrical stimulation(NMES) of the arm, standardized with the force output. Two healthy volunteers were scanned at 3T during isometric contraction of the biceps brachii for different elbow angles. While the force output was different in intensity, the waveforms of force and strain were similar. In conclusion, it was shown that it is possible to acquire 3D-dynamic velocity data synchronized with NMES of the arm and simultaneously record the evoked force.
INTRODUCTION
The upper extremities can be severely affected by various muscle dystrophies1,2, with a serious impact on the patients’ life quality. Although MRI techniques for voluntary contraction of the arm have been presented for the understanding of contraction mechanisms3,4, the literature is limited regarding 3D dynamic visualization of the arm function. The goal of this study was to investigate the feasibility of three-directional 3D velocity imaging of neuromuscular electrical muscle stimulation (NMES) of the upper extremities, that can be beneficial both for diagnosis and for treatment follow-up.METHODS
Two healthy volunteers (1 male (age: 31 y) /1 female (age: 47 y)) were scanned twice with different settings at a 3T MRI scanner (MAGNETOM Prisma, Siemens Healthcare, Erlangen, Germany) during neuromuscular electrical stimulation of the biceps brachii muscle. Superficial gel-based electrodes of different sizes (5x8 cm2 and 5x5 cm2) were placed on the biceps brachii (see Fig. 1) and the arm was positioned at 0° and 60° flexion angle. During the experiment, the participant was holding a 3D-printed handle (see Fig. 1), adapted to measure volar flexion force5. The muscle belly stimulation intensity was increased until a clearly periodic force curve was registered by the force sensor. This level was defined in a test session before placing the subject in the bore. A commercial 2-channel NMES device (EM49, Beurer GmbH, Ulm, Germany), was used to induce periodic muscle contraction. Biphasic stimulation with rectangular pulses was applied (pulse width: 400μs, pulse frequency: 80Hz, contraction duration: 750ms, release duration: 750ms release, current amplitude 10-20 mA). The second channel of the NMES device generated a signal, which was converted by a custom electronic device and used as trigger for the MRI acquisition6. A prototype prospectively-gated highly accelerated Cartesian 4D flow imaging sequence was applied for the dynamic acquisition7,8. The sequence uses L1-regularized wavelet-based compressed sensing. The volume-of-interest was placed in a sagittal orientation, parallel to the bone to cover the part of the upper arm between the two electrodes. The force output of volar flexion was continuously recorded. The imaging protocol had the following parameters: TE/ Time resolution/ TR= 3.5/ 49.6/ 6.2 ms, flip angle 10°, bandwidth 455 Hz/px, matrix size 144x72x48, resolution 2.1x2.1x2.1mm3, Venc 25 cm/s, 2 k-space lines per segments, acceleration factor 7.1. The acquisition time was 5 minutes per each dataset. The 3D-velocity datasets were subsequently post-processed offline to calculate the strain (i.e., the two principal eigenvalues and eigenvectors of the strain tensor) at each spatial location throughout the stimulation cycle 9. Time-resolved color-coded maps of the tensile strain (positive eigenvalue) and compressive strain (negative eigenvalue) were produced.RESULTS
The 3D-velocity imaging and strain calculation was successful in all cases, but the force could only be successfully registered when the elbow was flexed to 60° angle. On the strain maps, the different activation of various regions could be clearly visualized. The two different positions of the arm at 0° (i.e. parallel to the bore) and at 60° resulted in different 3D strain maps (Figs.2 and 3). At 0°, the biceps brachii and triceps brachii muscle could be easily differentiated (see Fig. 2) and corresponded to different eigenvalues. At 60°, the force-measurement setup and the arm positioning allowed to acquire dynamic images during NMES of the upper arm and simultaneously register the evoked force (see Figure 4). The velocity images were artifact-free and the Venc of 25 cm/s was sufficient for image acquisition. While the force output of the two volunteers was very different in intensity at 60° position (see Fig. 4), the shape of the waveform of the evoked force was very similar. The same effect was observed for the strain waveforms (see Fig. 5).DISCUSSION
It is well known that the upper extremities are affected by various muscle dystrophies2, with an important impact on the patients’ life quality. Therefore, non-invasive methods and biomarkers to study their physical condition and response to treatments are valuable. Here, it was shown that it is possible to acquire 3D-dynamic velocity data synchronized with NMES of the upper arm. The evoked force could be simultaneously registered when the elbow was flexed to 60°. Strain maps were successfully calculated and the first and second primary strain eigenvalues were extracted. In future studies, the current can also be chosen to reach a certain target force for a more quantitative analysis of the results.CONCLUSION
3D-velocity imaging of the upper arm can be performed during NMES with simultaneous evoked force recording. Moreover, important differences were observed in the evoked force and strain for different positions of the arm. The proposed method is easily implementable, allows dynamic 3D-velocity imaging and can potentially give insight into the physical condition of the upper extremities.Acknowledgements
This work was supported by the Swiss National Science Foundation (grant Nr. 172876).References
- Deymeer F, Serdaroğlu P, Poda M, Gülşen-Parman Y, Özçelık T, Özdemır C. Segmental distribution of muscle weakness in SMA III: implications for deterioration in muscle strength with time. Neuromuscul. Disord. 1997;7:521–528 doi: 10.1016/S0960-8966(97)00113-2.
- Willcocks RJ, Rooney WD, Triplett WT, et al. Multicenter prospective longitudinal study of magnetic resonance biomarkers in a large duchenne muscular dystrophy cohort. Ann Neurol 2016;79:535–547.
- Asakawa DS, Nayak KS, Blemker SS, et al. Real-time imaging of skeletal muscle velocity. J Magn Reson Imaging 2003;18:734–739.
- Pappas GP, Asakawa DS, Delp SL, Zajac FE, Drace JE. Nonuniform shortening in the biceps brachii during elbow flexion. J Appl Physiol 2002;92:2381–2389.
- Santini F, Bieri O, Deligianni X. OpenForce MR: A Low-Cost Open-Source MR-Compatible Force Sensor. In: Proc. Intl. Soc. Mag. Reson. Med. 26 (2018). Paris (France); 2018.
- Deligianni X, Pansini M, Garcia M, et al. Synchronous MRI of muscle motion induced by electrical stimulation. Magn Reson Med 2017;77:664–672 doi: 10.1002/mrm.26154.
- Liang D, Liu B, Wang J, Ying L. Accelerating SENSE using compressed sensing. Magn. Reson. Med. 2009;62:1574–1584 doi: 10.1002/mrm.22161.
- Liu J, Rapin J, Chang T, et al. Dynamic cardiac MRI reconstruction with weighted redundant Haar wavelets (abstr). Proc Int Soc Magn Reson Med 2012;67.
- Bergquist AJ, Clair JM, Collins DF. Motor unit recruitment when neuromuscular electrical stimulation is applied over a nerve trunk compared with a muscle belly: triceps surae. J. Appl. Physiol. Bethesda Md 1985 2011;110:627–637 doi: 10.1152/japplphysiol.01103.2010.
Figures
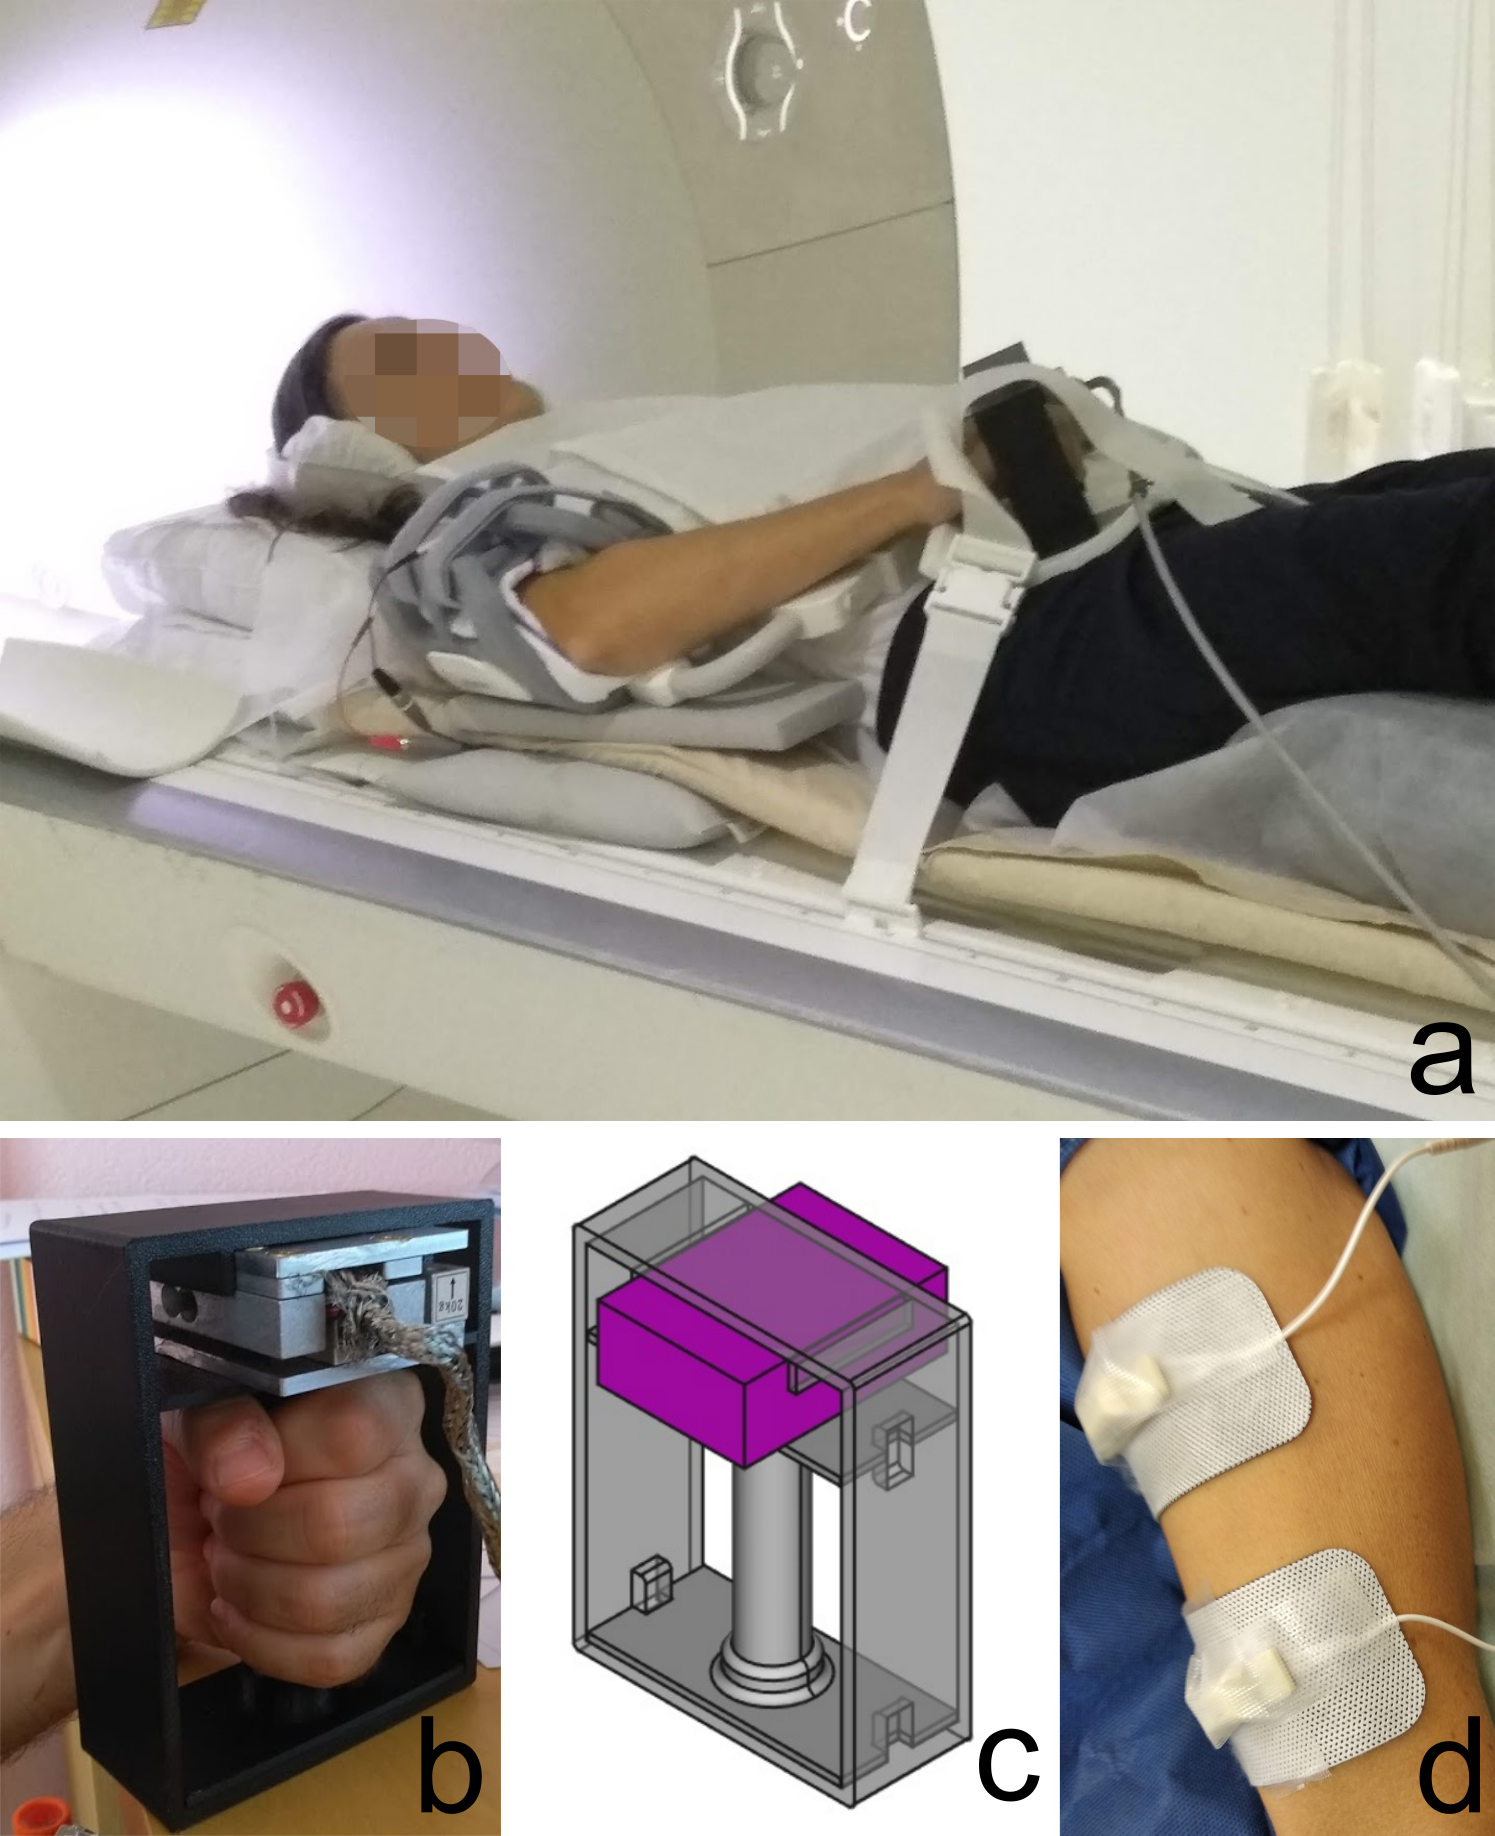
Figure
1: a. Positioning of the subject outside the scanner bore, b. Custom-made force measurement device, c. Design of the 3D -printed
base for the force sensor, d. Positioning of the electrodes on the
volar side of the upper arm.
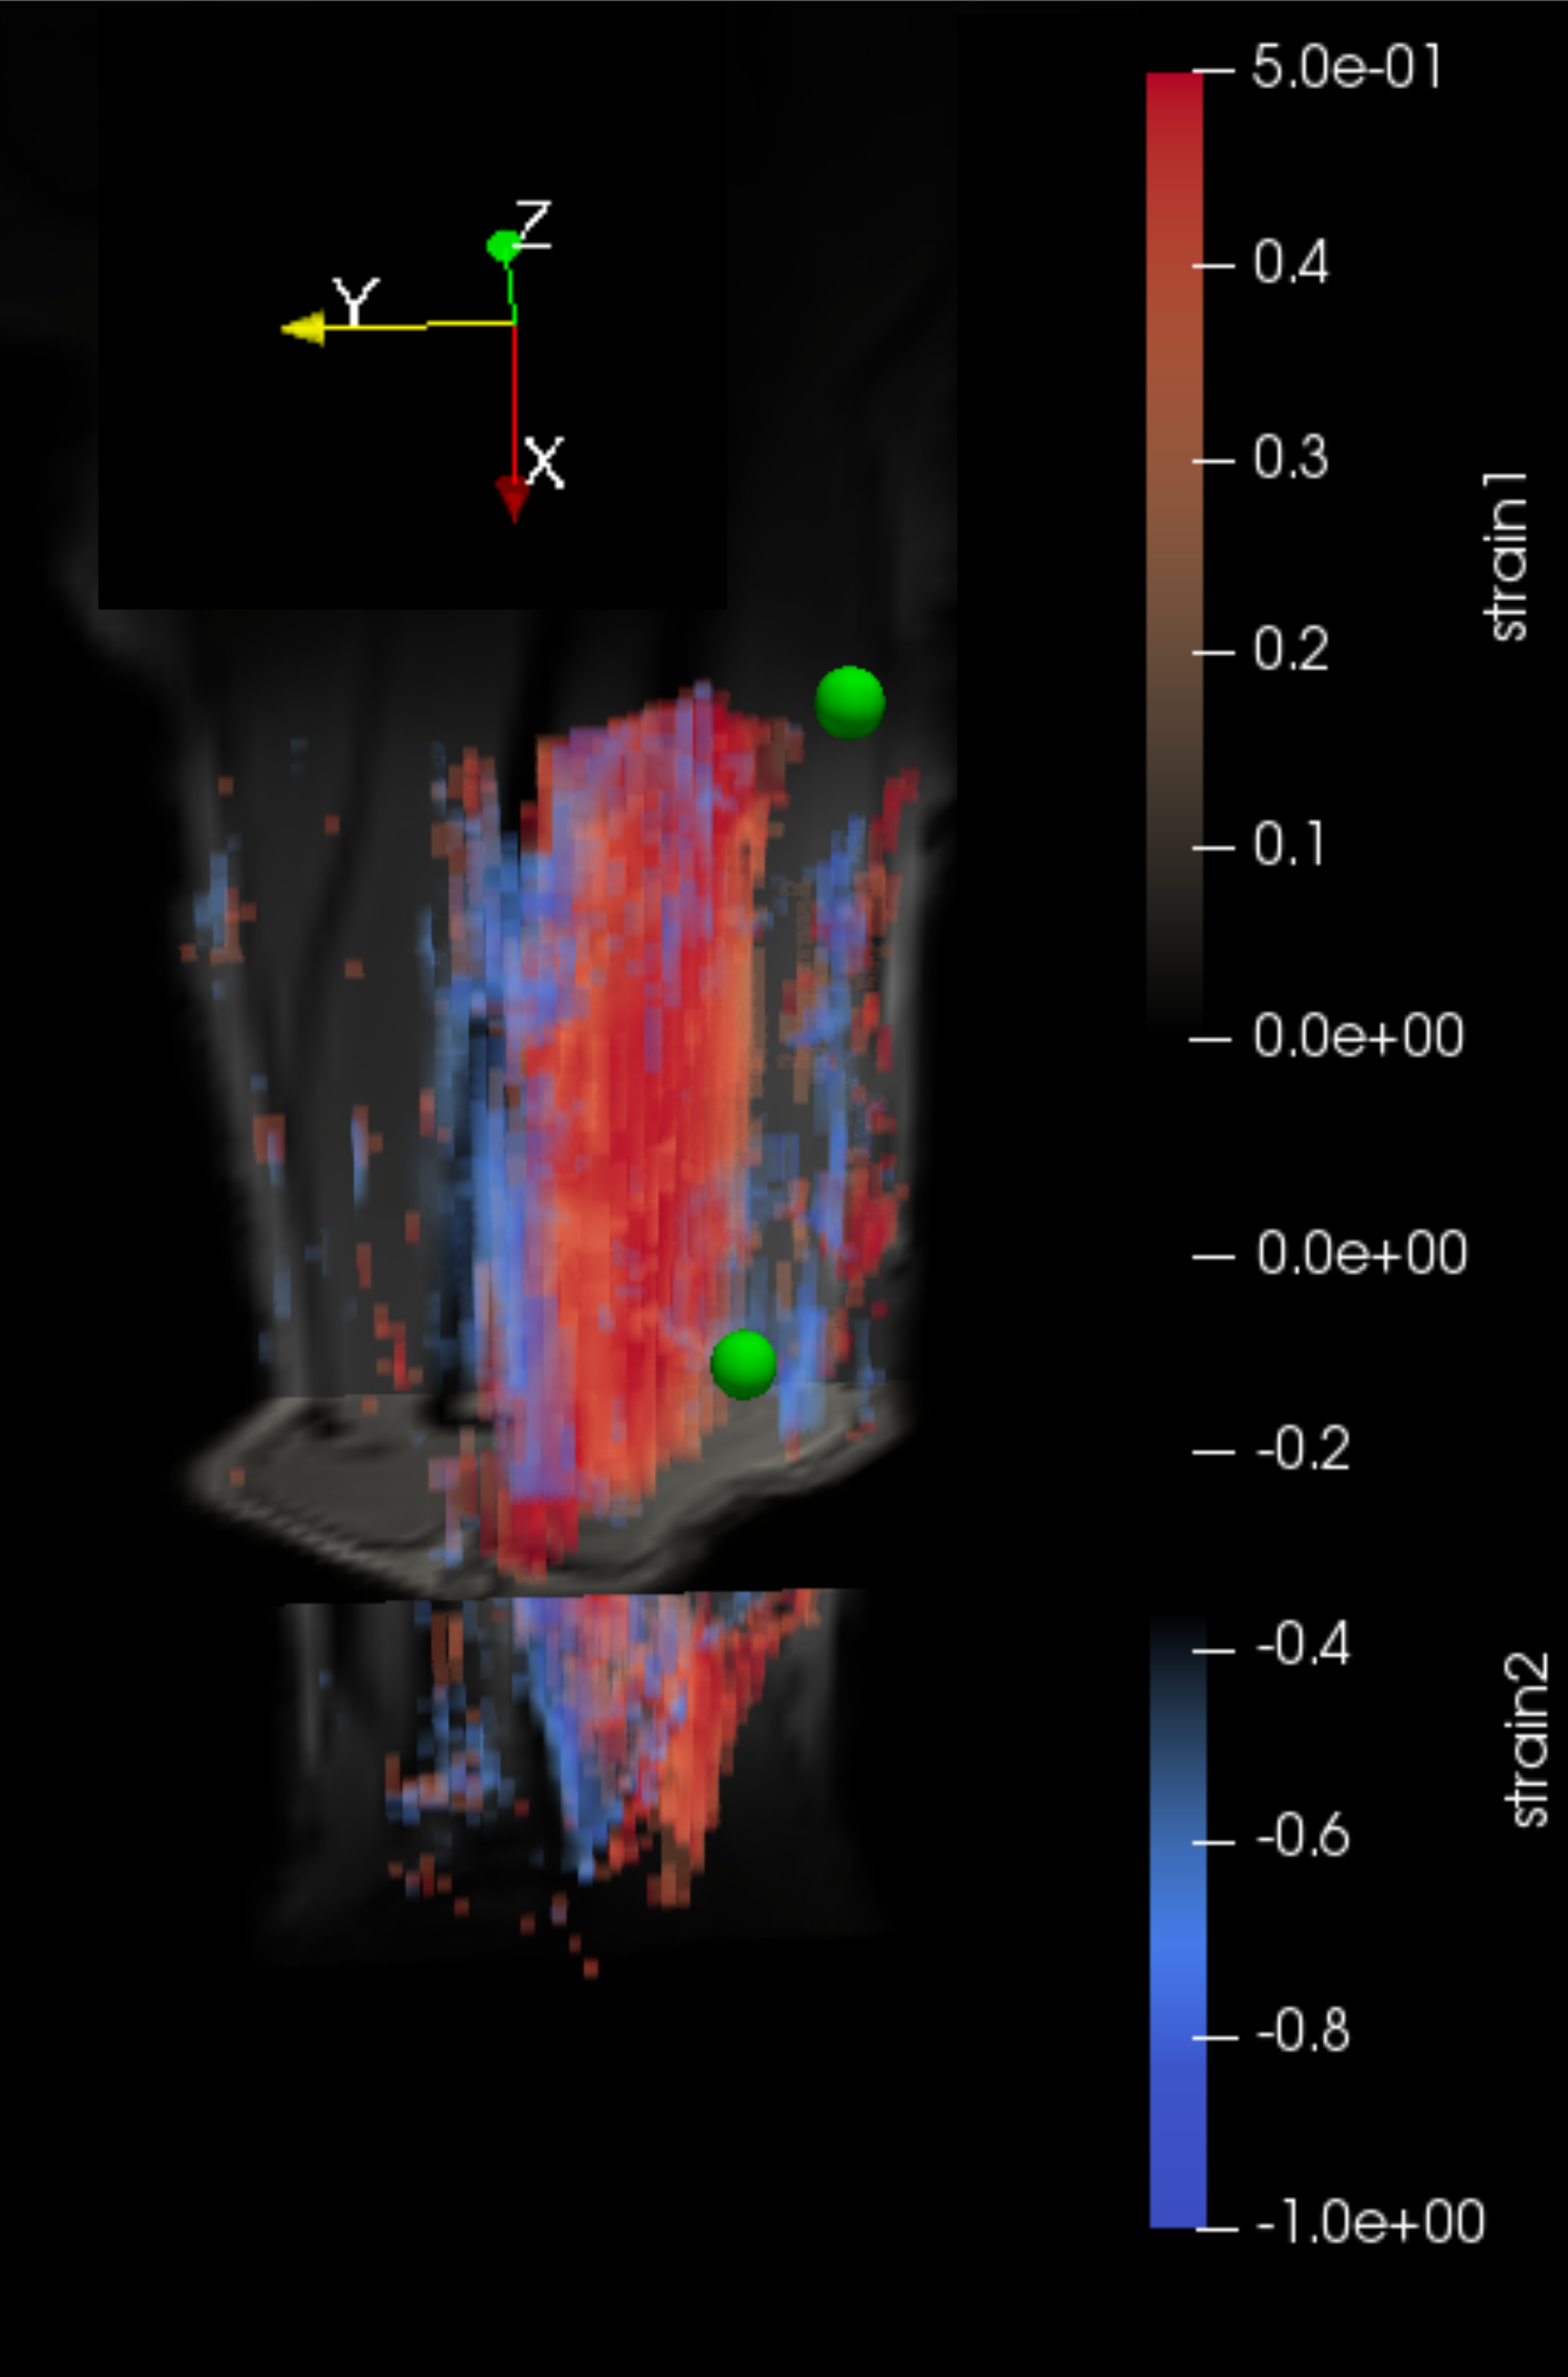
Figure
2. 3D strain maps
of the volar
upper arm from
volunteer
2. For
this acquisition the arm was positioned in a 0° angle. The
first (blue-tensile
strain)
and second (red-compressive)
principal strain components are presented.
The
position of the center of the two electrodes is indicated with green
spheres.
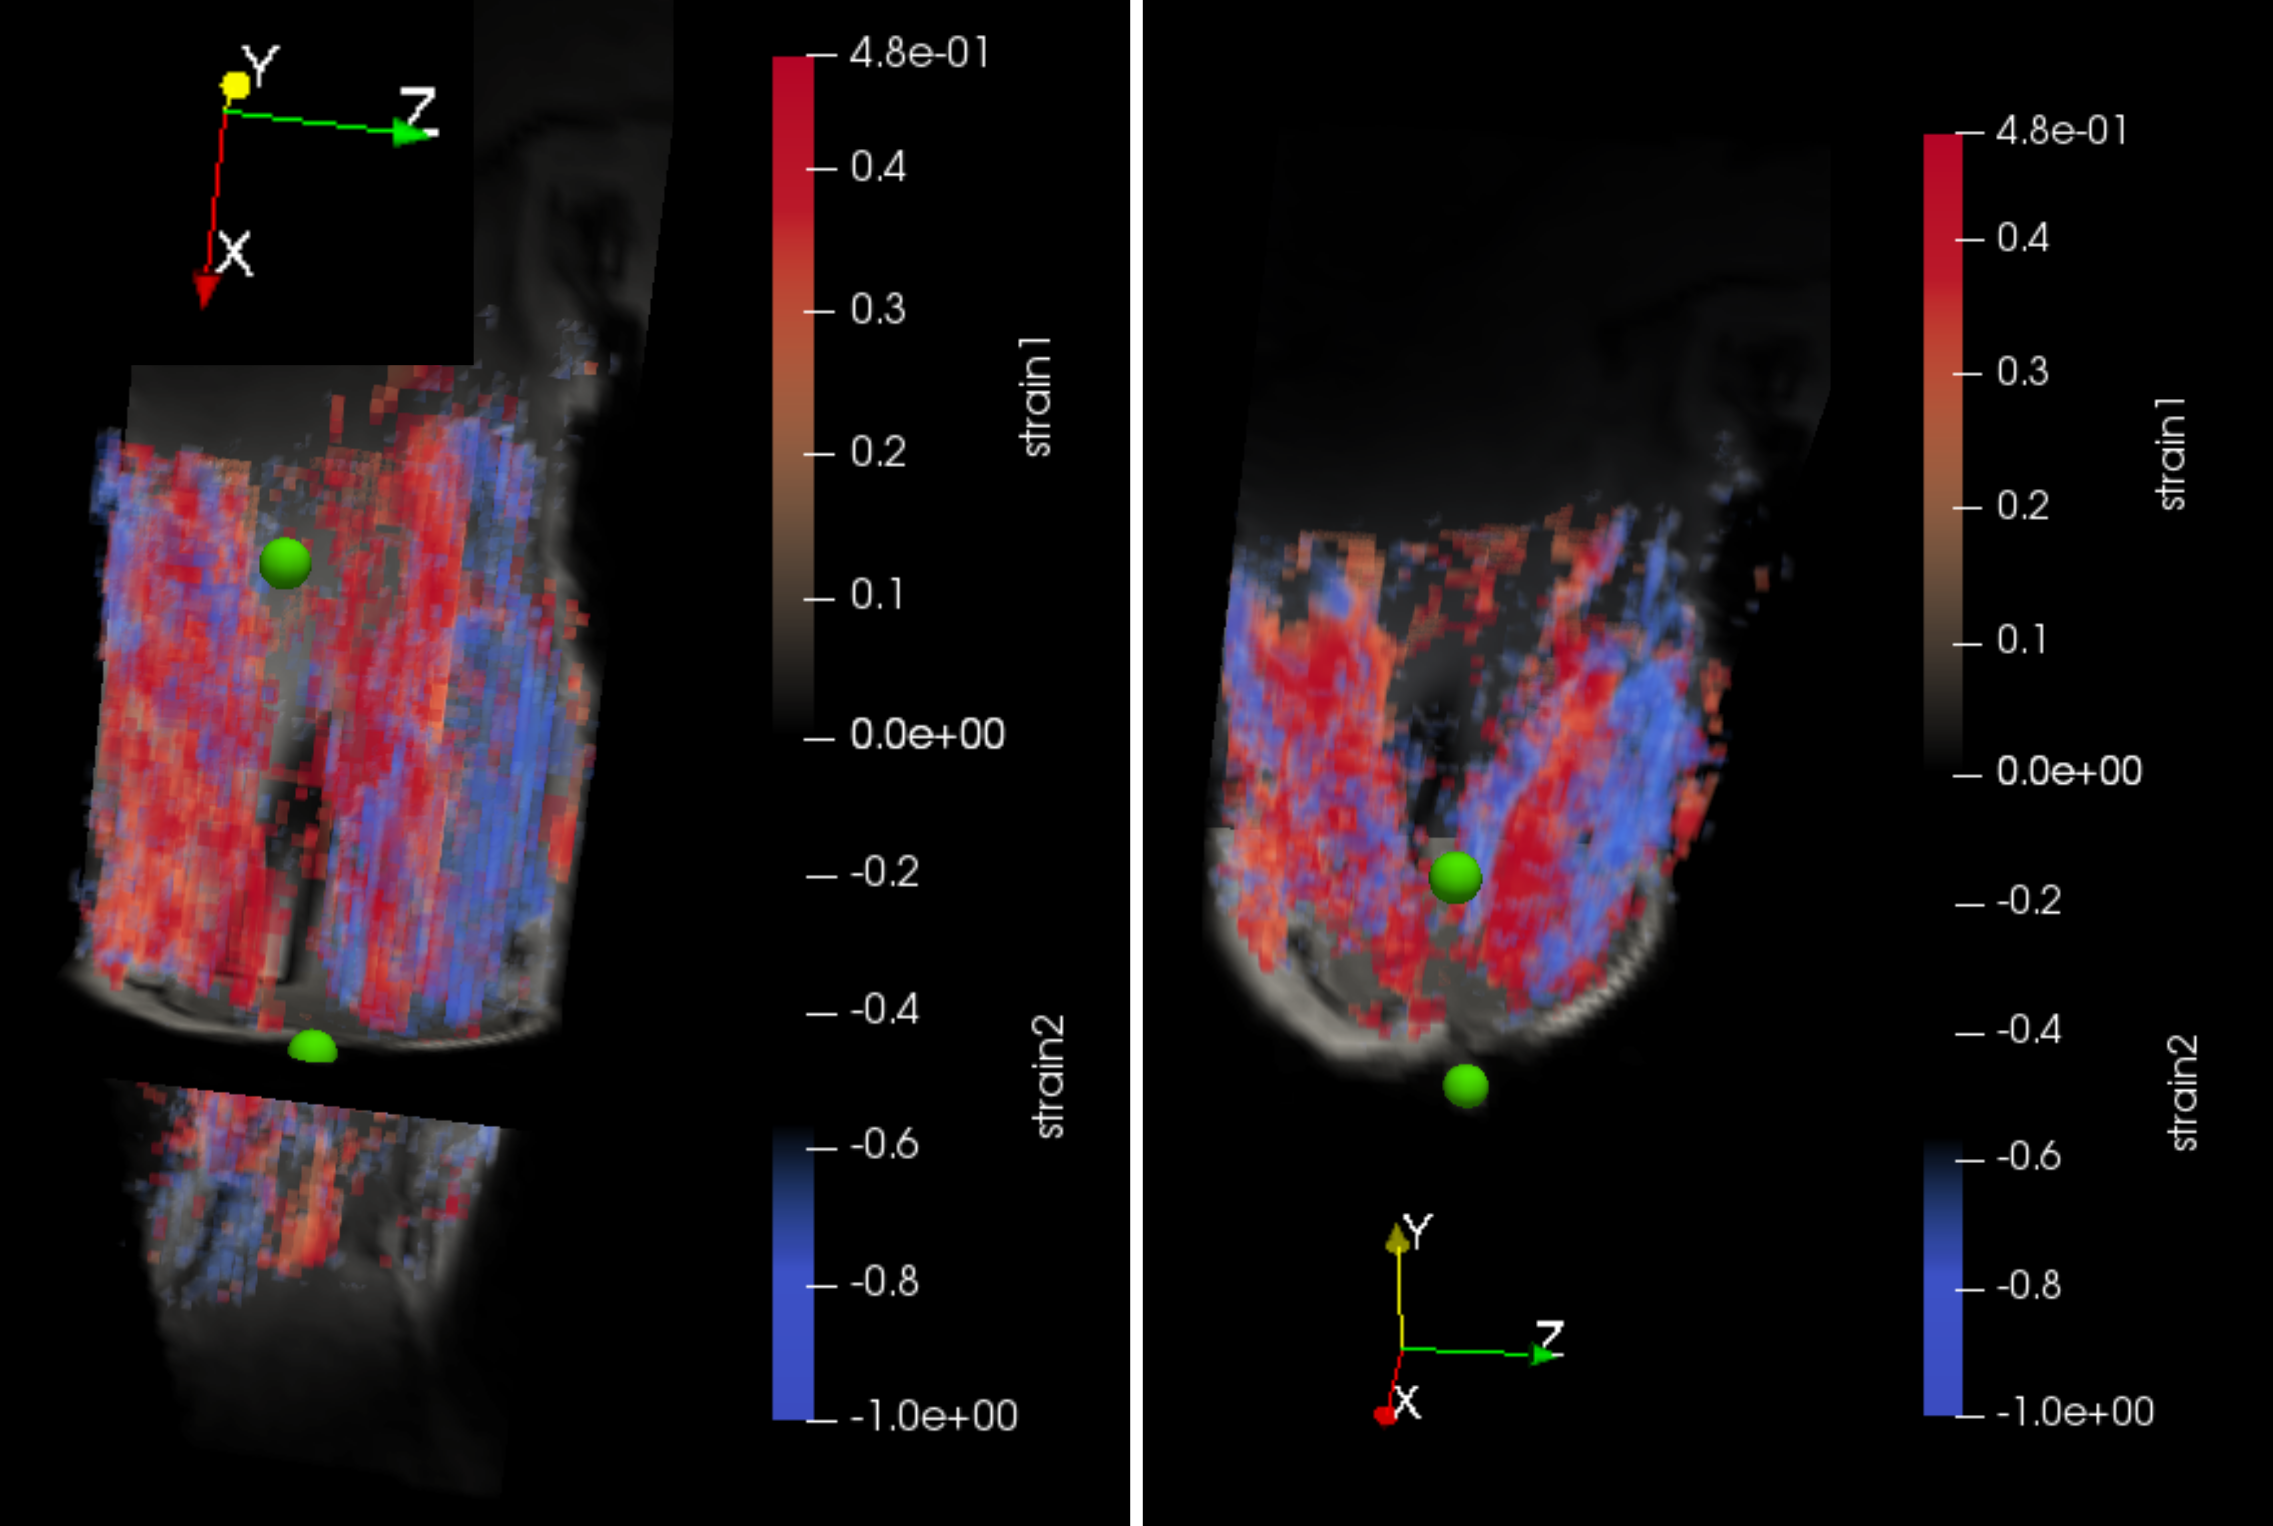
Figure
3.
3D strain maps of
the volar
upper arm
from
volunteer
2. For
this acquisition the arm was positioned in a 60° angle. Both
eigenvalues are visualized: The
first (blue-tensile)
and second(red-compressive)
principal strain components are presented.
The
position of the center of the two electrodes is indicated with green
spheres. Two
different 2D views are reconstructed: (left)
coronal, (bottom)
axial.
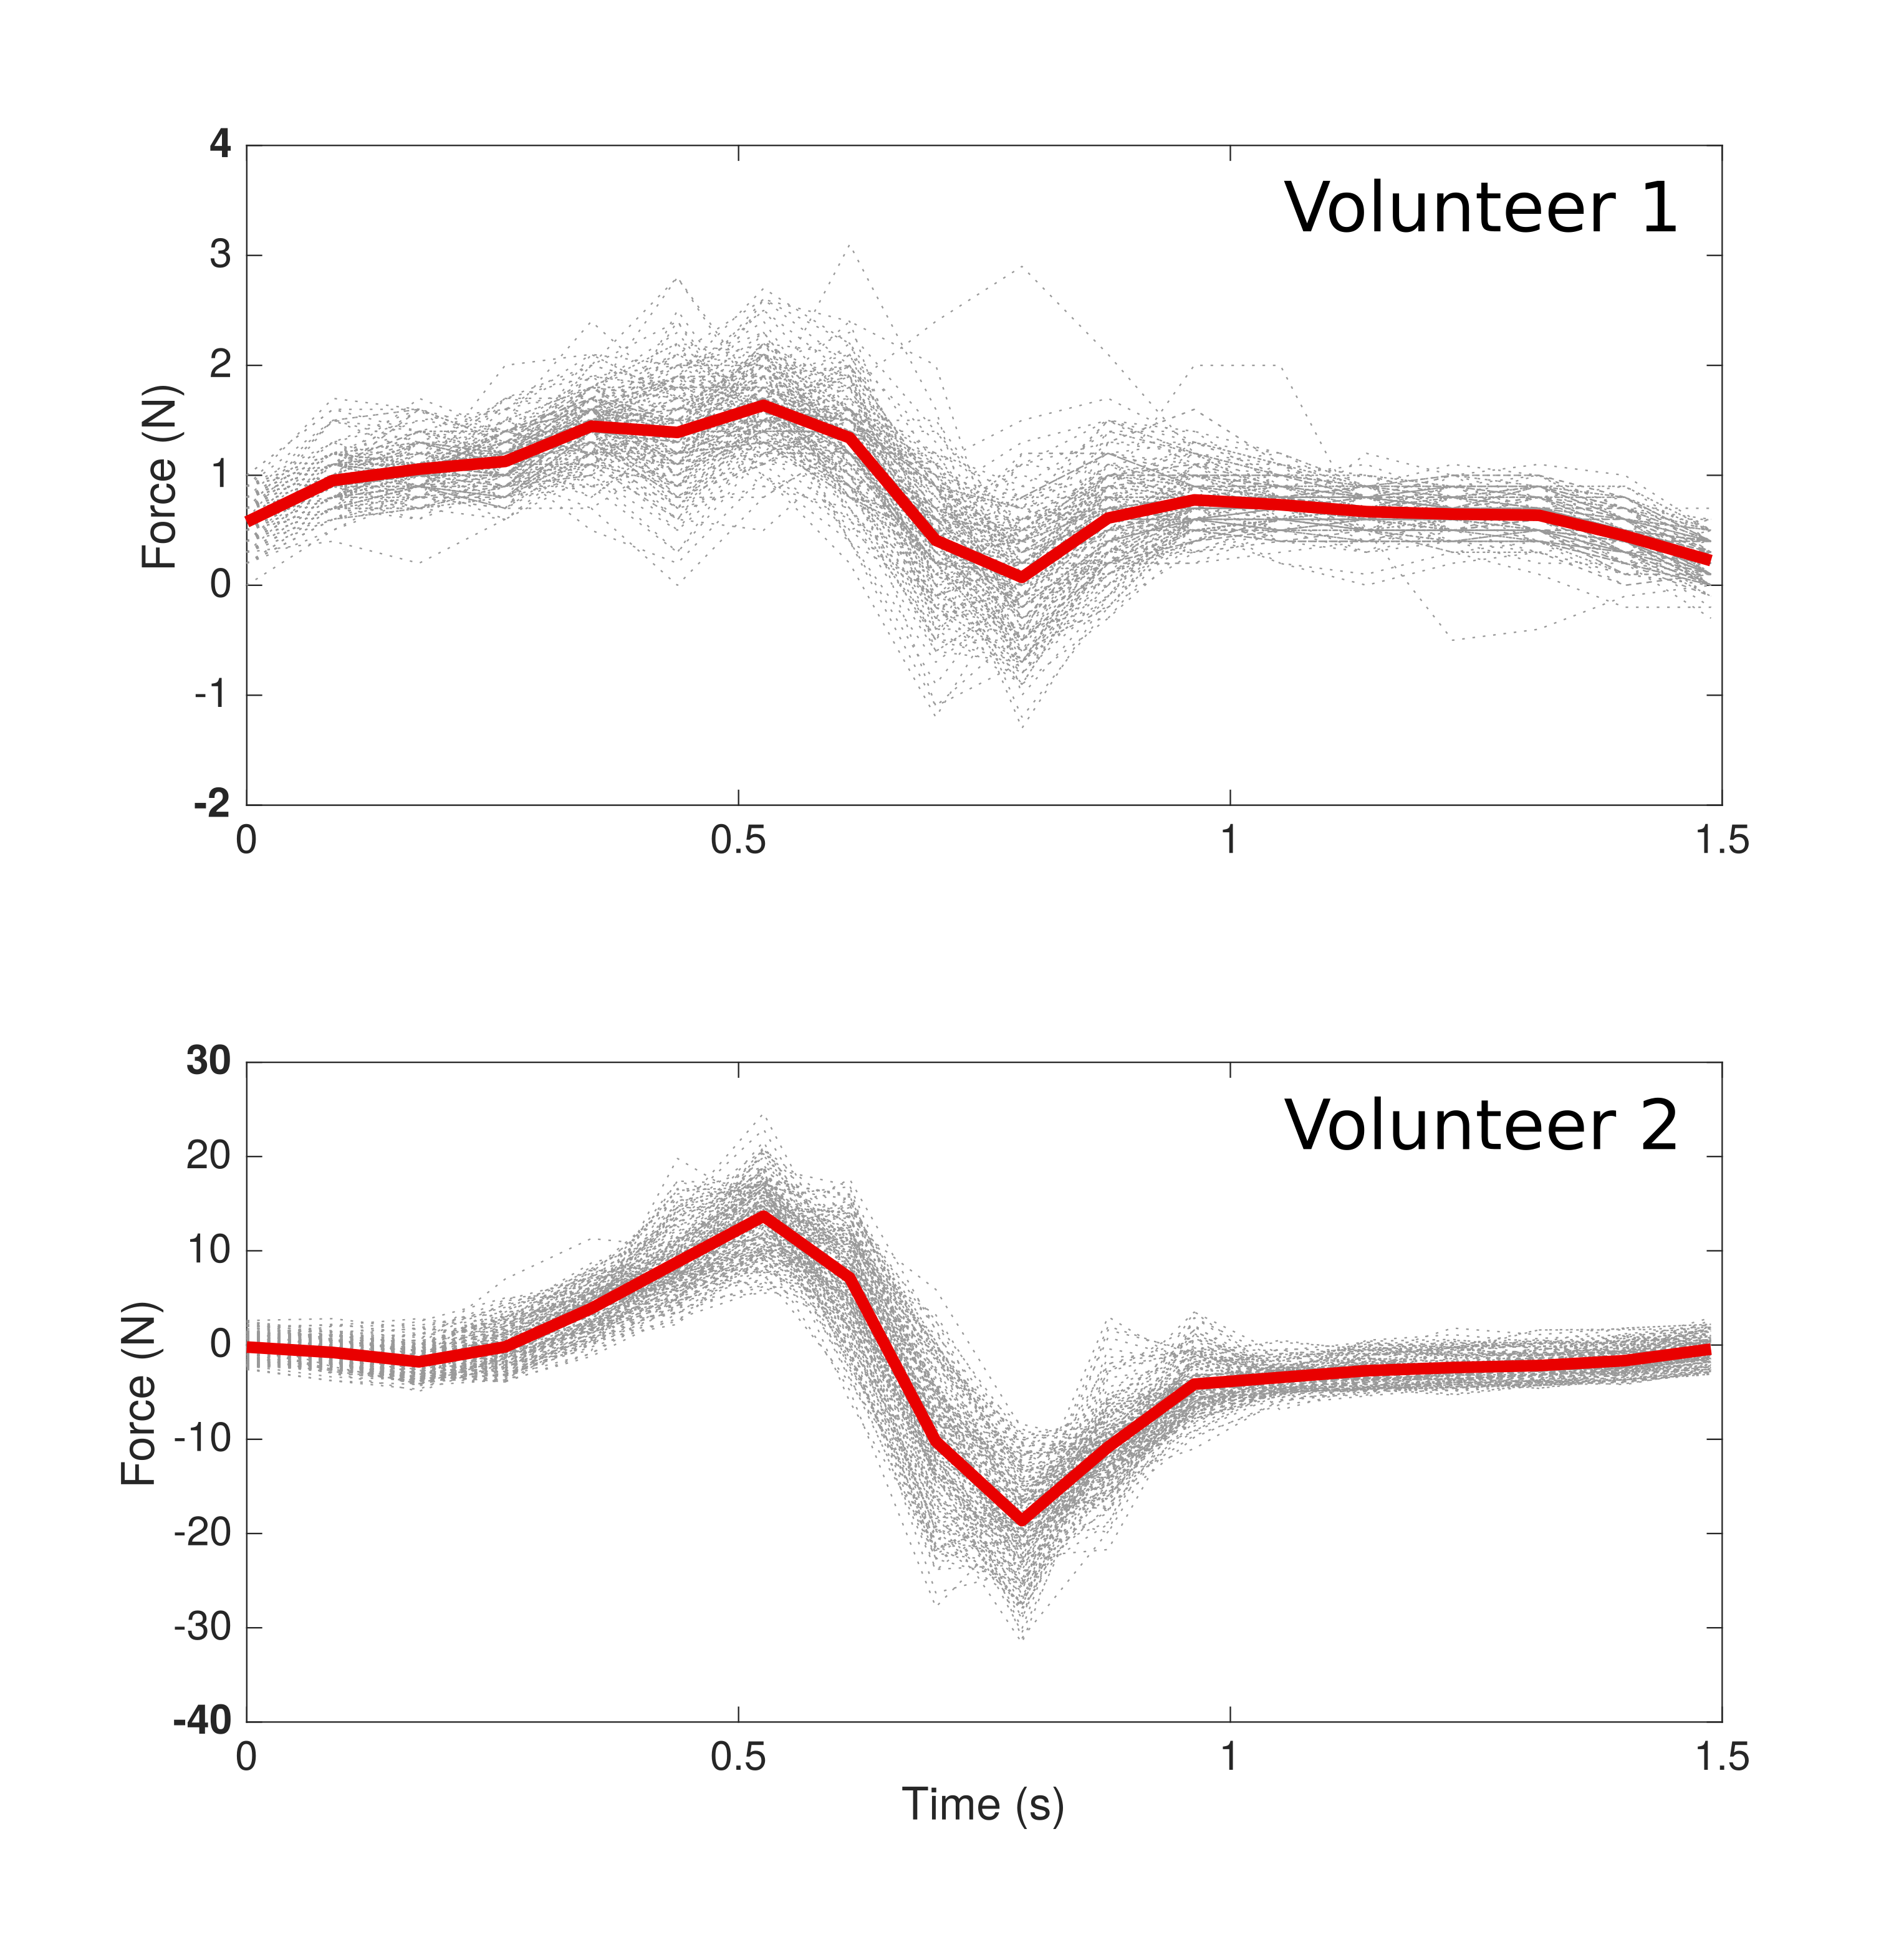
Figure
4: Force output during one reconstructed stimulation cycle
for volunteer 1 (NMES at 11 mA) & volunteer 2 (NMES at 17 mA).
In both cases, the arm was positioned in 60° elbow flexion. The mean
waveform during the whole acquisition is overlayed in red, while the
single output during each cycle is depicted in gray.
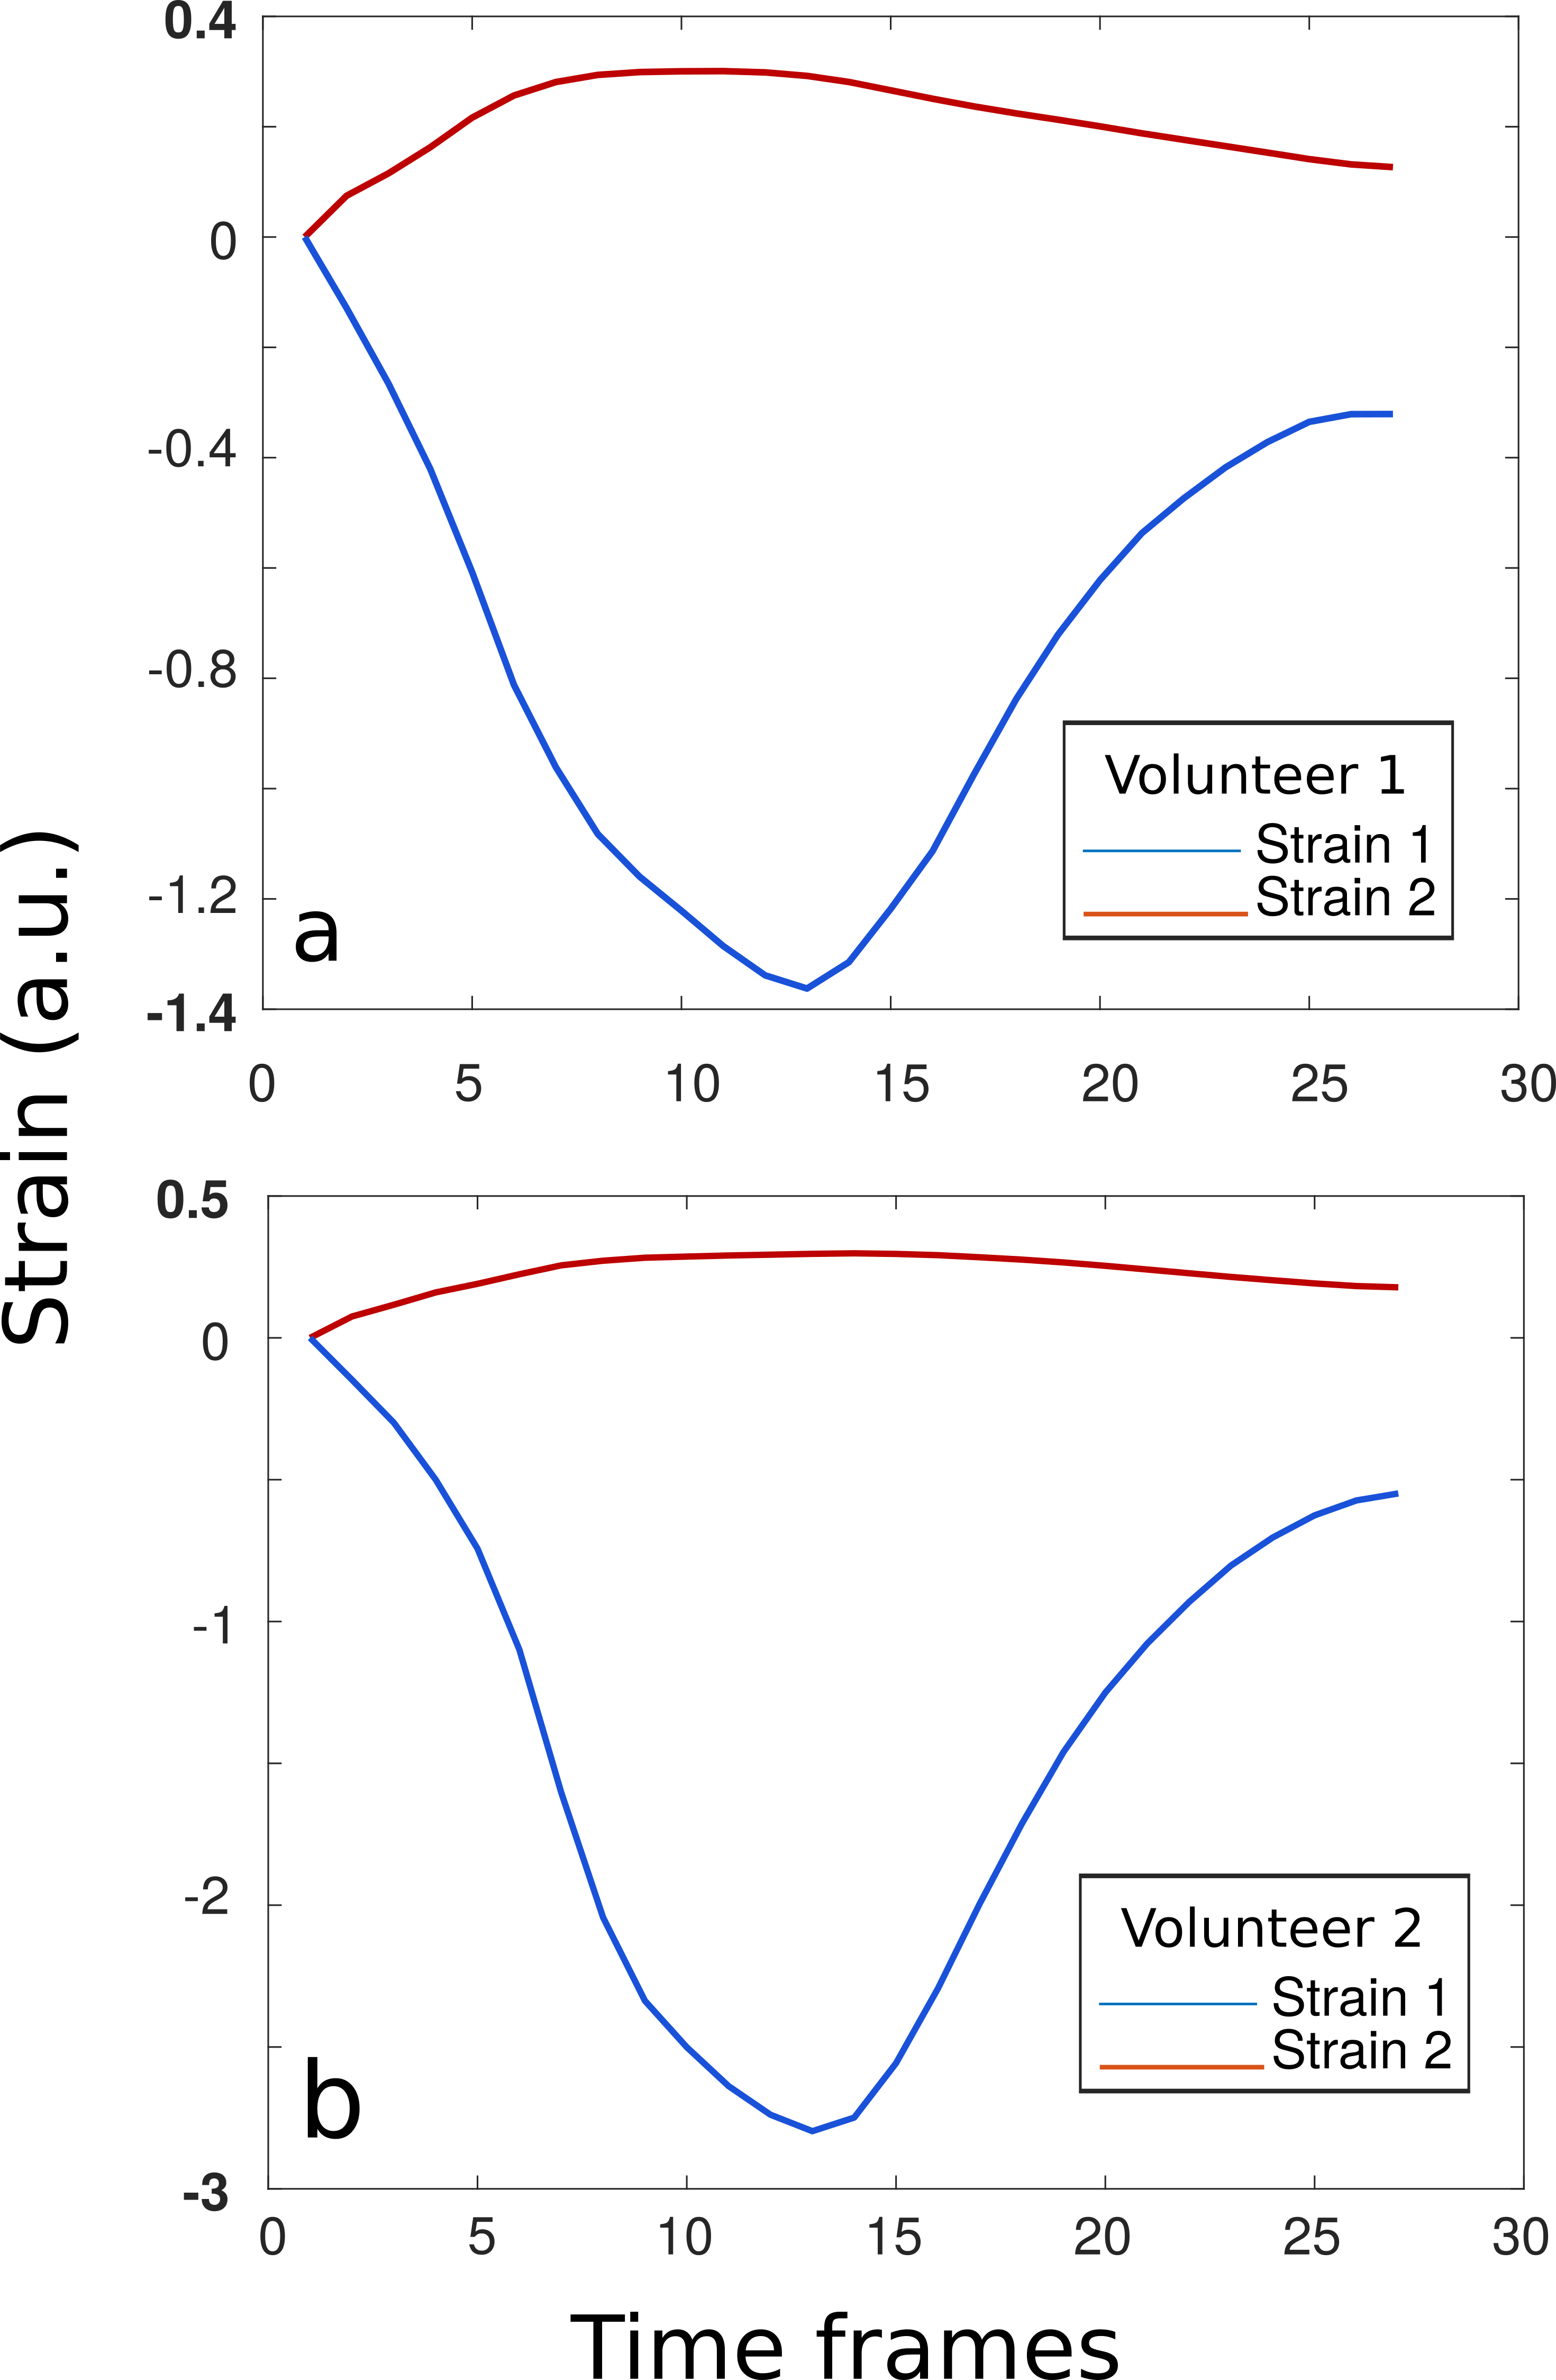
Figure
5.
Strain graphs
for volunteer 1
(stimulation current
11mA) &
volunteer 2 (stimulation
current 17mA). The
first (blue-tensile
strain)
and second (red-compressive)
principal strain components are presented (a.u.:
abstract units). The mean values were calculated for a region of
interest covering the entire biceps. In both cases, the arm was
positioned in a 60° angle.