2698
Evaluating Longitudinal Muscle Degeneration in ALS Patients using MR Cytography
Sudarshan Ragunathan1, Laura C Bell1, Ashley M Stokes1, Natenael Semmineh1, Jessie Duncan2, Nicole Turcotte2, Shafeeq Ladha2, and Chad C Quarles1
1Neuroimaging Research, Barrow Neurological Institute, Phoenix, AZ, United States, 2Gregory W. Fulton ALS and Neuromuscular Center, Barrow Neurological Institute, Phoenix, AZ, United States
1Neuroimaging Research, Barrow Neurological Institute, Phoenix, AZ, United States, 2Gregory W. Fulton ALS and Neuromuscular Center, Barrow Neurological Institute, Phoenix, AZ, United States
Synopsis
Amyotrophic lateral sclerosis (ALS) is a neurodegenerative disease characterized by loss of upper and lower motor neurons (UMN and LMN), resulting in muscle atrophy and eventual death. Clinical indicators such as ALSFRS-R scores can be confounded by inter-rater variability and low sensitivity. MR Cytography based TRATE has been shown to identify changes to myofiber microstructure. This work aims to demonstrate that TRATE is a more sensitive and consistent metric to evaluate longitudinal muscle degeneration in ALS patients than existing clinical indicators such as ALSFRS-R scores.
INTRODUCTION
The recent growth of the ALS therapeutic pipeline has galvanized efforts to develop new biomarkers of disease progression. While there are imaging biomarkers for upper motor neuron (UMN) characterization, there are few that assess lower motor neuron (LMN) function. Since the hallmark of LMN degeneration is muscle denervation and atrophy, a muscle-based imaging technique could be a useful biomarker. Through pilot data, we have demonstrated the potential of MR Cytography (MRC)1 in identifying muscle cytoarchitecture changes among ALS patient population2. In this work, we highlight the performance of TRATE when compared to existing muscle imaging metrics, and also demonstrate that MRC based approach is more sensitive to monitoring muscle changes when compared to ALS Functional Rating Scale – Revised (ALSFRS-R) and Hand Held Dynamometry (HHD) over two visits separated by a period of 6 months.METHODS
In this IRB-approved study, 23 subjects (12 ALS patients and 11 healthy controls) were scanned at 3T (Philips, Netherlands). Data for MRC analysis was obtained using a dynamic dual echo DCE-MRI pulse sequence (TE1/TE2 : 1.1/20 ms; TR : 21 ms; temporal res : 5.1 s). In addition to MRC data, fat fraction (FF) information was obtained using a 3 point m-Dixon protocol. Multi-echo GRE with ETL = 5 was used to estimate pre and post T2* changes. T1 mapping was performed using a multiple flip angle approach (10 values of flip angles with increments of 2o were used). Four of the 12 ALS patients underwent a second scan after a period of 6 months to record longitudinal changes. ALSFRS-R scores and muscle strength test measures were used as clinical indicators in this study.Muscle groups from anterior (Tibialis Anterior, and Peroneus Longus), and posterior (Tibialis Posterior, Lateral Gatrocnemius, and Medial Gastrocnemius) regions of the calf were identified for postprocessing and analysis. Muscle ROIs were drawn manually on a slice by slice basis by the same operator. Transverse relaxivity at tracer equilibrium (TRATE)1 was computed as the ratio of at contrast agent (CA) equilibrium where, Ct is the CA (Gadavist) concentration. T2* maps from pre and post Gd data were obtained by fitting the multi-echo data to a decaying exponential. TRATE estimates in the 5 muscle ROIs were compared to Fat Fraction, T2 values and T2* changes between ALS patients and healthy controls; longitudinal TRATE estimates were also compared to ALSFRS-R (total), and ALSFRS-R (lower limb) scores among the ALS population.
RESULTS
Single slice (axial) computed TRATE maps are shown in Fig. 1(B). The heterogeneity among TRATE values is evident from these maps in the ALS patient as well as the healthy control. TRATE was consistently lower in ALS affected muscle than in healthy muscle in the 5 ROIs (Δmean ~31%). Among the different muscle ROIs, TRATE values in the anterior tibial muscle and lateral gastrocnemius muscle of an ALS patient were markedly lower between visit 1 and visit 2 (63% drop in TA; 32% drop in LG between visit 1 and 2), as shown in Fig.2. Fat Fraction was utilized as a measure of fatty infiltration (Fig. 1C). The average increase in fat fraction across the ALS patient population was estimated at 8%. TRATE estimates were compared to the ALSFRS-R overall (max score: 48) and lower limb scores (max score: 12), as depicted in Fig.3. Two of the 4 patients did not register a change in both ALSFRS-R scores between visits, but their corresponding TRATE estimates reduced by 13.2% and 17.3% respectively.DISCUSSION
With increased enthusiasm in biomarker development to study ALS disease progression, it is well established that in ALS patients, myofiber diameter and density both decrease with disease progression, thereby reducing TRATE as shown previously in select ALS muscle groups2. While T2 signal values and fat fraction maps have been utilized in neuromuscular disease studies3,4, changes in TRATE were observed to be more consistent than changes in fat fraction and voxel based T2 values. MR Cytography’s role as a successful imaging biomarker is contingent on its sensitivity to muscle degeneration over time. The presentation and progression of ALS is heterogeneous across muscle groups, patients and over time, consistent with the varied TRATE estimates observed here. Going forward, it will be important to characterize TRATE in diverse groups of healthy controls as it could be influenced by multiple factors, including age, state of exercise, and prior injuries to the area of interest. A key finding of this study is that TRATE measures were observed to decrease between visits even when there appeared to be no change to the overall and lower limb ALSFRS-R scores. This supports the premise that while ALSFRS-R scores can be subjective and be affected by inter-operator variability between visits, TRATE could provide a more quantitative and consistent assessment of ALS affected muscle health.CONCLUSION
Having shown the potential of MR Cytography as a means to identify diseased muscle cytoarchitecture changes, TRATE was shown to characterize longitudinal changes in anterior and posterior regions of ALS affected calf muscles. Future work includes incorporating MRC based bulbar imaging and neuroimaging to provide a wholistic understanding of ALS disease progression and establishing the repeatability of these biomarkers.Acknowledgements
This work was supported by the FLINN Foundation award #2094, and in part by Philips Healthcare.References
- Semmineh, N. B., Xu, J. , Skinner, J. T., Xie, J. , Li, H. , Ayers, G. and Quarles, C. C. (2015), Assessing tumor cytoarchitecture using multiecho DSC‐MRI derived measures of the transverse relaxivity at tracer equilibrium (TRATE). Magn. Reson. Med., 74: 772-784. doi:10.1002/mrm.25435
- Ragunathan S, Bell LC, Stokes AM, et al. Evaluation of Muscle Degeneration in Amyotrophic Lateral Sclerosis Patients Using MR Cytography. Proc. Intl. Soc. Mag. Reson. Med. 27 (2019).
- Jenkins TM, Alix JJP, David C, et al. Imaging muscle as a potential biomarker of denervation in motor neuron disease. Journal of Neurology, Neurosurgery & Psychiatry 2018;89:248-255.
- Klickovic U, Zampedri L, Sinclair CDJ, et al. Skeletal muscle MRI differentiates SBMA and ALS and correlates with disease severity. Neurology Aug 2019, 93 (9) e895-e907.
Figures
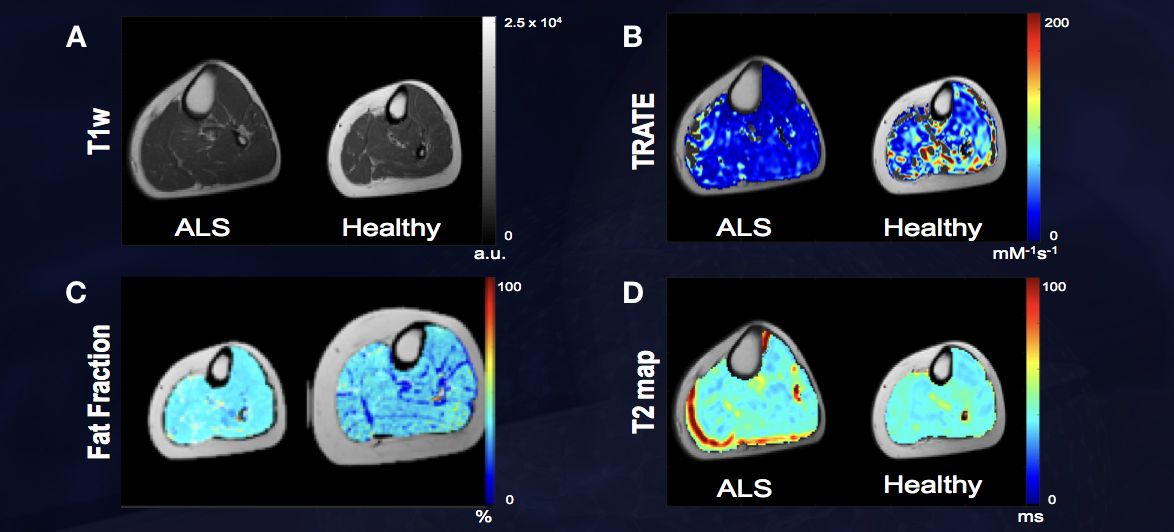
Figure 1: TRATE, Fat Fraction and T2 maps were compared
between the ALS and healthy control populations as shown in Figs. 1B, 1C, and
1D respectively. TRATE was observed to be lower in ALS affected muscle. While
in some datasets obtained, fatty infiltration in ALS affected muscle was
observed, the dataset shown above is an example observation of similar fat
content in healthy and ALS affected muscle. In accordance with existing muscle
imaging studies, the T2 map showed sporadic elevated regions in ALS
muscle, but these changes were minor when compared to changes in TRATE measures.
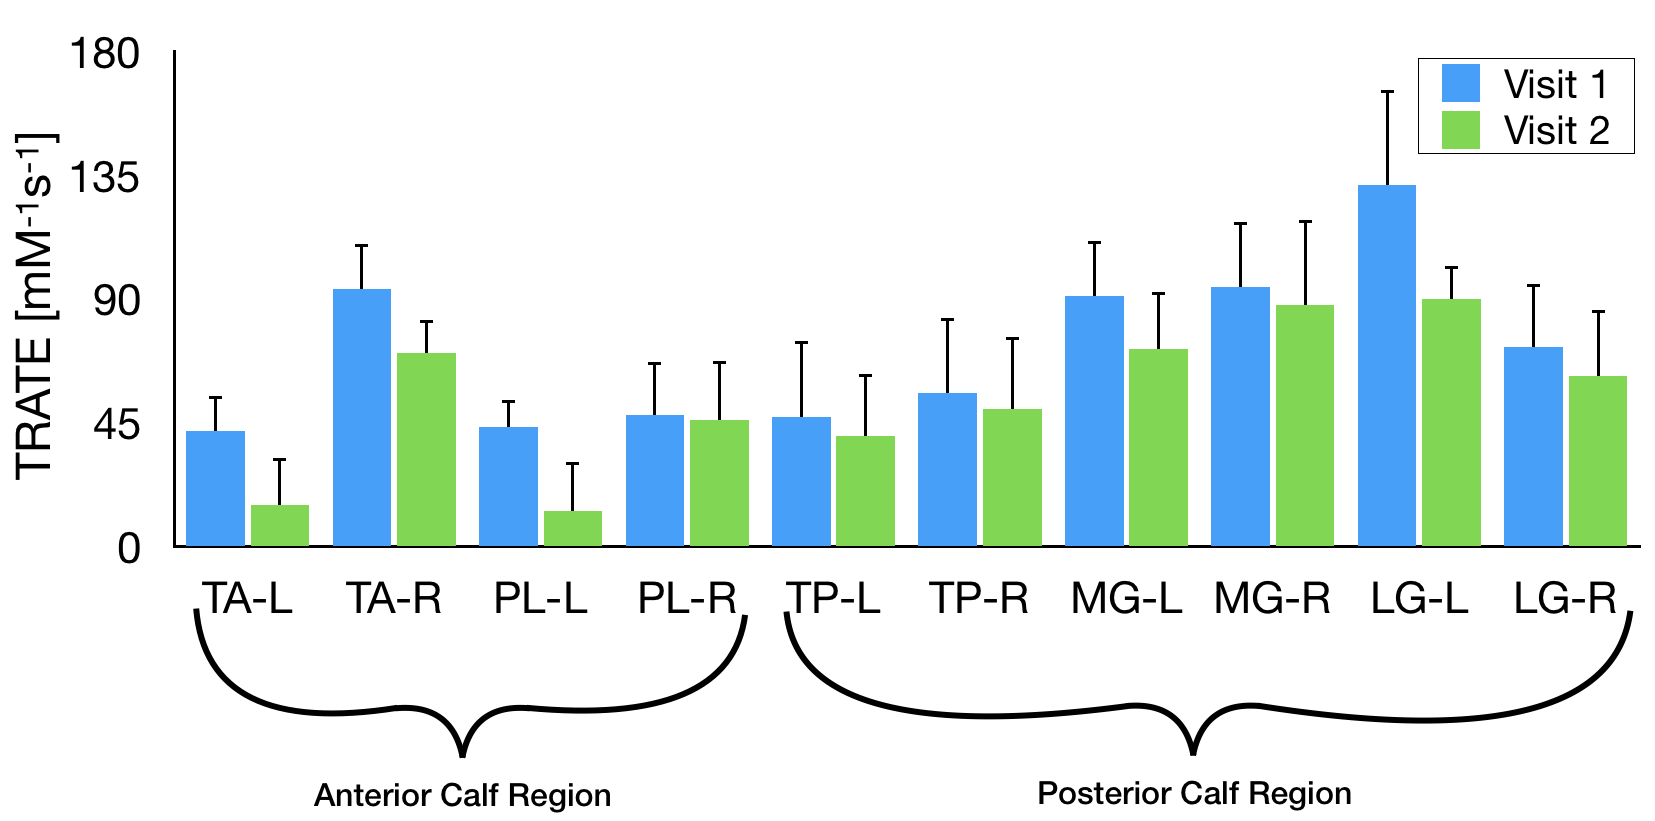
Figure 2: Mean TRATE values in 2 anterior calf regions
(Tibialis Anterior – TA, and Peroneus Longus – PL), and 3 posterior calf
regions (Tibialis Posterior – TP, Medial Gastrocnemius – MG, and Lateral
Gastrocnemius – LG) are shown. Note: The ‘L’ and ‘R’ represent left and right
calf respectively.
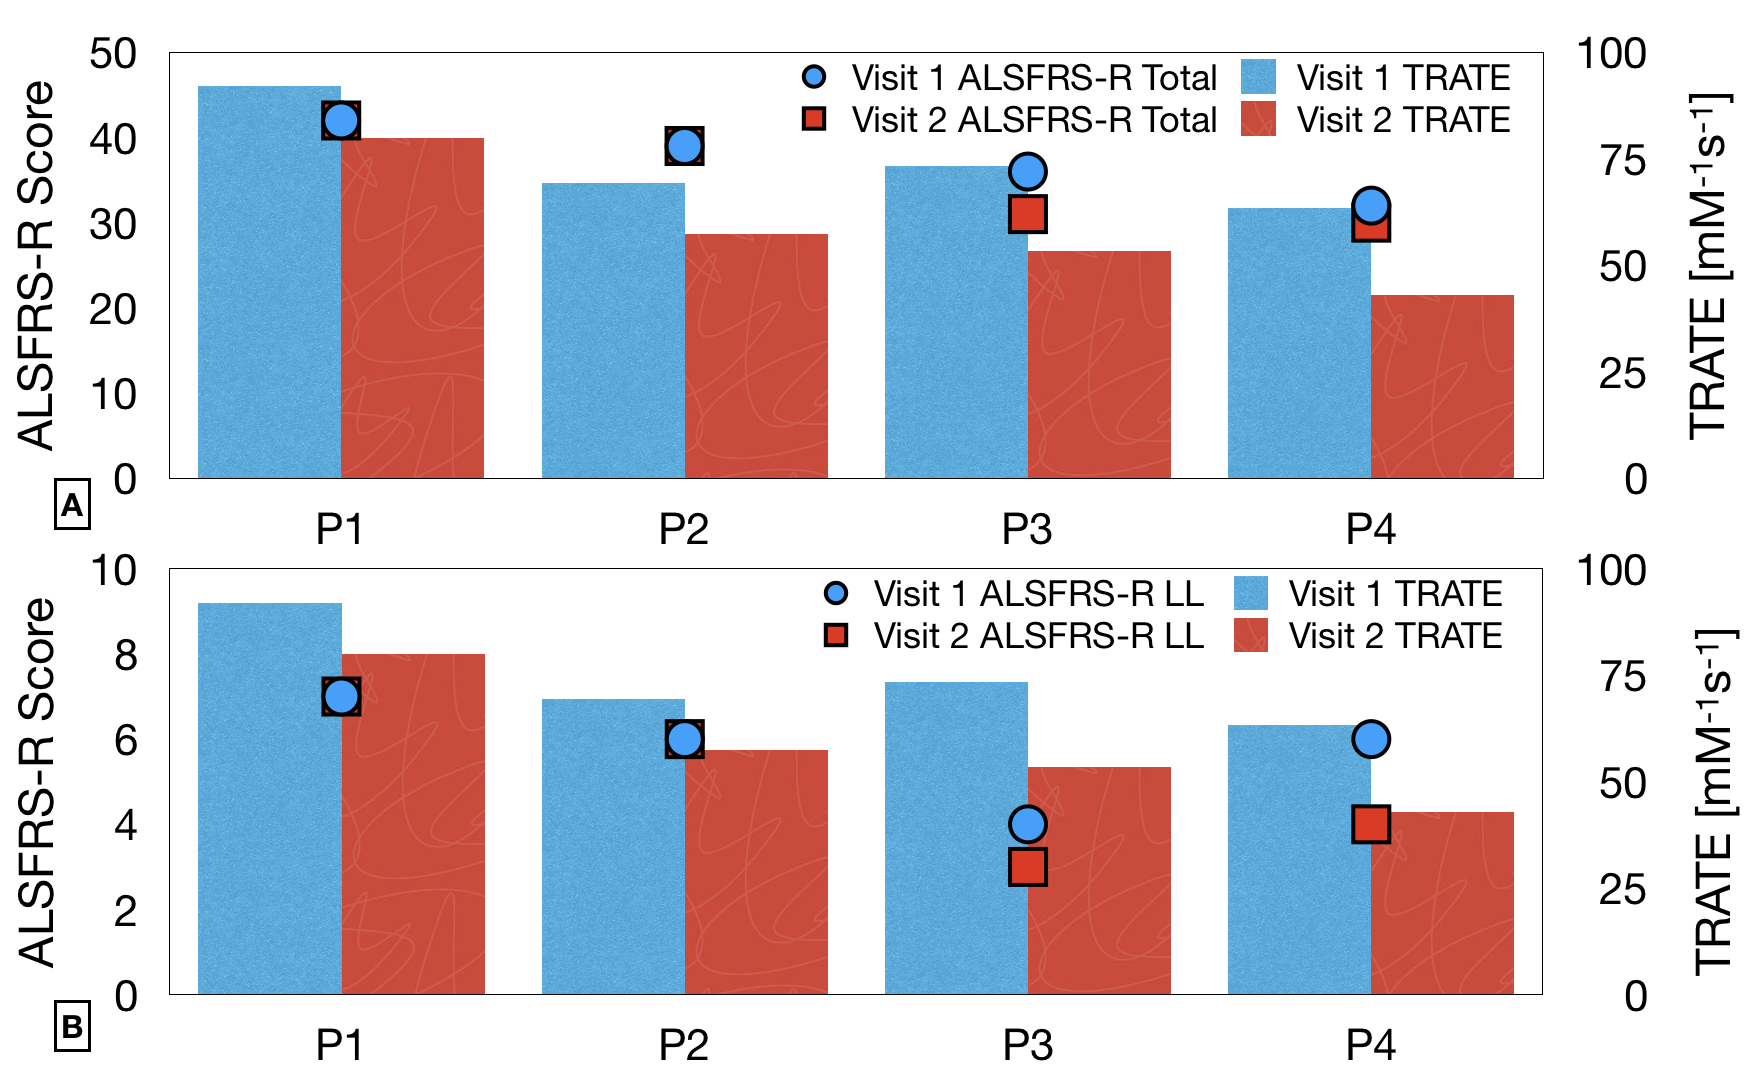
Figure 3: In 4 patient datasets with a recurring visit at
6 months, TRATE values obtained at the two timepoints are compared with the
ALSFRS-R scores (overall) in Fig. 3A, and the ALSFRS-R scores applicable for
lower limb evaluation in Fig. 3B.