2697
Comparison of simulated and experimental stimulated echo diffusion at varying diffusion times in skeletal muscle1Orthopaedic Surgery, University of California San Diego, La Jolla, CA, United States, 2Nanoengineering, University of California San Diego, La Jolla, CA, United States, 3Radiology, University of California San Diego, La Jolla, CA, United States, 4Bioengineering, University of California San Diego, La Jolla, CA, United States
Synopsis
Diffusion tensor imaging provides insight into the underlying tissue microstructure. Here, we compare simulated DTI data to experimentally acquired data in skeletal muscle using stimulated echo DTI at multiple diffusion encoding times. After adjusting for the difference in simulated versus measured apparent diffusion coefficient, there was relative agreement of mean diffusivity and radial diffusivity between the measured and simulated data. Fractional anisotropy was overestimated experimentally, likely due to limited image SNR.
Introduction
Diffusion tensor imaging (DTI) is an MRI technique that has been shown to be sensitive to muscle microstructure,1 which is directly related to muscle function. Due to the relatively short T2 relaxation time of muscle,2 spin echo DTI has limited maximum diffusion times which can be probed, decreasing the number of water molecules capable of interacting with the sarcolemma. Stimulated echo DTI, on the other hand, allows acquisition of diffusion data at longer diffusion times without necessitating prolongation of echo time.3-6 Previously, in silico simulation was used to describe a relationship between muscle microstructure and diffusion time using a stimulated echo DTI sequence in a noiseless environment,7 but these relationships have not been validated experimentally. Therefore, the goal of this study was to directly compare the in silico time-dependent diffusion results to experimental stimulated echo DTI data of skeletal muscle acquired in situ.Methods
In silico simulation: Histology was obtained from healthy rat tibialis anterior (TA) muscles. Sections were digitized to create structurally and physiologically relevant models of muscle microstructure. DTI experiments were simulated using the MRI simulation tool DifSim.8 Difsim tracks particle location within a user-defined, arbitrarily complex geometric model, here defined by the muscle microstructure obtained via histology in conjunction with simulated MR pulse sequence events (e.g. RF pulses and applied gradients) to calculate MR signal amplitude and phase. Simulated pulse sequence parameters were: stimulated echo DTI with TE=21.76ms, b=500s/mm2, voxel size=200×200×200μm3, directions=15, diffusion encoding gradient duration (δ)=2ms, diffusion time (∆)=20,30,40,50,90,130,170,250,325,400,500,750ms. Intracellular apparent diffusion coefficient (ADC) was assumed to be 1.8×10⁻³ mm2/s.Experimental data collection: Bilateral hindlimbs were obtained from two uninjured New Zealand White rabbits following sacrifice. Data were collected using a 7T Bruker small animal imaging system. DTI data were collected using a stimulated-echo diffusion-prepared sequence with a multi-shot EPI readout and: TR/TE = 4700/21.74ms, FOV = 48×40mm2, acquisition matrix = 120×62 (5/8th partial Fourier), reconstruction matrix = 120×100, segments = 4, slice thickness = 1 mm, number of slices=5, averages = 4, directions=15, targeted effective b=500s/mm2, δ=2ms, Δ=20,50,90,150,400ms. Each diffusion acquisition lasted 20 min 3s, thus it took 100 min 15 s to acquire all diffusion data.
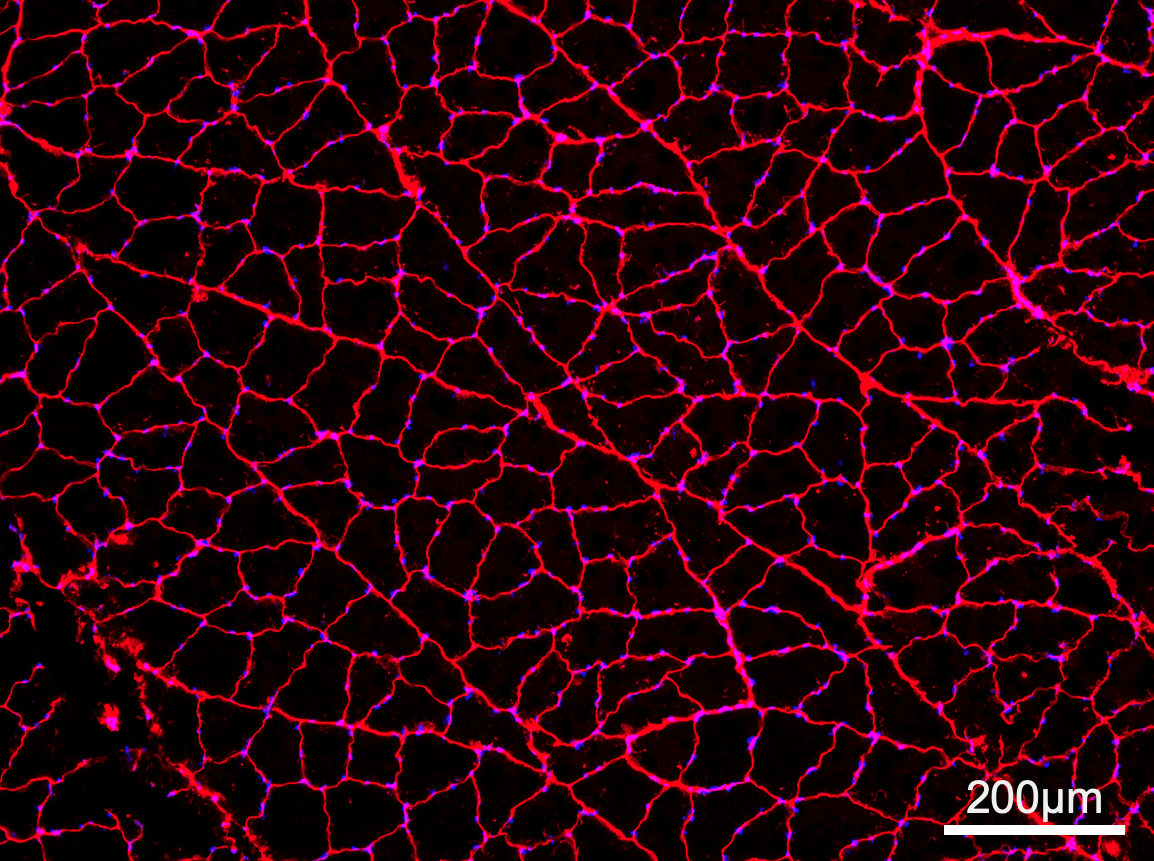
Histology: Following imaging, the tibialis anterior and soleus muscles from one rabbit (two hindlimbs) were dissected, pinned, and snap frozen. Histologic sections were obtained and stained with wheat germ agglutinin (WGA, stains basement membrane) to determine average fiber size (Figure 1).
Image analysis: The diffusion tensor was calculated using AFNI,9 incorporating the full b-matrix data. From the experimental data, mean diffusivity (MD), radial diffusivity (RD), and fractional anisotropy (FA) were averaged in ROIs comprising the TA and soleus muscles for each leg. SNR was computed from both diffusion-weighted and b=0s/mm2 images at each diffusion time.
Results
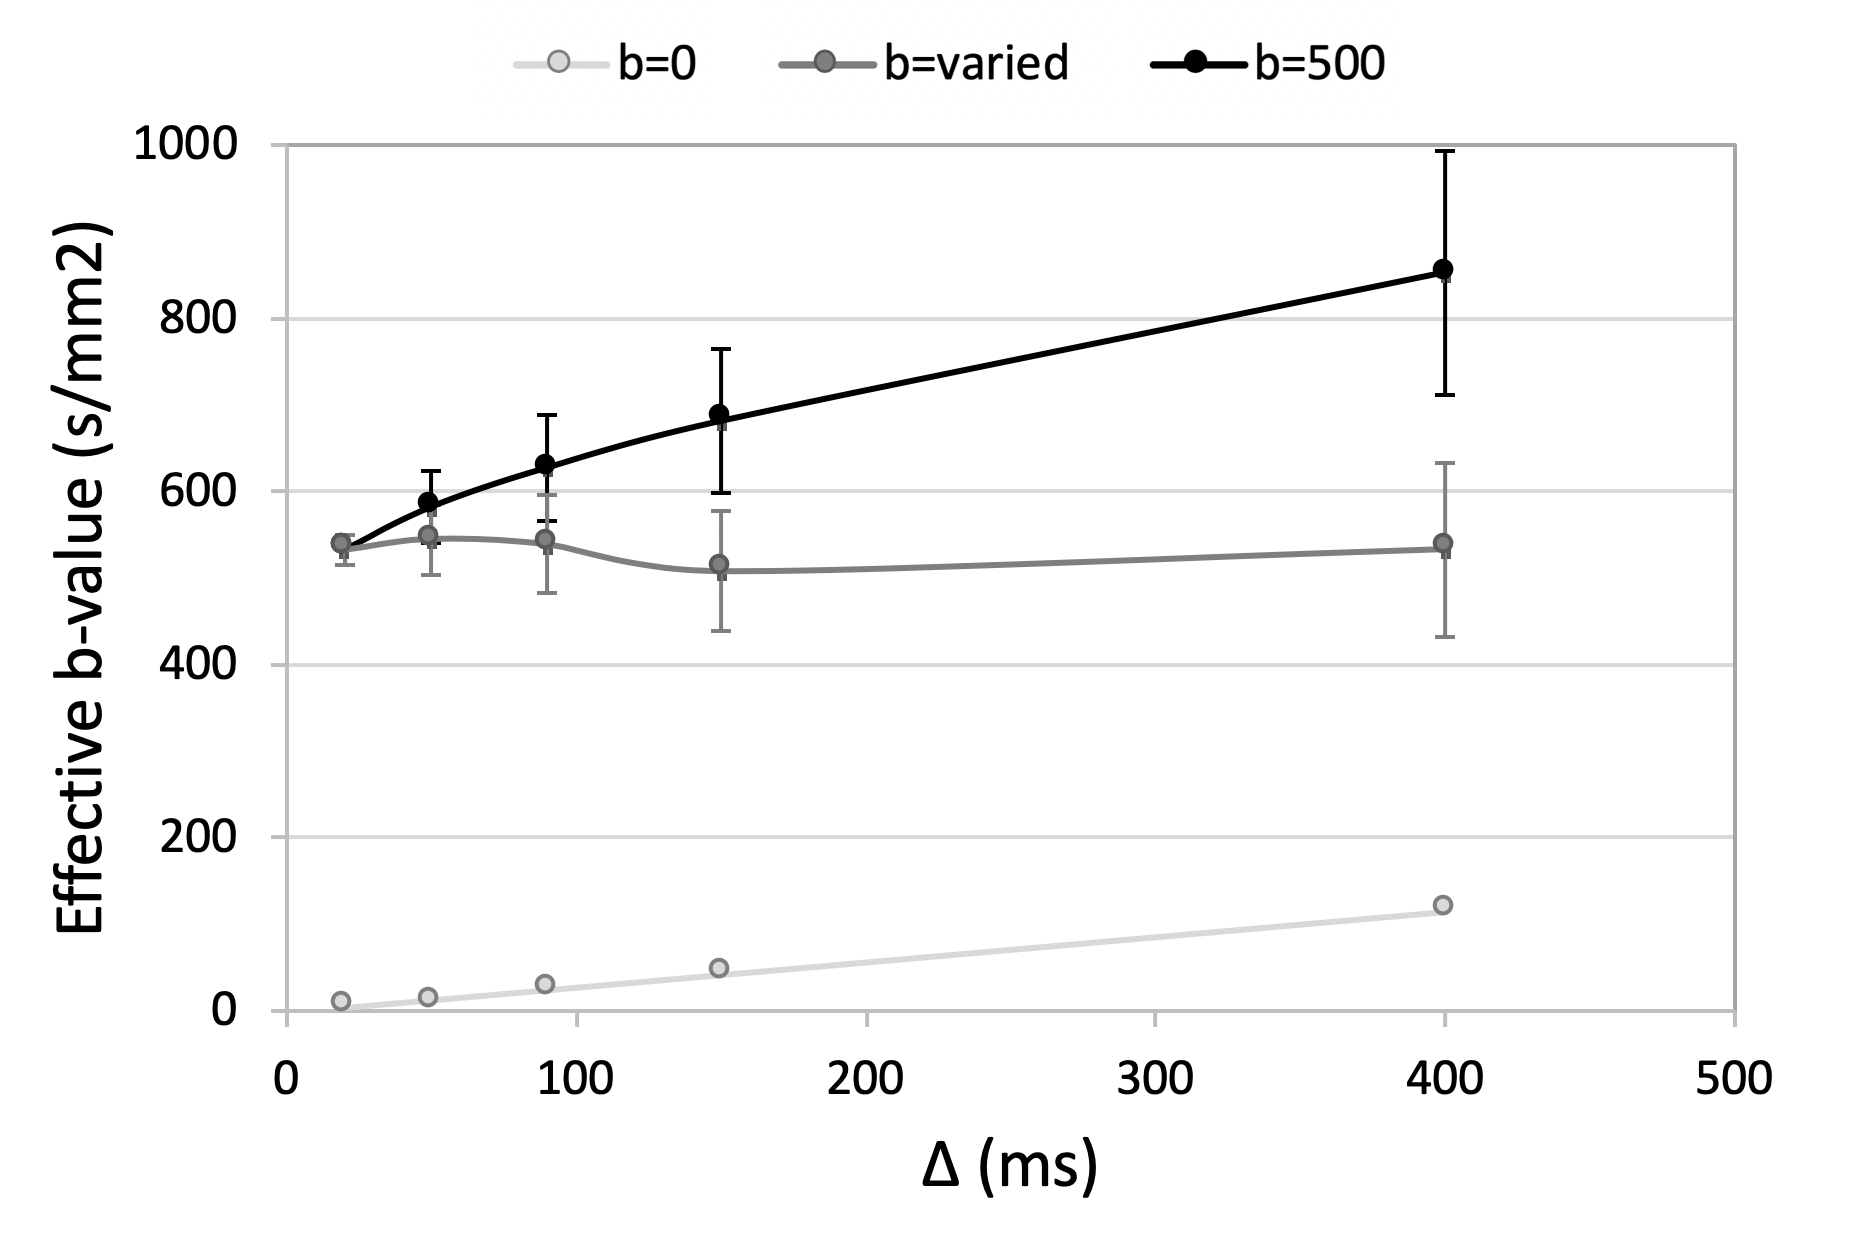
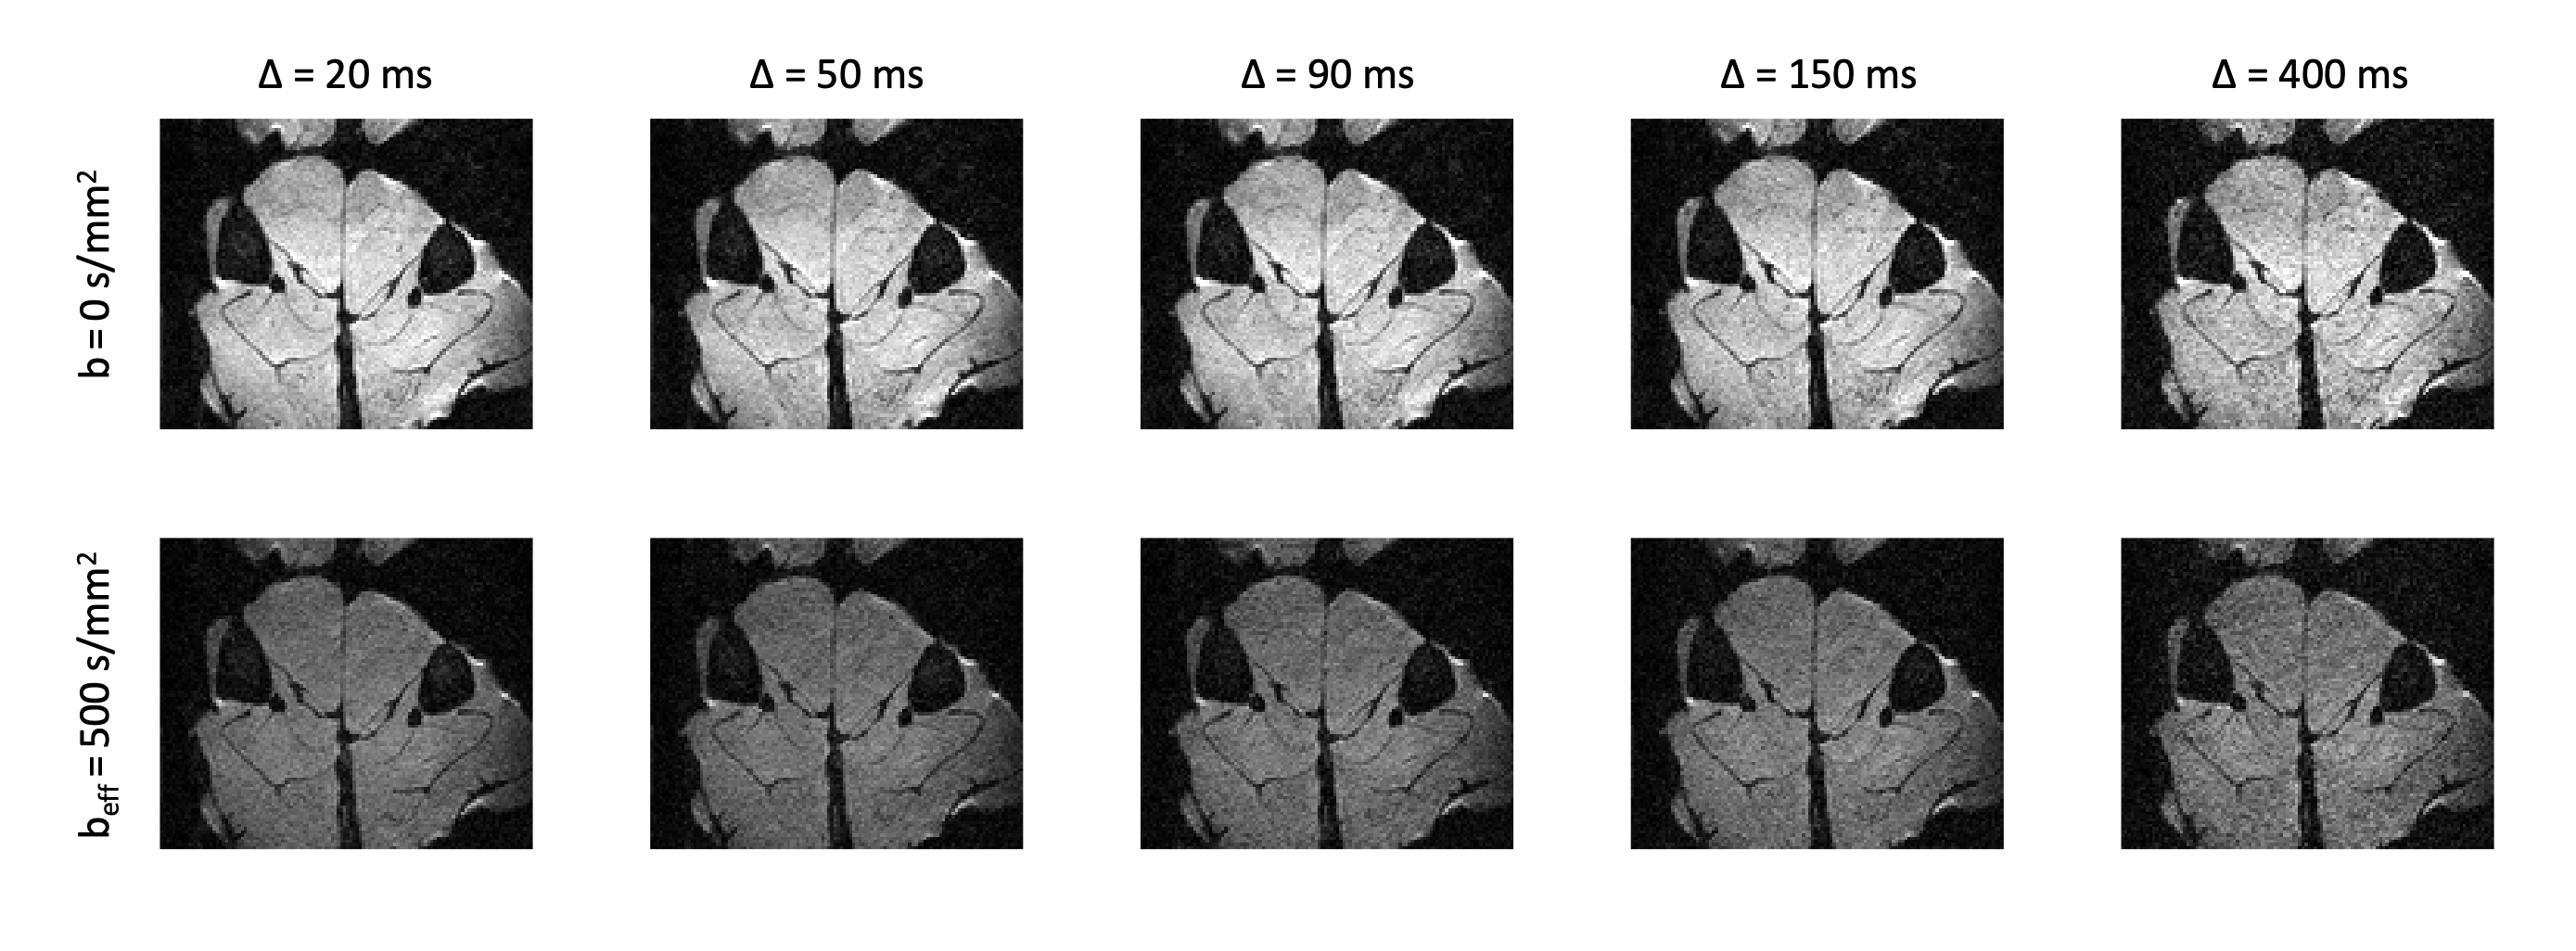
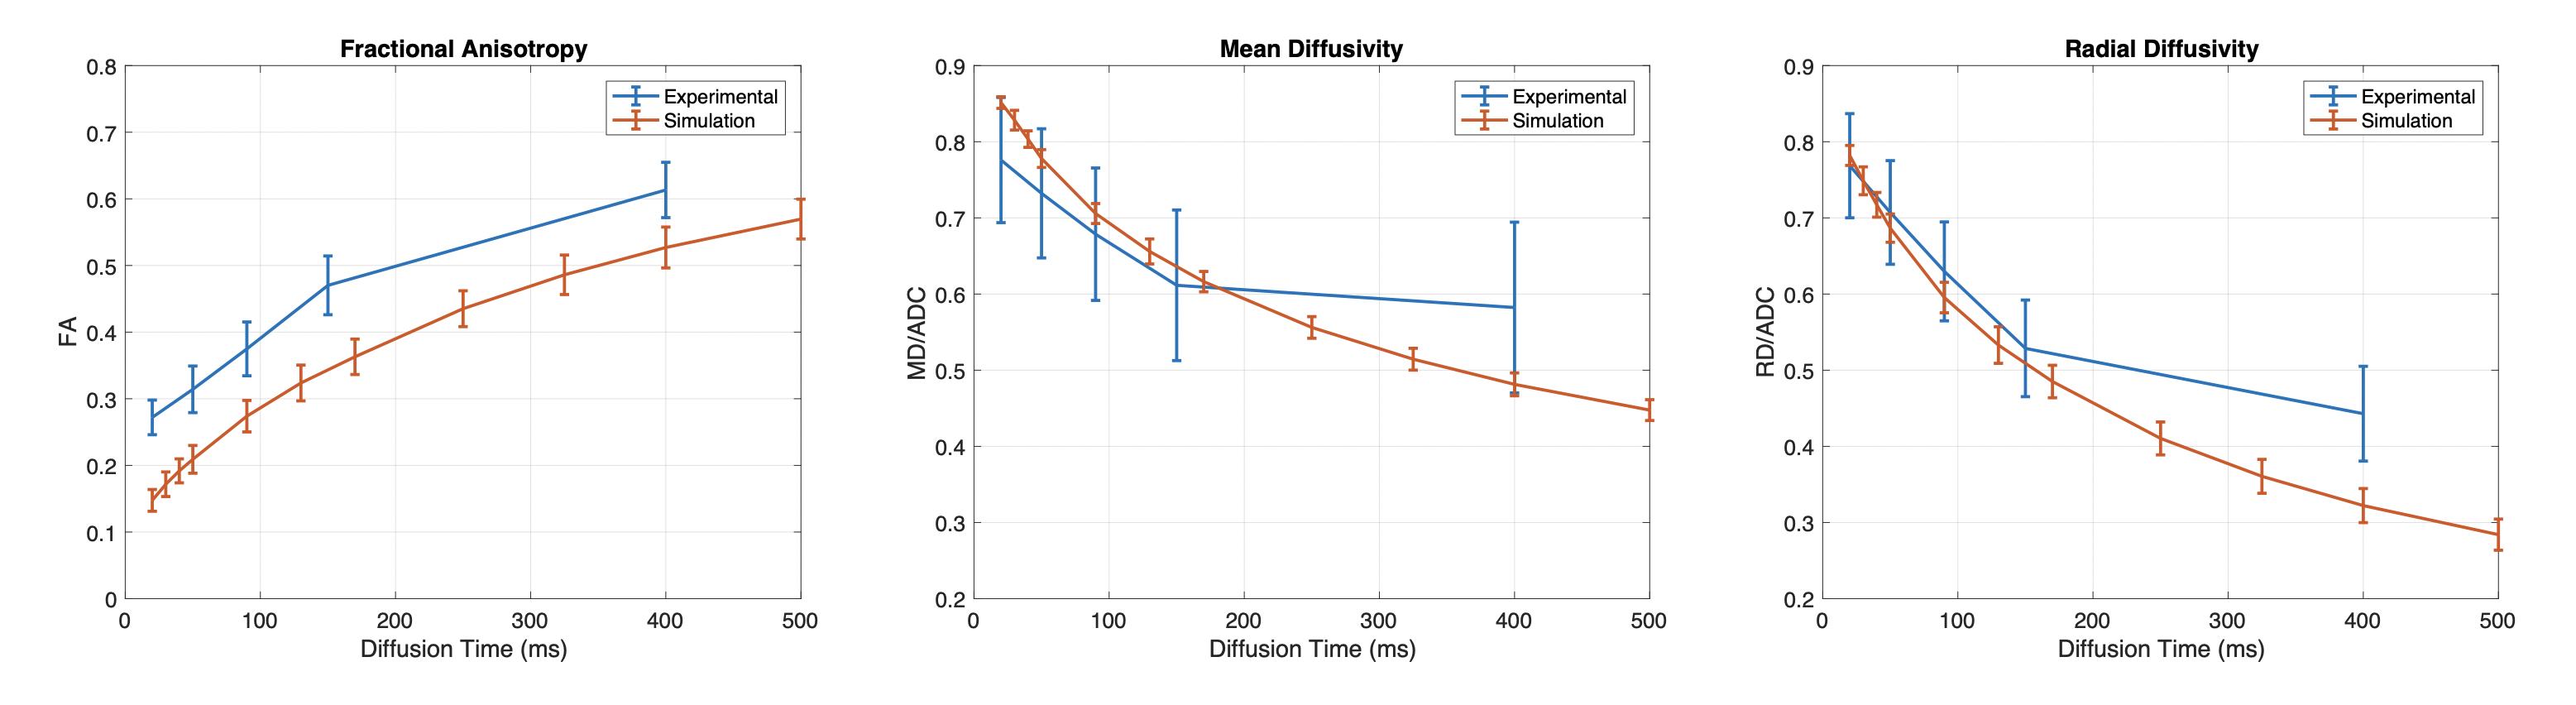
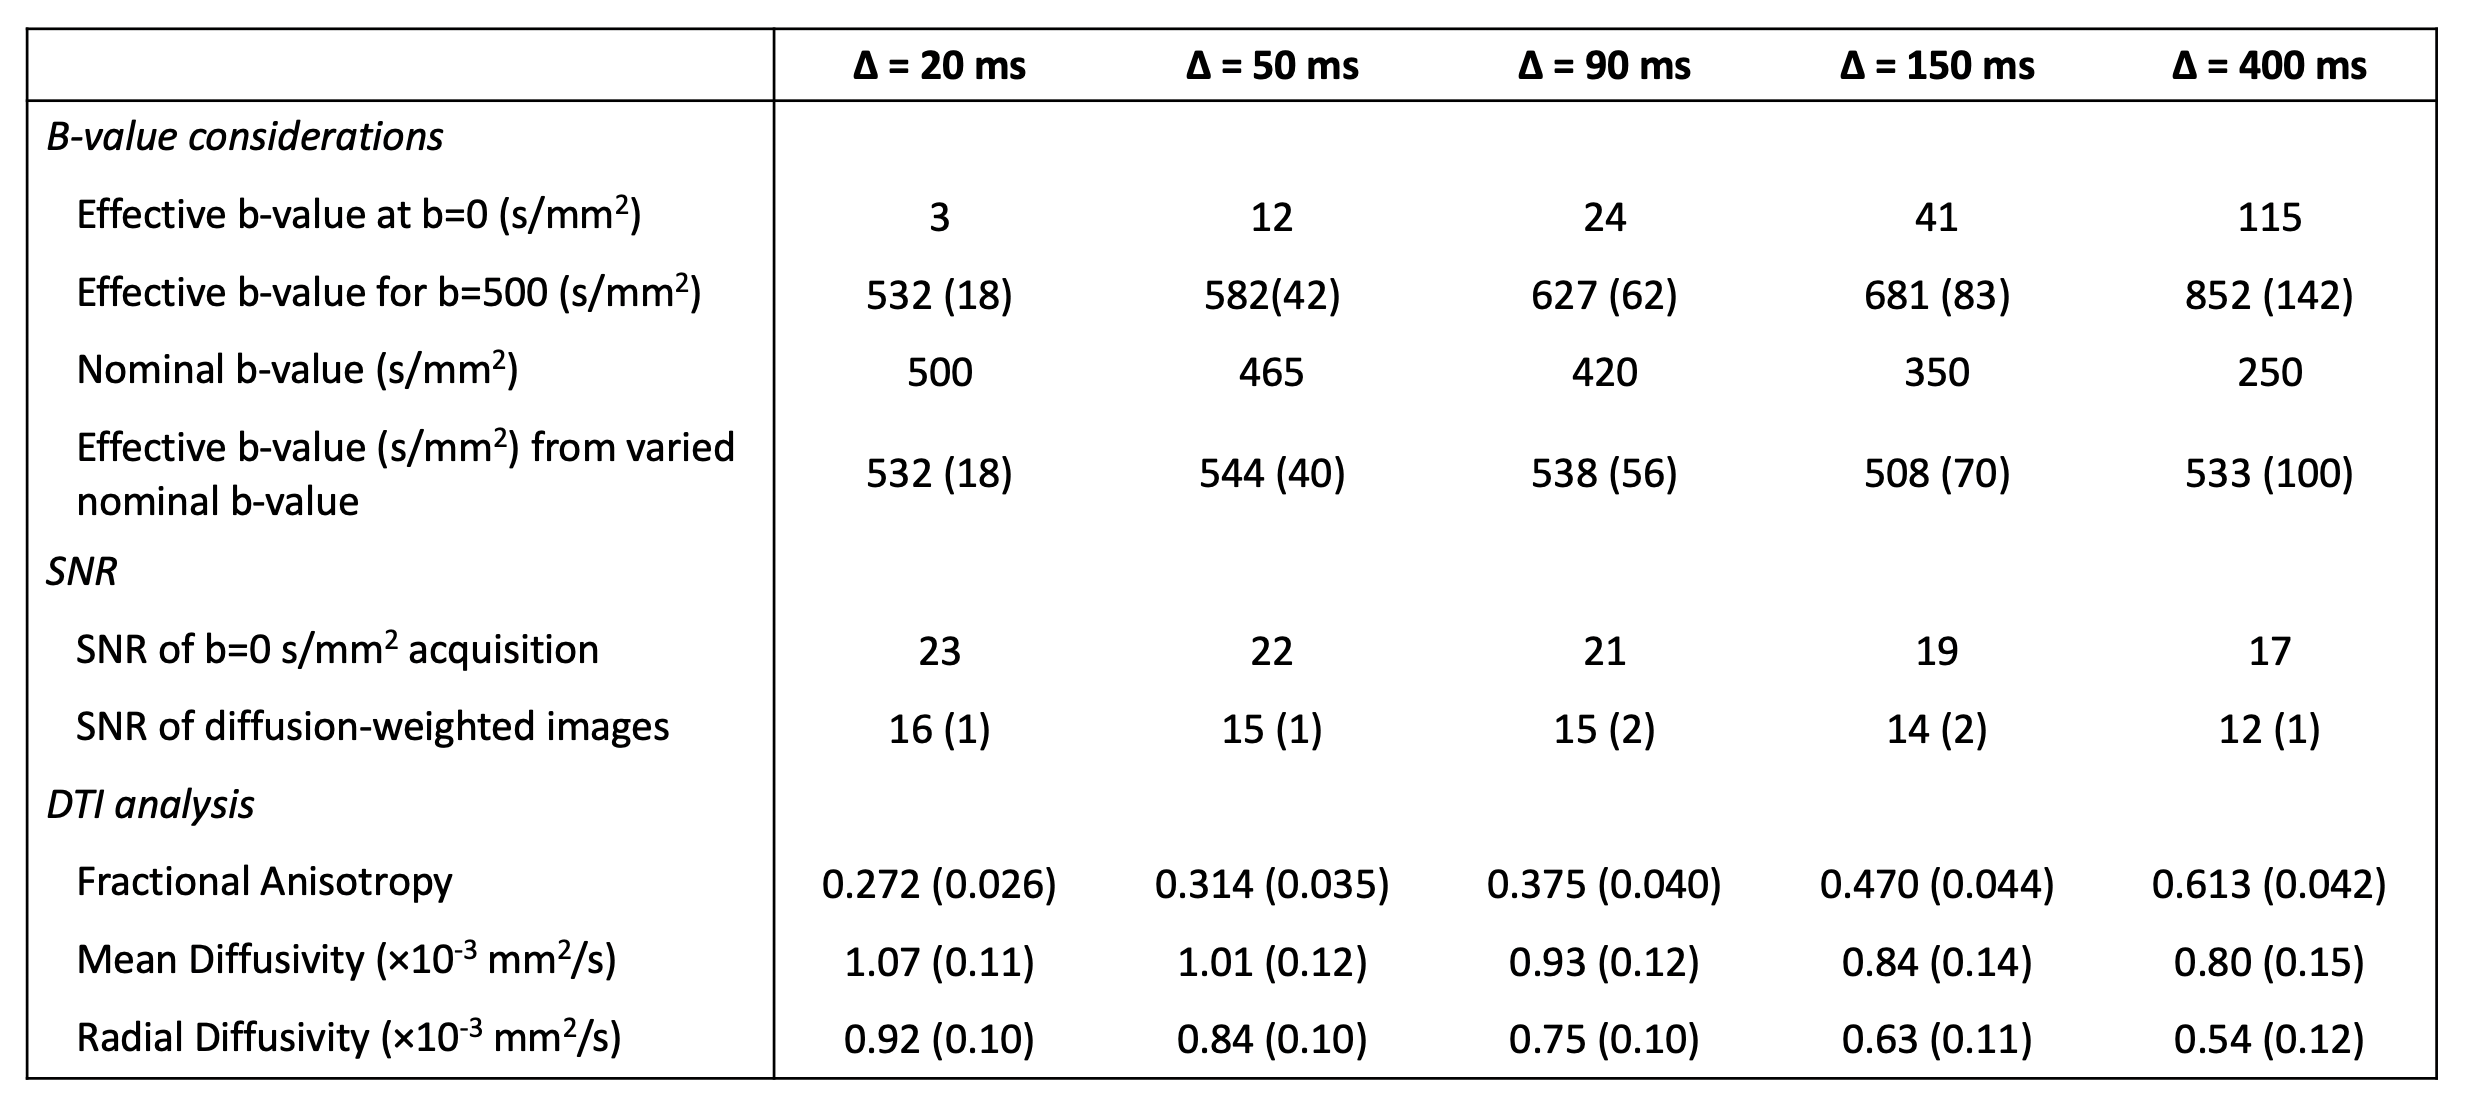
At prolonged diffusion times, the slice-selection gradients increasingly impact the effective b-value, thus the nominal b-value was adjusted such that the effective b-value would remain ~500 s/mm2 (Figure 2). This adjustment allowed for image SNR to remain approximately constant over the range of diffusion times (Figure 3, Table 1). Mean fiber diameter measured on histology was 50±10 μm. ADC was measured as 1.2×10⁻³ mm2/s in experimental data, which was lower than that used for simulation (1.8×10⁻³ mm2/s), thus a direct comparison of measured MD and RD between experimental and simulated data would be offset. To account for this difference, measured and simulated MD and RD were normalized to their respective ADC values, and are plotted in Figure 4. Experimental MD/ADC and RD/ADC decrease as a function of diffusion time, in agreement with simulation data. In general, FA increased over the range of diffusion times in both the simulation and experimental data, however the experimental data showed higher FA, likely due to the limited image SNR.Discussion
Here, we show the ability to measure DTI parameters at multiple diffusion times in skeletal muscle using stimulated echo DTI at 7T. By modifying the nominal b-value, the average effective b-value and image SNR was kept relatively constant over the desired range of diffusion times. We observed relative agreement in the trajectory of MD, RD, and FA to previous in silico findings over the diffusion times evaluated. The offset of FA could be due to the somewhat limited image SNR (~20),10 as in contrast, the simulation environment is noiseless. The reduced ADC in experimental data may be due to thermally-driven differences in the diffusion of water, as the rabbits were sacrificed prior to imaging and thus data were collected at room temperature. There is an expected 2%/°C change in ADC as a function of temperature.11 Though sample temperature was not specifically measured, if we assume body temperature=37°C and room temperature=21°C this would translate to a reduction in ADC by ~30% (~1.26×10⁻³ mm2/s).Conclusion
Overall, this work helps to lay the foundation for future investigation of the capacity for stimulated echo DTI to differentiate fiber sizes in animal models of atrophy and hypertrophy (e.g. synergist ablation). With appropriate validation, stimulated echo DTI, yielding quantitative, volumetric, and non-invasive information, may serve as a biomarker of disease progression and therapeutic response in musculoskeletal injuries and myopathies.Acknowledgements
NIH grant R01 AR070830References
1. Oudeman J, Nederveen AJ, Strijkers GJ, Maas M, Luijten PR, Froeling M. Techniques and applications of skeletal muscle diffusion tensor imaging: A review. JMRI. 2016;43:773-788.
2. Jordan CD, Saranathan M, Bangerter NK, Hargreaves BA, Gold GE. Musculoskeletal MRI at 3.0T and 7.0T: A comparison of relaxation times and image contrast. Eur J Radiol. 2013;82:734-739.
3. Steidle G, Schick F. Echoplanar diffusion tensor imaging of the lower leg musculature using eddy current nulled stimulated echo preparation. MRM. 2006;55:541-548.
4. Sigmund EE, Sui D, Okpebor O, Baete S, Fieremans E, Babb JS, Mechlin M, Liu K, Kwon J, Mcgorty K, Hodnett P, Bencardino J. Stimulated echo diffusion tensor imaging and SPAIR T2-weighted imaging in chronic exertional compartment syndrome of the lower leg muscles. JMRI. 2013;38:1073-1082.
5. Fieremans E, Lemberskiy G, Veraart J, Sigmund EE, Gyftopoulos S, Novikov D. In vivo measurement of membrane permeability and myofiber size in human muscle using time-dependent diffusion tensor imaging and the random permeable barrier model. NMR Biomed. 2017;30:e3612.
6. Winters KV, Reynaud O, Novikov D, Fieremans E, Kim SG. Quantifying myofiber integrity using diffusion MRI and random permeable barrier modeling in skeletal muscle growth and Duchenne muscular dystrophy model in mice. MRM. 2018;80:2094-2108.
7. Berry DB, Englund EK, Galinsky V, Konersman C, Chen S, Ward SR, Frank LR. Simulated effect of diffusion time and skeletal muscle fiber size on the diffusion tensor. Proc ISMRM. 2019;27:1283.
8. Balls GT, Frank LR. 2009. A simulation environment for diffusion weighted MR experiments in complex media. Magn. Reson. Med. 62(3):771–778.
9. Cox RW. 1996. AFNI: Software for Analysis and Visualization of Functional Magnetic Resonance Neuroimages. Comput. Biomed. Res. 29(3):162–173.
10. Damon BM. MRM. 2008; 60:934-944.
11. Morvan D, Leroy-Willig A, Jehenson P, Cuenod CA, Syrota A. Temperature changes induced in human muscle by radio-frequency H-1 decoupling: Measurement with an MR imaging diffusion technique. Radiology. 1992;185:871-874.
Figures