2696
IVIM MRI evaluation of blood flow response to exercise in patients with low back pain compared to healthy, pain-free controls1Orthopaedic Surgery, University of California San Diego, La Jolla, CA, United States, 2Nanoengineering, University of California San Diego, La Jolla, CA, United States, 3Radiology, University of California San Diego, La Jolla, CA, United States, 4Bioengineering, University of California San Diego, La Jolla, CA, United States
Synopsis
IVIM MRI was used to evaluate changes in muscle blood flow before and after lumbar extension exercise in patients with low back pain and healthy controls. Results showed that IVIM was sensitive to blood flow changes from exercise in both groups. Pain free controls had a higher mean diffusion coefficient (D) and the change in D from exercise was also greater in this cohort. A subset of patients with low back pain who had a limited response to exercise per the pseudo-diffusion coefficient (D*) were also found to have no improvement in disability following a 12-week physical therapy regimen.
Introduction
Low back pain (LBP) affects 65%-85% of the US population during their lifetime.1-3 Exercises to strengthen and stabilize the trunk musculature are a common conservative treatment strategy for LBP.4 However, patients with LBP may not have the same ability to activate their muscles as pain-free controls due to physical or psychological inhibition.5Muscle activity induces changes in blood flow. Intravoxel incoherent motion (IVIM) MRI permits evaluation of blood flow by acquisition of diffusion-weighted images over a range of b-values, sensitizing the data not only to molecular diffusion but also microvascular blood flow.6-9 The measured data are fit to a bi-exponential model that describes the contribution of microvascular blood flow and molecular diffusion as:
S(b)/S0=(1-f)e-bD+fe-bD*
where S(b)/S0 is measured data at a given b-value, normalized by a non-diffusion-weighted acquisition, f is perfusion fraction, D the diffusion coefficient, and D* the pseudo-diffusion coefficient (related to flow in the microvasculature).
Here, we measured IVIM signal changes following a bout of lumbar extension exercise in patients with LBP and to compare the response to pain-free healthy controls. We hypothesized that the magnitude of changes in IVIM parameters in the lumbar extensor muscles will differ between patients with LBP and individuals without pain.
Methods
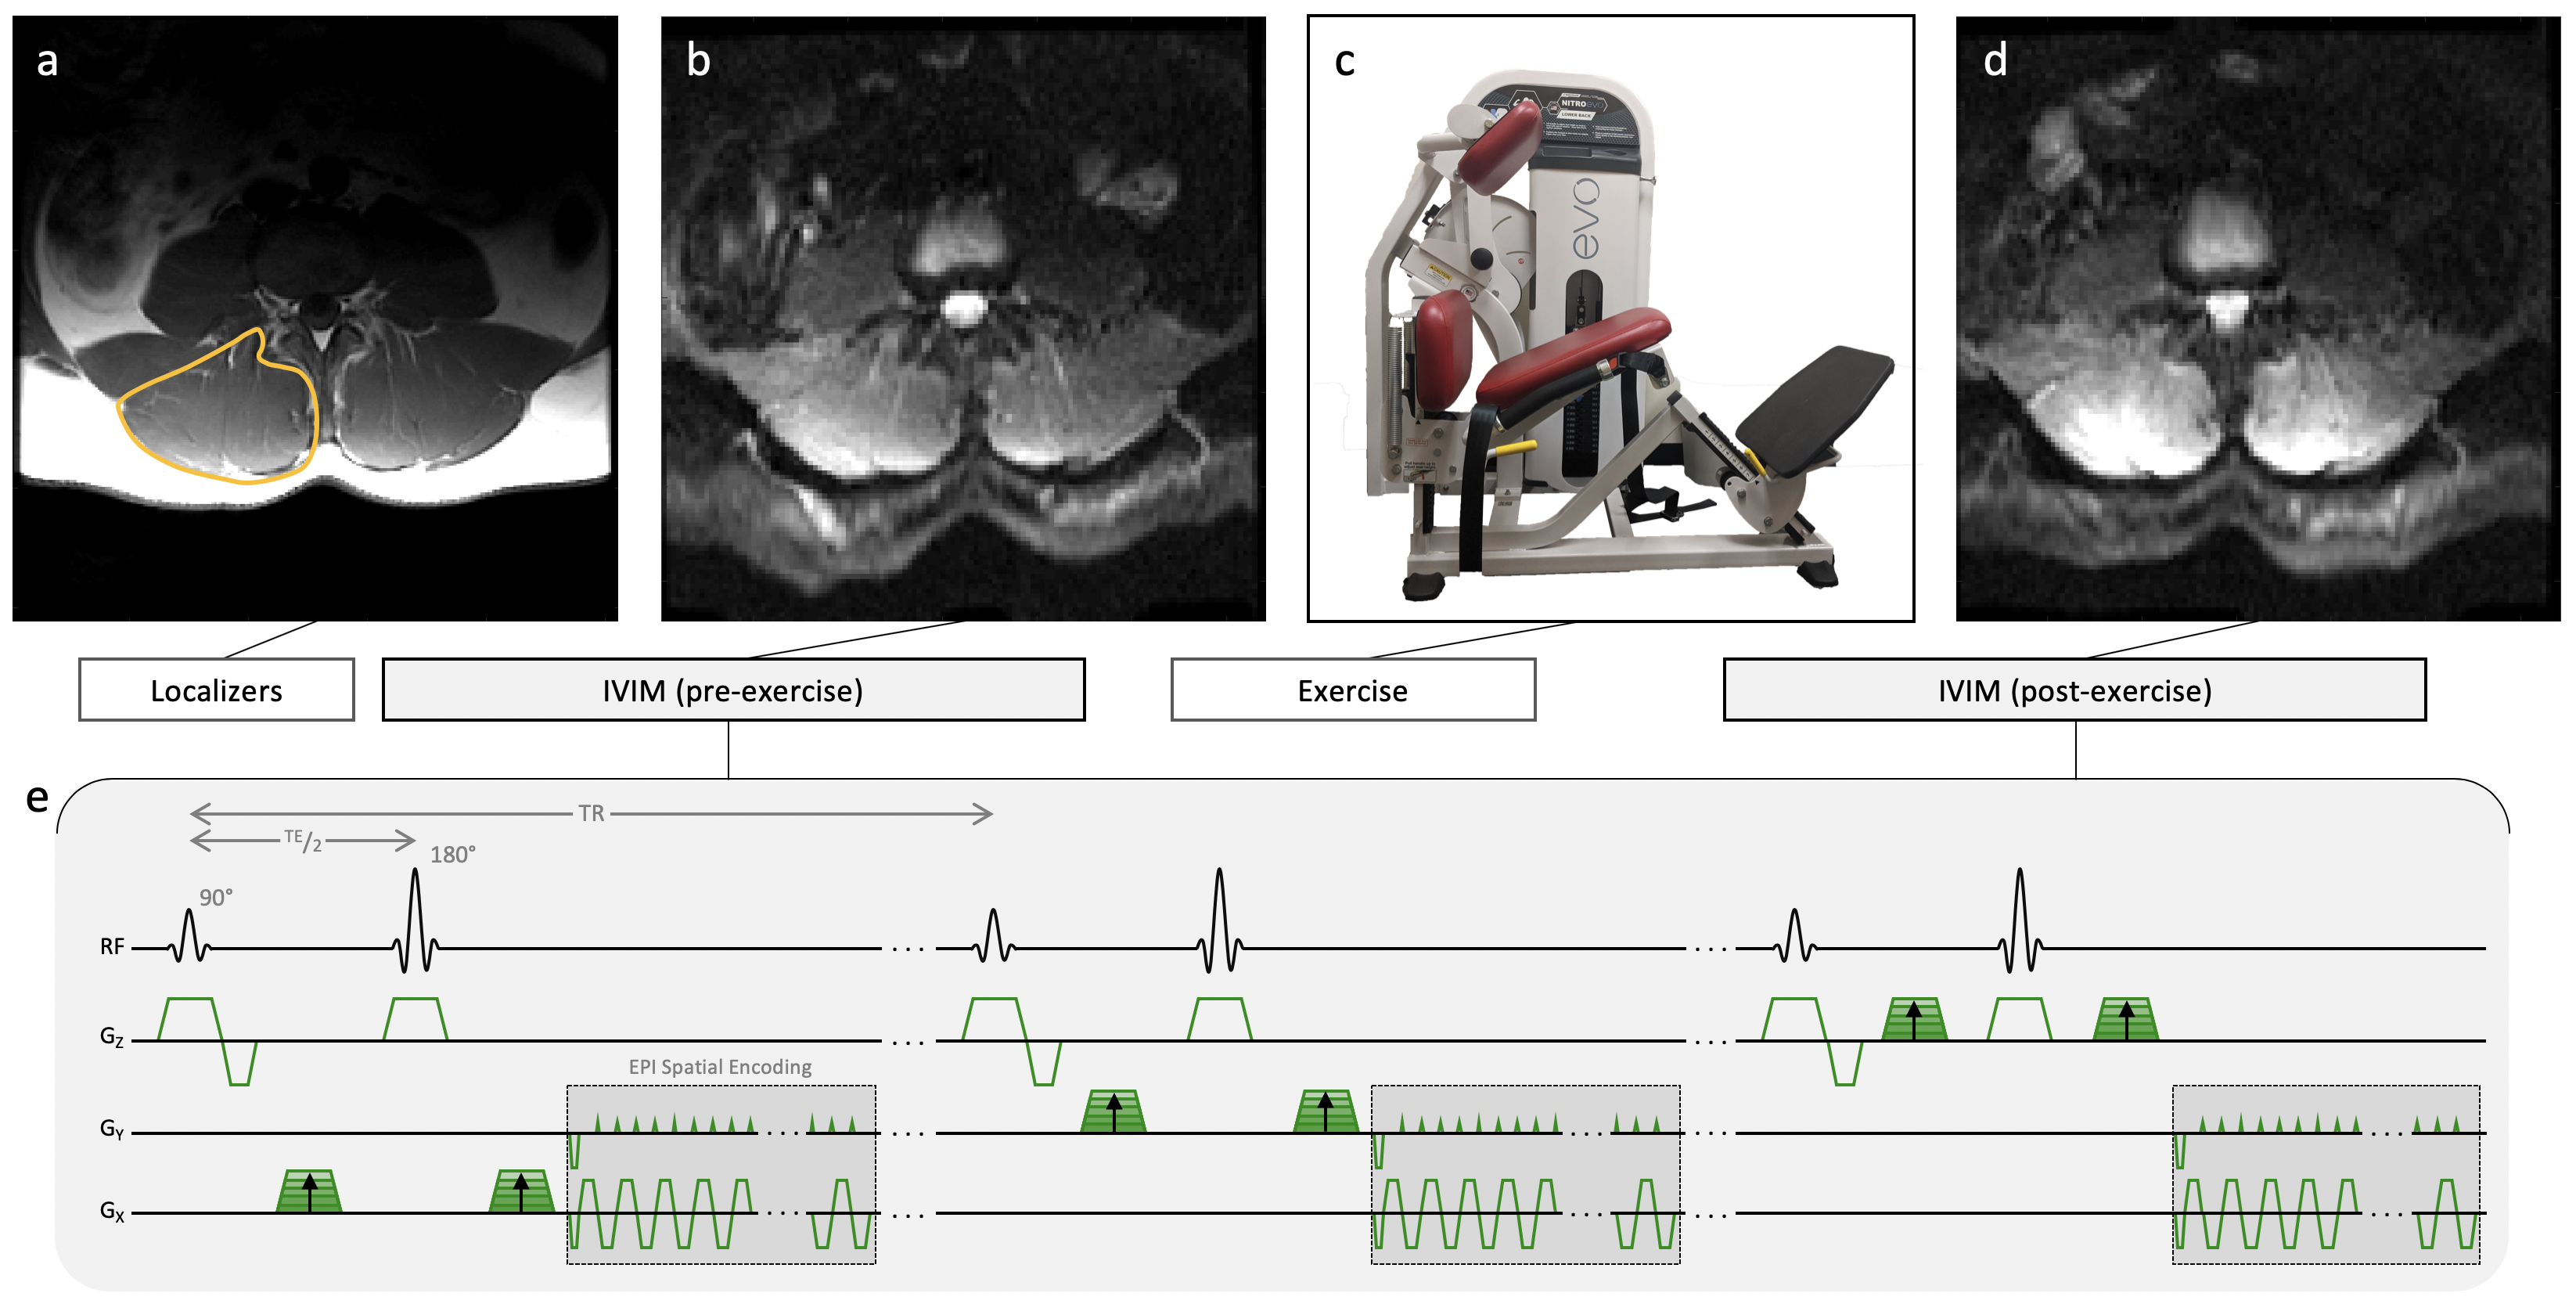
Seventeen patients with a clinical diagnosis of LBP (5 male, age=52.5±16.1 years) were recruited from a rehabilitation clinic. Eleven pain-free subjects (8 male, age=42.6±14.0 years) served as healthy controls. The change in LBP-related disability assessed by Oswestry Disability Index (ODI) following a 12-week high-intensity exercise rehabilitation program was obtained in 13/17 patients with LBP, where a positive ΔODI means less disability.MR data were collected at 3T. Localizers and IVIM data were collected at rest and immediately after a ~ 3 min bout of high-intensity resisted lumbar extensions performed outside of the scanner (Figure 1). Subjects were instructed to target a relative perceived exertion (RPE) of 7/10 (where 10 is maximum perceived exertion). Exercise was self-paced and resistance weight was adjusted for each subject in order to achieve an RPE of 7. Weight was set to 60% of clinically-obtained maximum voluntary contraction measured via isokinetic dynamometer for the LBP patients and 60% of body weight for the controls.
IVIM acquisition was a 2D diffusion-weighted spin echo EPI with: FOV=256×256 mm2, slice thickness=8 mm, 22 slices covering the entire lumbar spine (L1-S1), matrix=128×128, TR/TE=2295/52.5 ms, flip angle=90˚, averages=4, and diffusion direction=3 with b-values=0,10,20,40,70,110,160,220,300,400,500,600,700 s/mm2, acquisition time=347 s.
Non-linear least-squares fitting was used to solve for parameter maps of D, f, and D* from the IVIM data using a standard two-part approach. First, b>200 s/mm2 data were fit to S(b)/S0 = Ae-bD, where A is a constant that allows an offset at b=0 s/mm2. Using the obtained D, a second fit of S(b)/S0 = (1-f)e-bD + fe-bD* was performed over all b-values to determine f and D*. Parameters were averaged across the lumbar extensor muscles (e.g. multifidus and erector spinae muscles). Two-way repeated-measures ANOVAs were used to compare IVIM parameters before and after exercise between groups.
Results
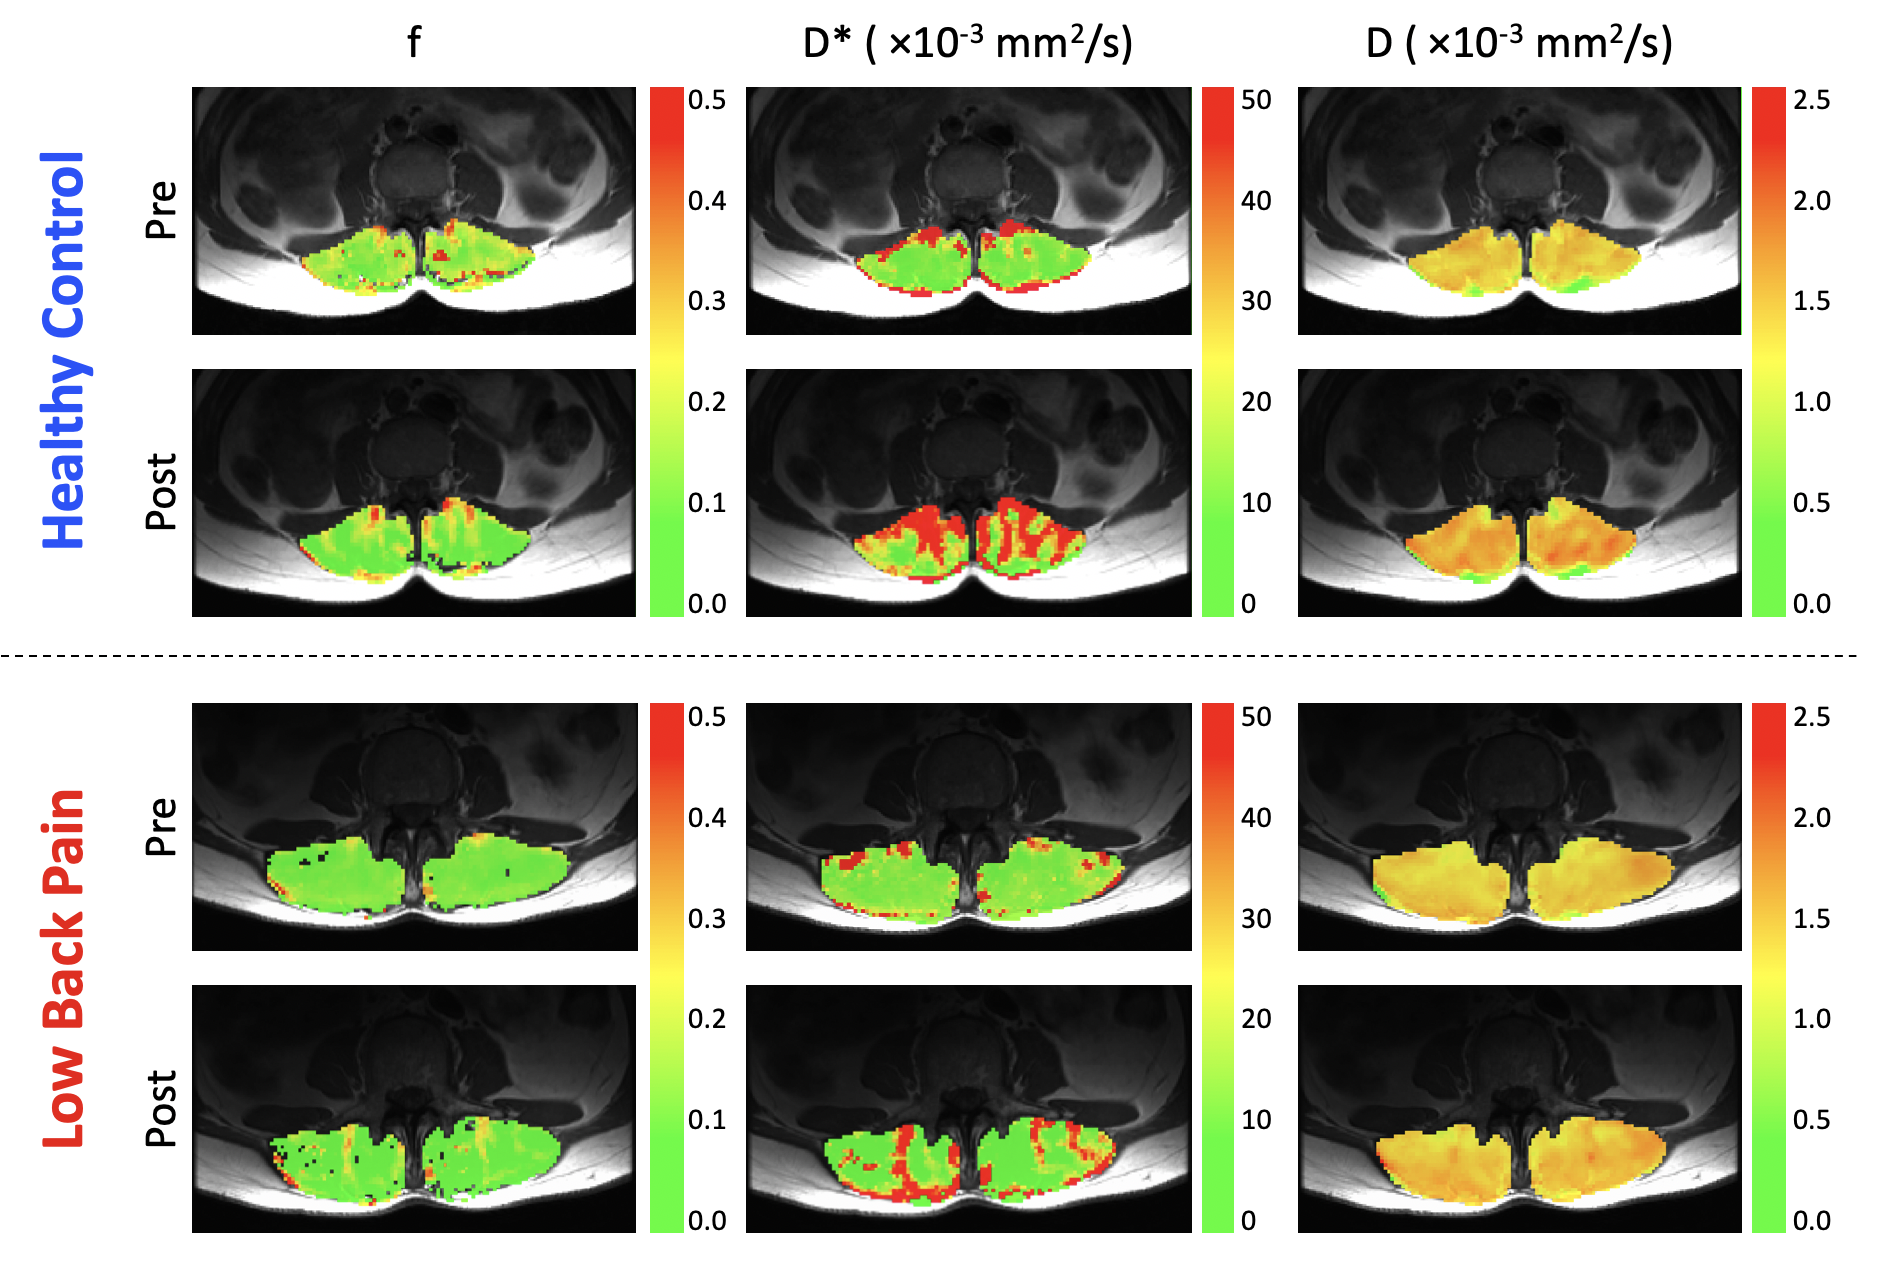
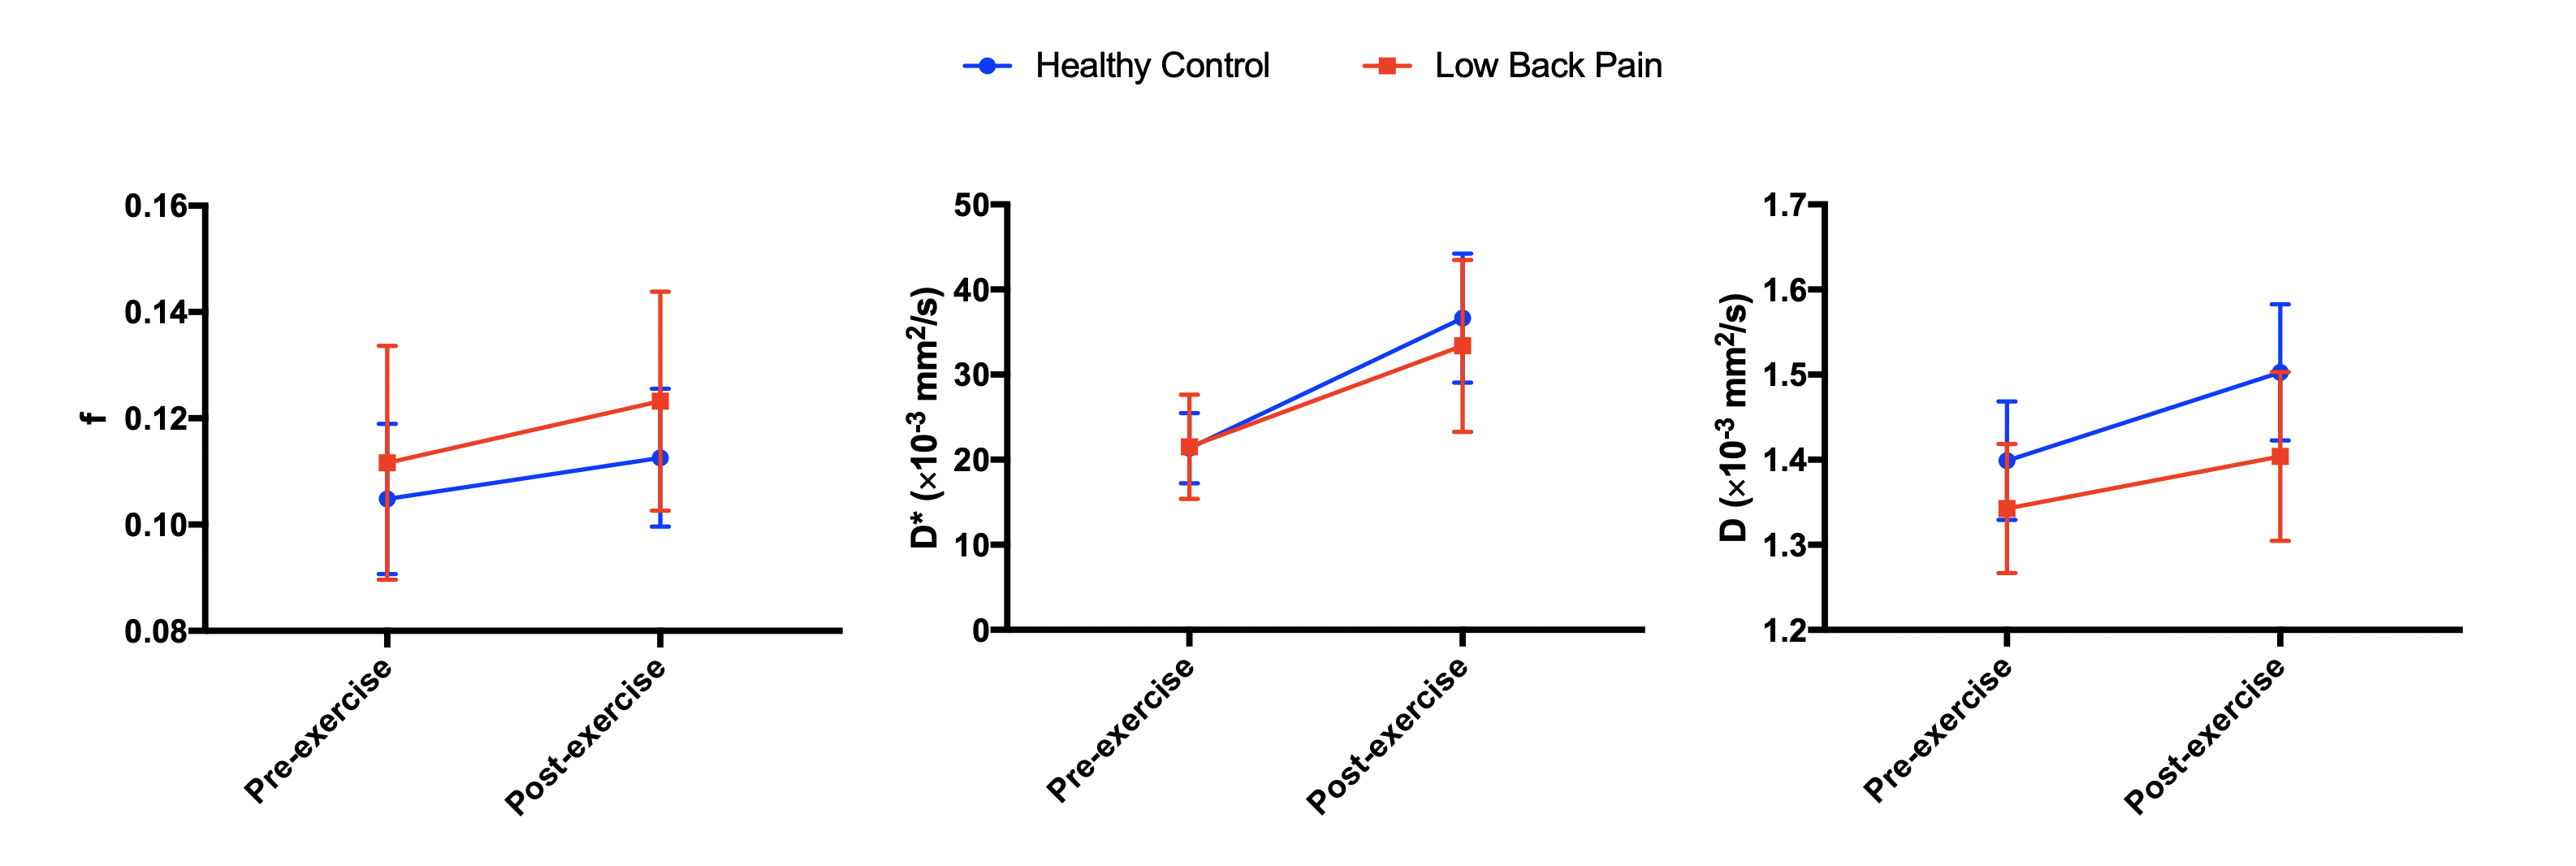
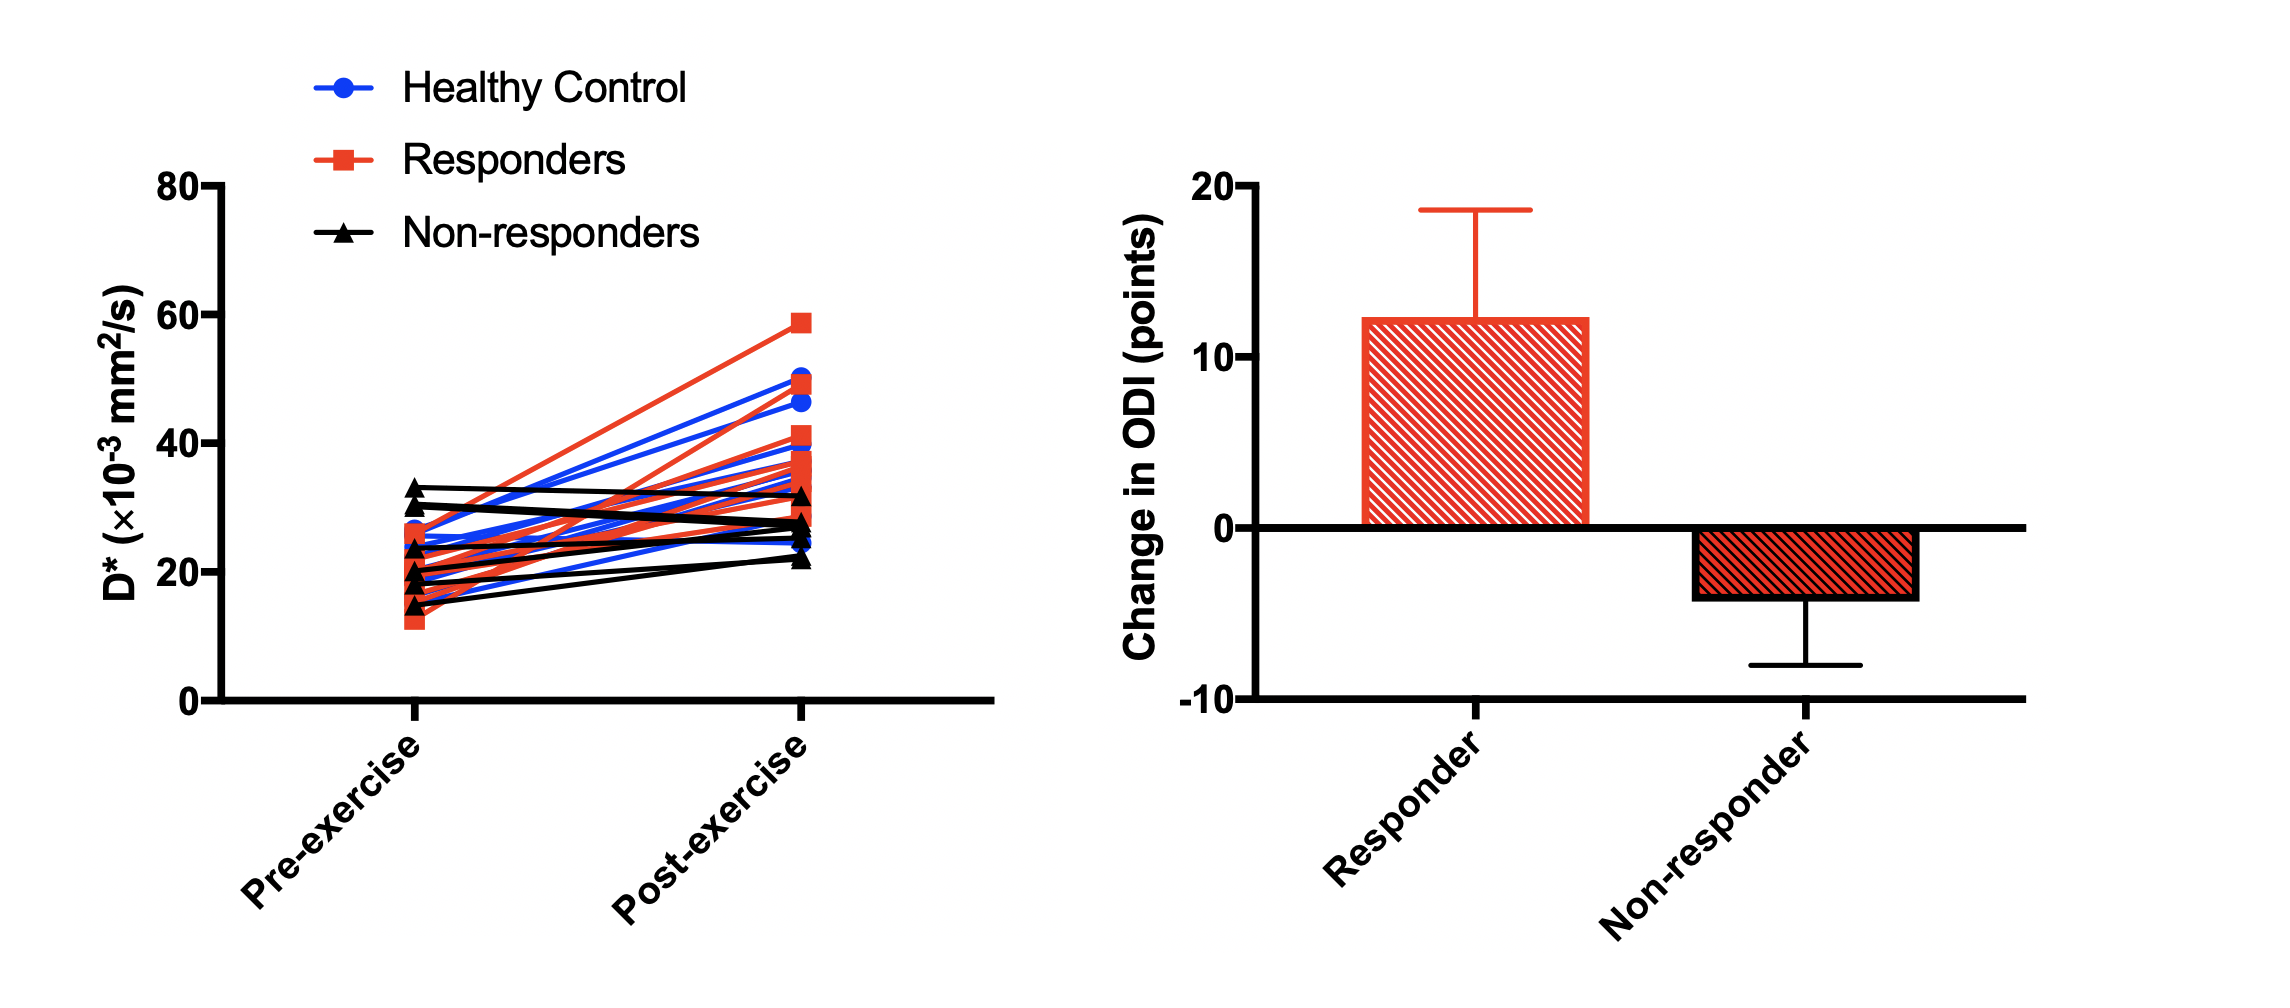
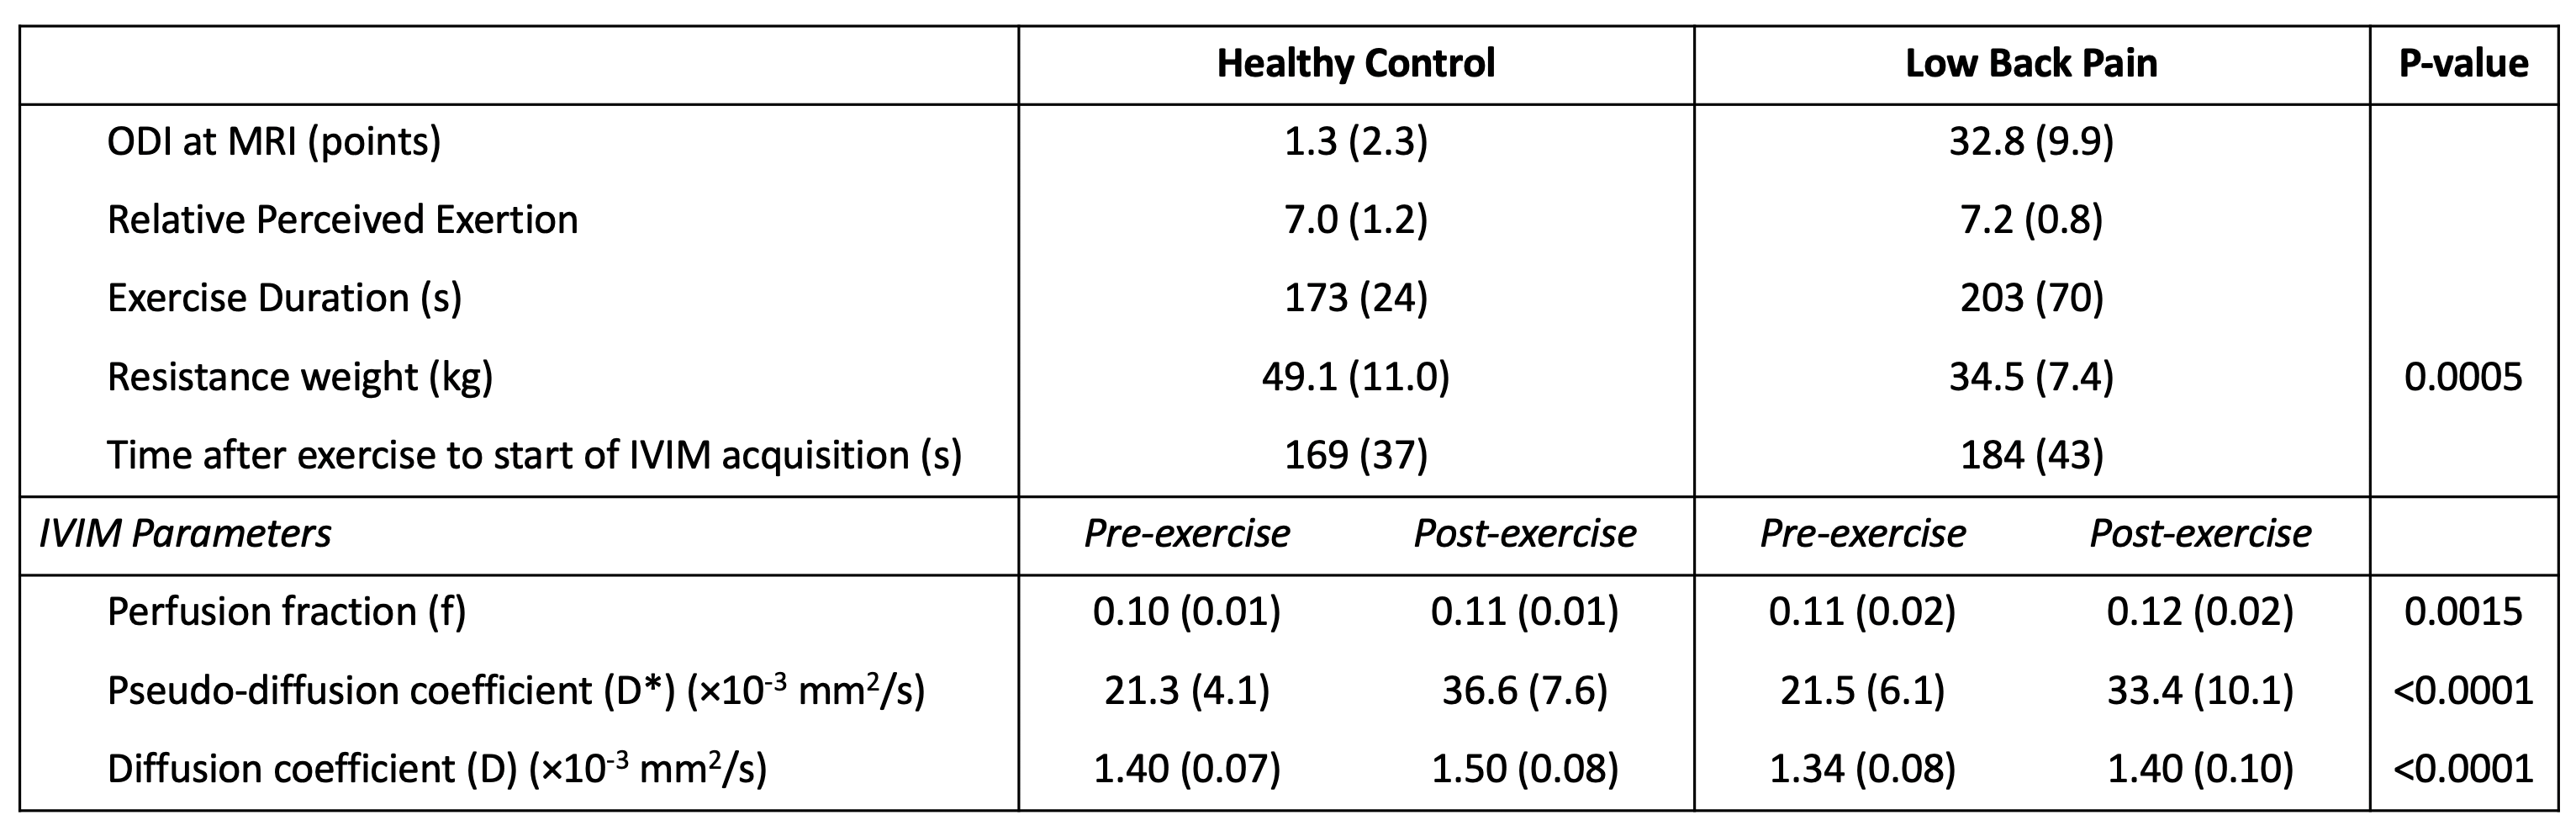
Three subjects were excluded from analysis, one (LBP) because pain limited the exercise intensity (RPE=2), and two (one per group) due to image artifacts. Results are summarized in Table 1. The resistance weight was higher in the healthy control group (p=0.0005), however the mean RPE was not significantly different between groups: 7.2±0.8 (LBP) versus 7.0±1.2 (healthy) (p>0.05). Figure 2 shows maps of D, f, and D* at rest and following exercise. Overall, there was a significant increase in all IVIM parameters (f, D*, D) in response to exercise (Figure 3). The diffusion coefficient, D, differed significantly between groups (p=0.026), and there was an interaction of group-by-time (p=0.045).In addition, we observed a sub-group of patients with LBP who had almost no change in D* following exercise (n=7). (Figure 4). The patients in this sub-group also did not show improvement to the 12-week therapeutic exercise program (e.g. no significant change in disability, ΔODI=-4±4 points), while those patients that had an increase in D* similar to or higher than that of the control group demonstrated a clinically significant improvement in disability (ΔODI=12±6 points), (p=0.0001).
Discussion & Conclusion
Exercise was associated with an increase in f, D*, and D regardless of the presence of back pain. The increased f and D* may be interpreted as an expansion of capillary blood volume and faster blood flow, overall leading to more muscle perfusion following exercise, and the increased in D may reflect intra-cellular fluid shifts (e.g. cell swelling).7,10 In addition, D was higher and the change in D following exercise was greater in the healthy cohort compared to the patients with LBP. Although the resistance weight differed between groups, the prospective goal was to reach an RPE of 7/10, which was achieved in both groups.A sub-group analysis identified patients who were not responsive to exercise from the standpoint of immediate post-exercise changes in D*. Those patients also had no clinically significant change in disability following the 12-week program. These results suggest that IVIM may be a useful tool to predict clinical responsiveness to exercise therapy. However, additional recruitment and analyses are needed to validate this finding.
Acknowledgements
NIH grant R03 HD094598References
1. Collaborators UBoD. The state of US health, 1990-2010: burden of diseases, injuries, and risk factors. JAMA. 2013;310(6):591-608.
2. Andersson GB. Epidemiological features of chronic low-back pain. Lancet. 1999;354(9178):581-5.
3. Maetzel A, Li L. The economic burden of low back pain: a review of studies published between 1996 and 2001. Best Pract Res Clin Rheumatol. 2002;16(1):23-30.
4. Hayden JA, van Tulder MW, Tomlinson G. Systematic review: strategies for using exercise therapy to improve outcomes in chronic low back pain. Ann Intern Med. 2005;142(9):776-85.
5. Verbunt JA, Seelen HA, Vlaeyen JW, Bousema EJ, van der Heijden GJ, Heuts PH, Knottnerus JA. Pain-related factors contributing to muscle inhibition in patients with chronic low back pain: An experimental investigation based on superimposed electrical stimulation. Clin J Pain. 2005; 21:232-240.
6. Le Bihan D, Breton E, Lallemand D, Grenier P, Cabanis E, Laval-Jeantet M. MR imaging of intravoxel incoherent motions: application to diffusion and perfusion in neurologic disorders. Radiology. 1986; 161(2):401-407.
7. Filli L, Boss A, Wurnig MC, Kenkel D, Andreisek G, Guggenberger R. Dynamic intravoxel incoherent motion imaging of skeletal muscle at rest and after exercise. NMR in Biomed. 2015; 28:240-246.
8. Nguyen A, Ledoux JB, Omoumi P, Becce F, Forget J, Federau C. Application of intravoxel incoherent motion perfusion imaging to shoulder muscles after a lift-off test of varying duration. NRM Biomed. 2016; 29:66-73.
9. Adelnia F, Shardell M, Bergeron CM, Fishbein KW, Spencer RG, Ferrucci L, Reiter DA. Diffusion-weighted MRI with intravoxel incoherent motion modeling for assessment of muscle perfusion in the thigh during post-exercise hyperemia in younger and older adults. NMR Biomed. 2019; 32(5):e4072.
10. Federau C. Intravoxel incoherent motion MRI as a means to measure in vivo perfusion: A review of the evidence. NMR Biomed. 2017;30:e3780.
Figures