2694
Dynamic Contrast Enhanced MR Imaging of Synovitis: Repeatability, Discriminative Validity and Responsiveness in Knee Osteoarthritis
James MacKay1,2, Faezeh Sanaei Nehad3, Josh Kaggie2, Jo Naish3, Caleb Roberts3, Martin Graves2, Fiona Gilbert2, Andrew McCaskie4, John Waterton3,5, Rob Janiczek6, Alexandra Roberts6, and Geoff Parker3
1Radiology, University of East Anglia, Norwich, United Kingdom, 2Radiology, University of Cambridge, Cambridge, United Kingdom, 3BiOxyDyn Ltd, Manchester, United Kingdom, 4Surgery, University of Cambridge, Cambridge, United Kingdom, 5Informatics, Imaging & Data Sciences, University of Manchester, Manchester, United Kingdom, 6Clinical Imaging, GlaxoSmithKline, Stevenage, United Kingdom
1Radiology, University of East Anglia, Norwich, United Kingdom, 2Radiology, University of Cambridge, Cambridge, United Kingdom, 3BiOxyDyn Ltd, Manchester, United Kingdom, 4Surgery, University of Cambridge, Cambridge, United Kingdom, 5Informatics, Imaging & Data Sciences, University of Manchester, Manchester, United Kingdom, 6Clinical Imaging, GlaxoSmithKline, Stevenage, United Kingdom
Synopsis
Synovitis is common in knee osteoarthritis (OA) and can be quantified using dynamic contrast-enhanced MR imaging (DCE-MRI). There is a strong rationale for therapeutic targeting of synovitis in OA, and imaging biomarkers derived from DCE-MRI may help evaluate response in clinical trials.
Here we evaluate the test-retest repeatability, ability to discriminate between OA (n = 14) and age-matched controls (n = 6) and 6-month responsiveness to change of three DCE-MRI biomarkers: Ktrans, IAUC60, and synovial tissue volume.
Ktrans demonstrated the best repeatability, discrimination and sensitivity to change suggesting that it is the optimal DCE-MRI biomarker for use in clinical trials.
Introduction
Synovial inflammation (synovitis) is present in up to 90% of knees with osteoarthritis (OA)1. There is a strong rationale for therapeutic targeting of synovitis for disease modification2. Dynamic contrast enhanced MR imaging (DCE-MRI) can quantify synovitis and could improve early outcome assessment in clinical trials. In personalised healthcare, DCE-MRI could be used to select patients suitable for synovitis-targeted therapies. DCE-MRI has demonstrated superior responsiveness to qualitative assessment of synovitis in rheumatoid arthritis but has not been fully evaluated in OA3. Therefore, the purpose of this study was to evaluate the performance characteristics of DCE-MRI biomarkers for use in OA clinical trials.Methods
Participants & proceduresFourteen participants with a clinical diagnosis of knee OA per American College of Rheumatology criteria and six age-matched healthy volunteers (HV) were included. Participants underwent MR imaging of a single knee (most symptomatic knee in OA participants, randomly selected knee in HV) on a 3T platform (GE750, GE Healthcare, Waukesha, WI) using an 8-channel transmit/receive knee coil (InVivo, Gainesville, FL). Imaging was performed at baseline, 1-month and 6-months follow-up, without disease modifying intervention during the follow-up period.
MR acquisition
MR sequences (Table 1) included pre-contrast variable flip angle T1 mapping using 3D SPGR sequences and a dynamic (multi-phase) 3D SPGR sequence (temporal resolution 14s). At the end of the 6th phase, gadoterate (Dotarem; Guerbet, Paris, France) was intravenously administered via a pump at a dose of 0.2 mmol/kg and a rate of 3 mL/s followed by a 50 mL saline chaser at the same rate. Imaging continued for a further 29 phases (35 phases total, acquisition time 8 min 10 s) following gadoterate administration. Pre and post contrast 3D fat-saturated (FS) SPGR sequences were also obtained for synovial segmentation purposes. The total time taken for all DCE-MRI sequences was approximately 21 minutes.
Image analysis
All DCE-MRI images were registered to the post-contrast 3D SPGR FS sequence for motion correction using an initial rigid transform followed by a window-limited deformable registration using the Advanced Normalization Tools4. Time-series data for each voxel were analysed to calculate the initial area under the time-concentration curve at 60 seconds (IAUC60). These data were also used as an input to the extended Tofts model to calculate Ktrans, the volume transfer coefficient between the plasma and the extracellular extravascular space which is a composite measure of blood flow and capillary permeability and reflects intensity of inflammation5. A population arterial input function corrected for individual haematocrit was used for the pharmacokinetic modelling6,7.
Initial rough manual segmentation of the synovium was performed on the post-contrast 3D FS SPGR sequence by an experienced musculoskeletal radiologist. Next, enhancing voxels were defined by subtracting the pre-contrast 3D FS SPGR sequence from the matching post-contrast sequence using a shuffle subtraction method8. The shuffle-subtracted images were then converted to binary enhancing masks using Otsu thresholding9. The intersection between this binary mask and the rough manual segmentation was used as the final region of interest (ROI) for extraction of IAUC60 and Ktrans values. In addition, the binary mask was used to create an estimate of synovial tissue volume (STV, measured in mL) by multiplying the number of voxels included in the mask by the voxel size.
Statistics
Test-retest repeatability was assessed by calculating root-mean-square coefficients of variation (RMSCV) from baseline and 1-month data. The smallest detectable difference (SDD) was also calculated for each DCE-MRI biomarker, representing the magnitude of change for an individual that would give 95% confidence of genuine change rather than measurement noise. Discrimination between OA and HV participants was assessed by calculating the standardised mean difference between groups using baseline data. Responsiveness was assessed by calculating the number of OA participants with 6-month changes greater than the SDD.
Results
Participant characteristics are provided in Table 2.Test-retest repeatability
RMSCV and SDD values for each DCE-MRI biomarker are provided in Figure 1. Ktrans had the lowest test-retest RMSCV (17.8%), followed by IAUC60 (32.3%) and STV (34.8%).
Discrimination between OA participants and HV
Dot and whisker plots for baseline between-group differences are provided in Figure 2. The highest standardised mean difference value was seen for Ktrans (0.94) followed by IAUC60 (0.54) and STV (0.50).
Sensitivity to change over 6 months
Example images of participants with significant changes in Ktrans over 6 months are provided in Figure 3. Five out of twelve OA participants had 6-month changes in Ktrans greater in magnitude than the SDD (i.e. likely representing true disease-related changes rather than measurement error), whereas for both IAUC60 and STV only one OA participant had 6-month changes greater in magnitude than the SDD (Figure 3C).
Discussion
Test-retest repeatability data on DCE-MRI biomarkers in OA have not previously been published, but the RMSCV values here are similar to previous DCE-MRI studies in other musculoskeletal applications10.Ktrans has the best performance characteristics for use in clinical trials in terms of repeatability and sensitivity to disease-related changes. This may be due to its improved physiological specificity when compared to other methods and suggests that full pharmacokinetic analysis should be preferred over model-free approaches.
Conclusion
Ktrans demonstrated the best repeatability, discrimination and sensitivity to change suggesting that it is the optimal DCE-MRI biomarker for use in clinical trials.Acknowledgements
The authors would like to acknowledge the support of the National Institute for Health Research Cambridge Biomedical Research Centre and the Addenbrooke's Charitable Trust.References
- Roemer, F. W. et al. Anatomical distribution of synovitis in knee osteoarthritis and its association with joint effusion assessed on non-enhanced and contrast-enhanced MRI. Osteoarthritis Cartilage 18, 1269–1274 (2010).
- Mathiessen, A. & Conaghan, P. G. Synovitis in osteoarthritis: current understanding with therapeutic implications. Arthritis Res. Ther. 19, 18 (2017).
- Conaghan, P. G. et al. Comparing the effects of tofacitinib, methotrexate and the combination, on bone marrow oedema, synovitis and bone erosion in methotrexate-naive, early active rheumatoid arthritis: results of an exploratory randomised MRI study incorporating semiquantitative and quantitative techniques. Ann. Rheum. Dis. 75, 1024–1033 (2016).
- ANTs by stnava. http://stnava.github.io/ANTs/.
- Tofts, P. S. Modeling tracer kinetics in dynamic Gd-DTPA MR imaging. J. Magn. Reson. Imaging JMRI 7, 91–101 (1997).
- Parker, G. J. M. et al. Experimentally-derived functional form for a population-averaged high-temporal-resolution arterial input function for dynamic contrast-enhanced MRI. Magn. Reson. Med. 56, 993–1000 (2006).
- Roberts, C. et al. Use of An Individually Measured Hematocrit in DCE-MRI studies. in Proc Intl Soc Mag Reson Med vol. 19 1078 (2011).
- Xanthopoulos, E. et al. Improved wrist pannus volume measurement from contrast-enhanced MRI in rheumatoid arthritis using shuffle transform. Magn. Reson. Imaging 25, 110–116 (2007).
- Otsu, N. A Threshold Selection Method from Gray-Level Histograms. IEEE Trans. Syst. Man Cybern. 9, 62–66 (1979).
- Waterton, J. C. et al. Repeatability and response to therapy of dynamic contrast-enhanced magnetic resonance imaging biomarkers in rheumatoid arthritis in a large multicentre trial setting. Eur. Radiol. 27, 3662–3668 (2017).
Figures
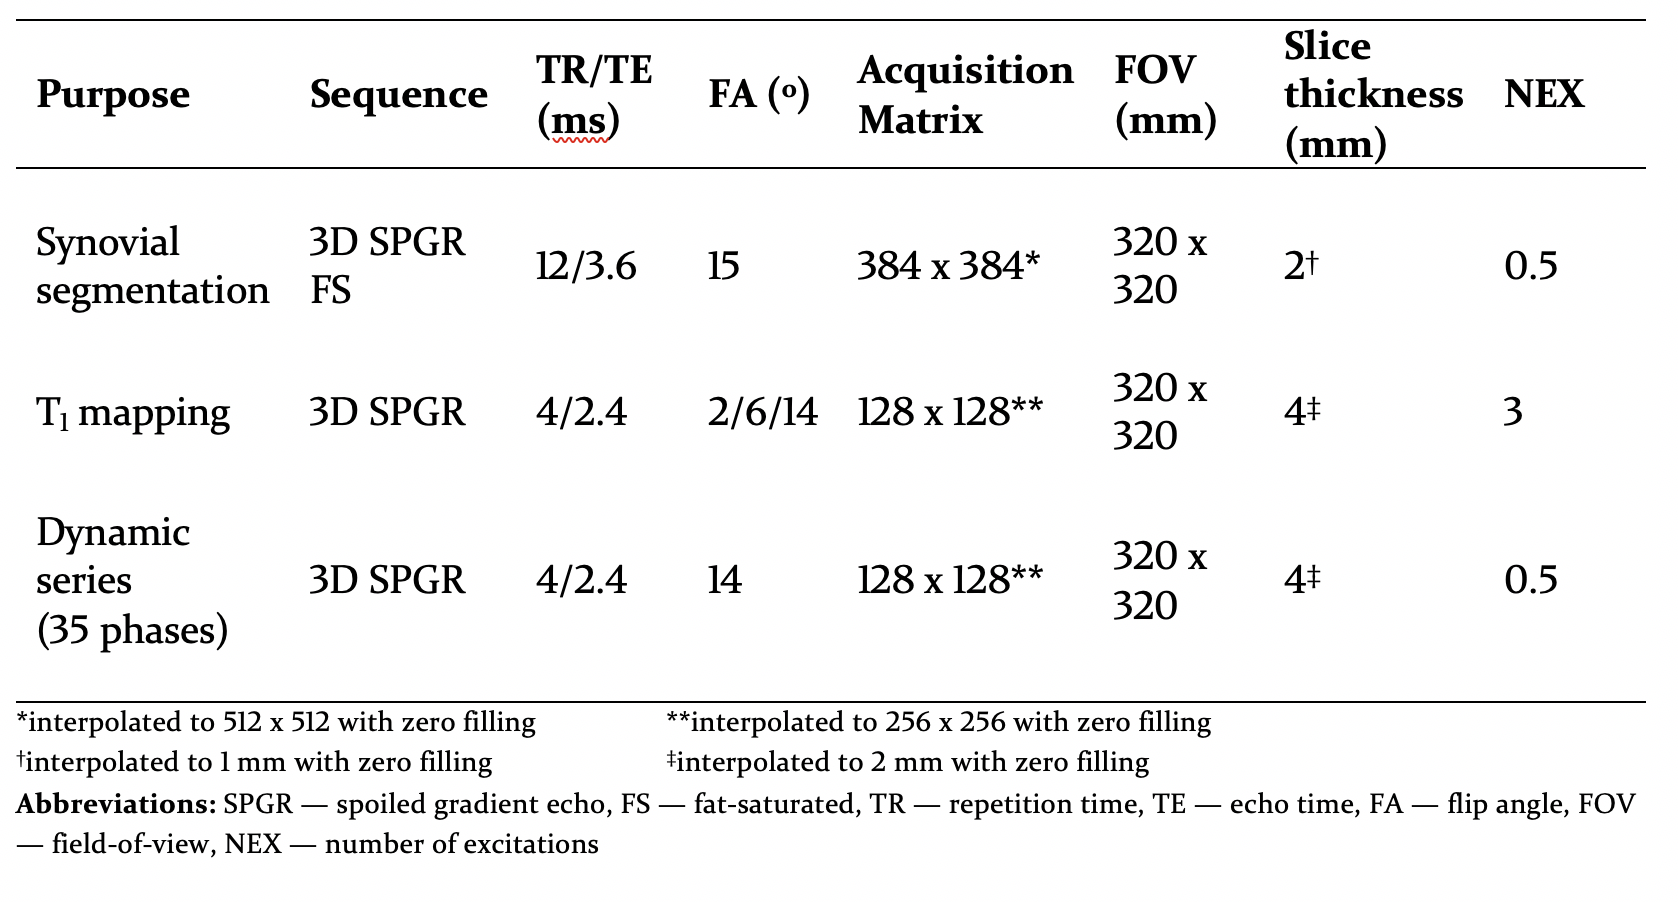
Table 1: MR pulse sequence parameters for DCE-MRI
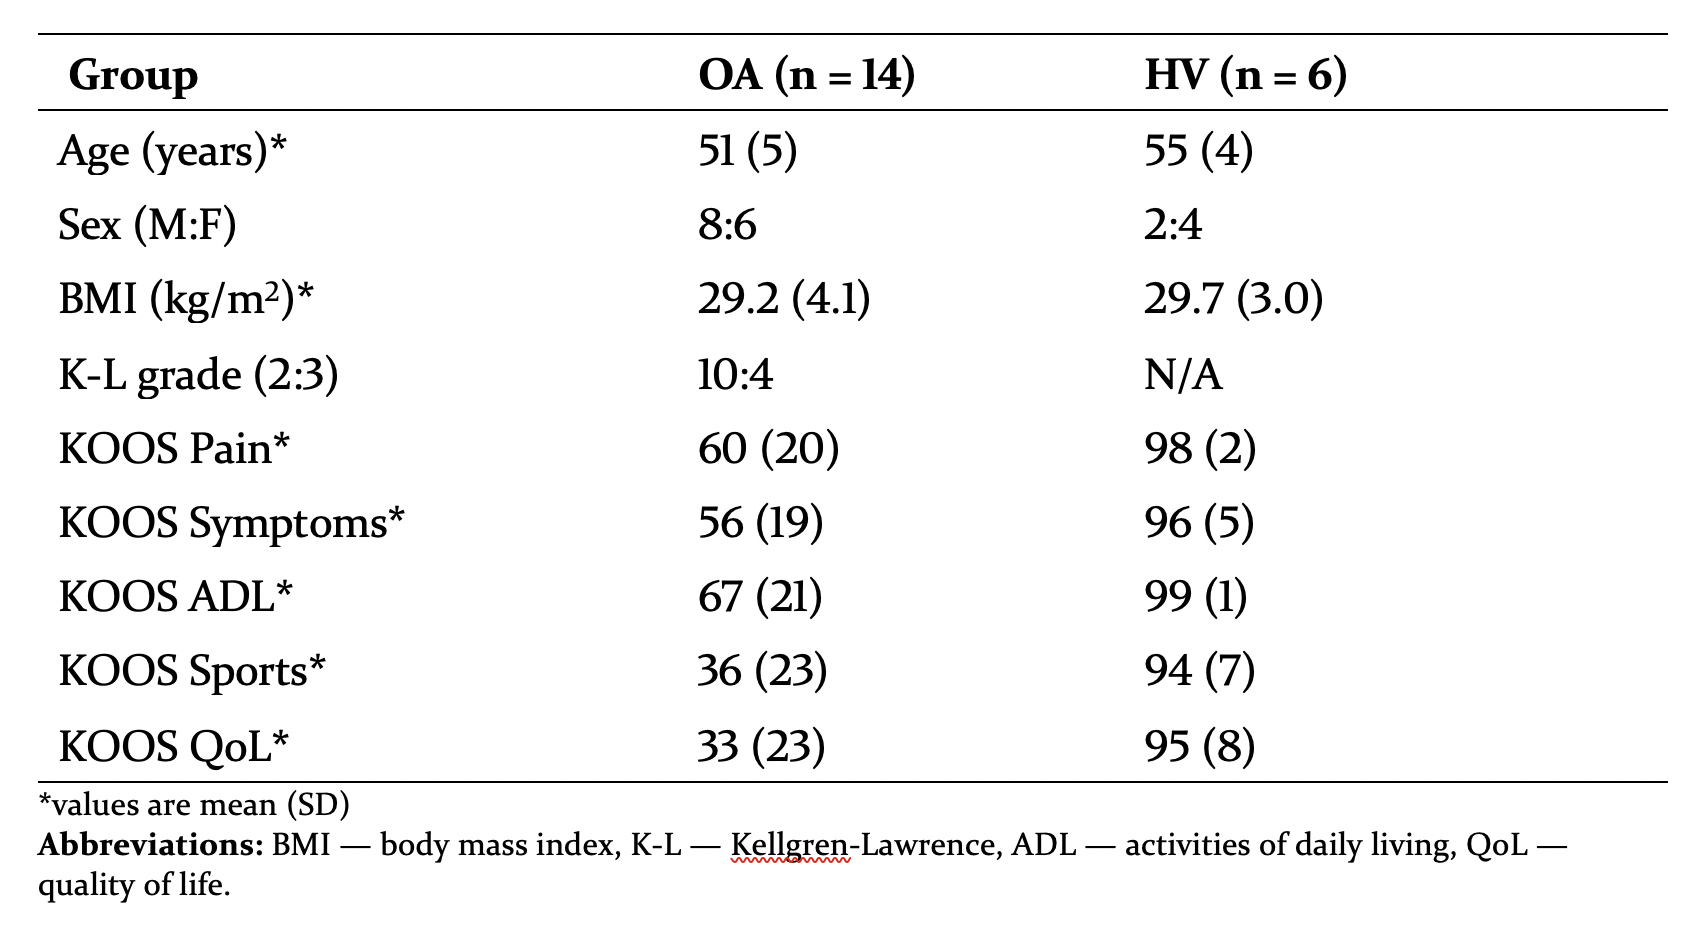
Table 2: Participant characteristics at baseline. The Knee injury and Osteoarthritis Outcome Score (KOOS) is a validated patient-reported outcome measure which assesses knee pain and symptoms as well as impact on knee-related activities of daily living, sports & recreation and quality of life. Scores range from 0–100, with 0 indicating the most severe symptoms possible and 100 indicating no symptoms.
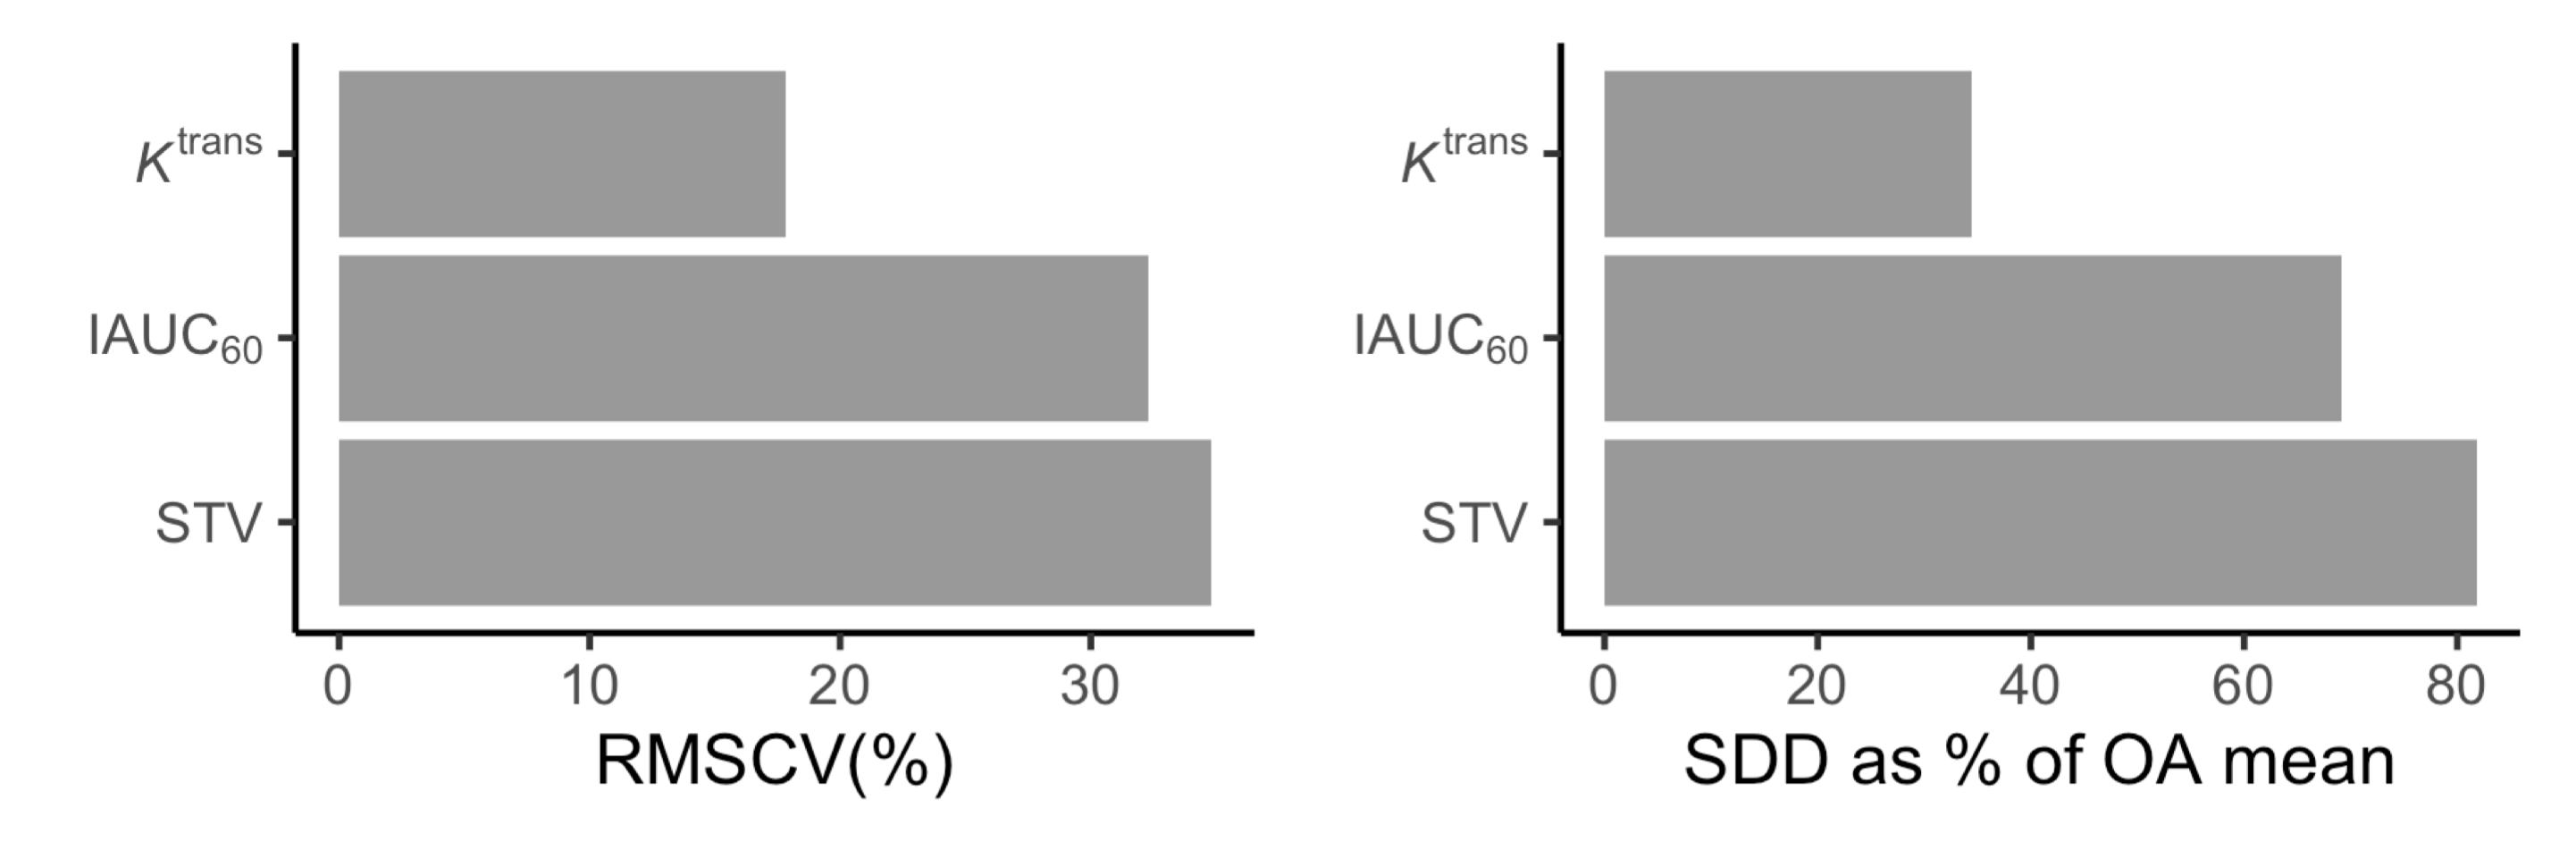
Figure 1: Root-mean-square coefficients of variation (RMSCV, left) and smallest detectable differences (SDD, right) for each DCE biomarker. To enable comparison between biomarkers, SDD values are presented as a percentage of the mean value in OA participants. For example, in an average OA participant a change in Ktrans of greater than ~35% would have less than a 5% chance of being due to measurement error. Absolute SDD values are as follows: Ktrans — 0.014 min-1, IAUC60 — 6.9 mM.s, STV (synovial tissue volume) — 89 mL.
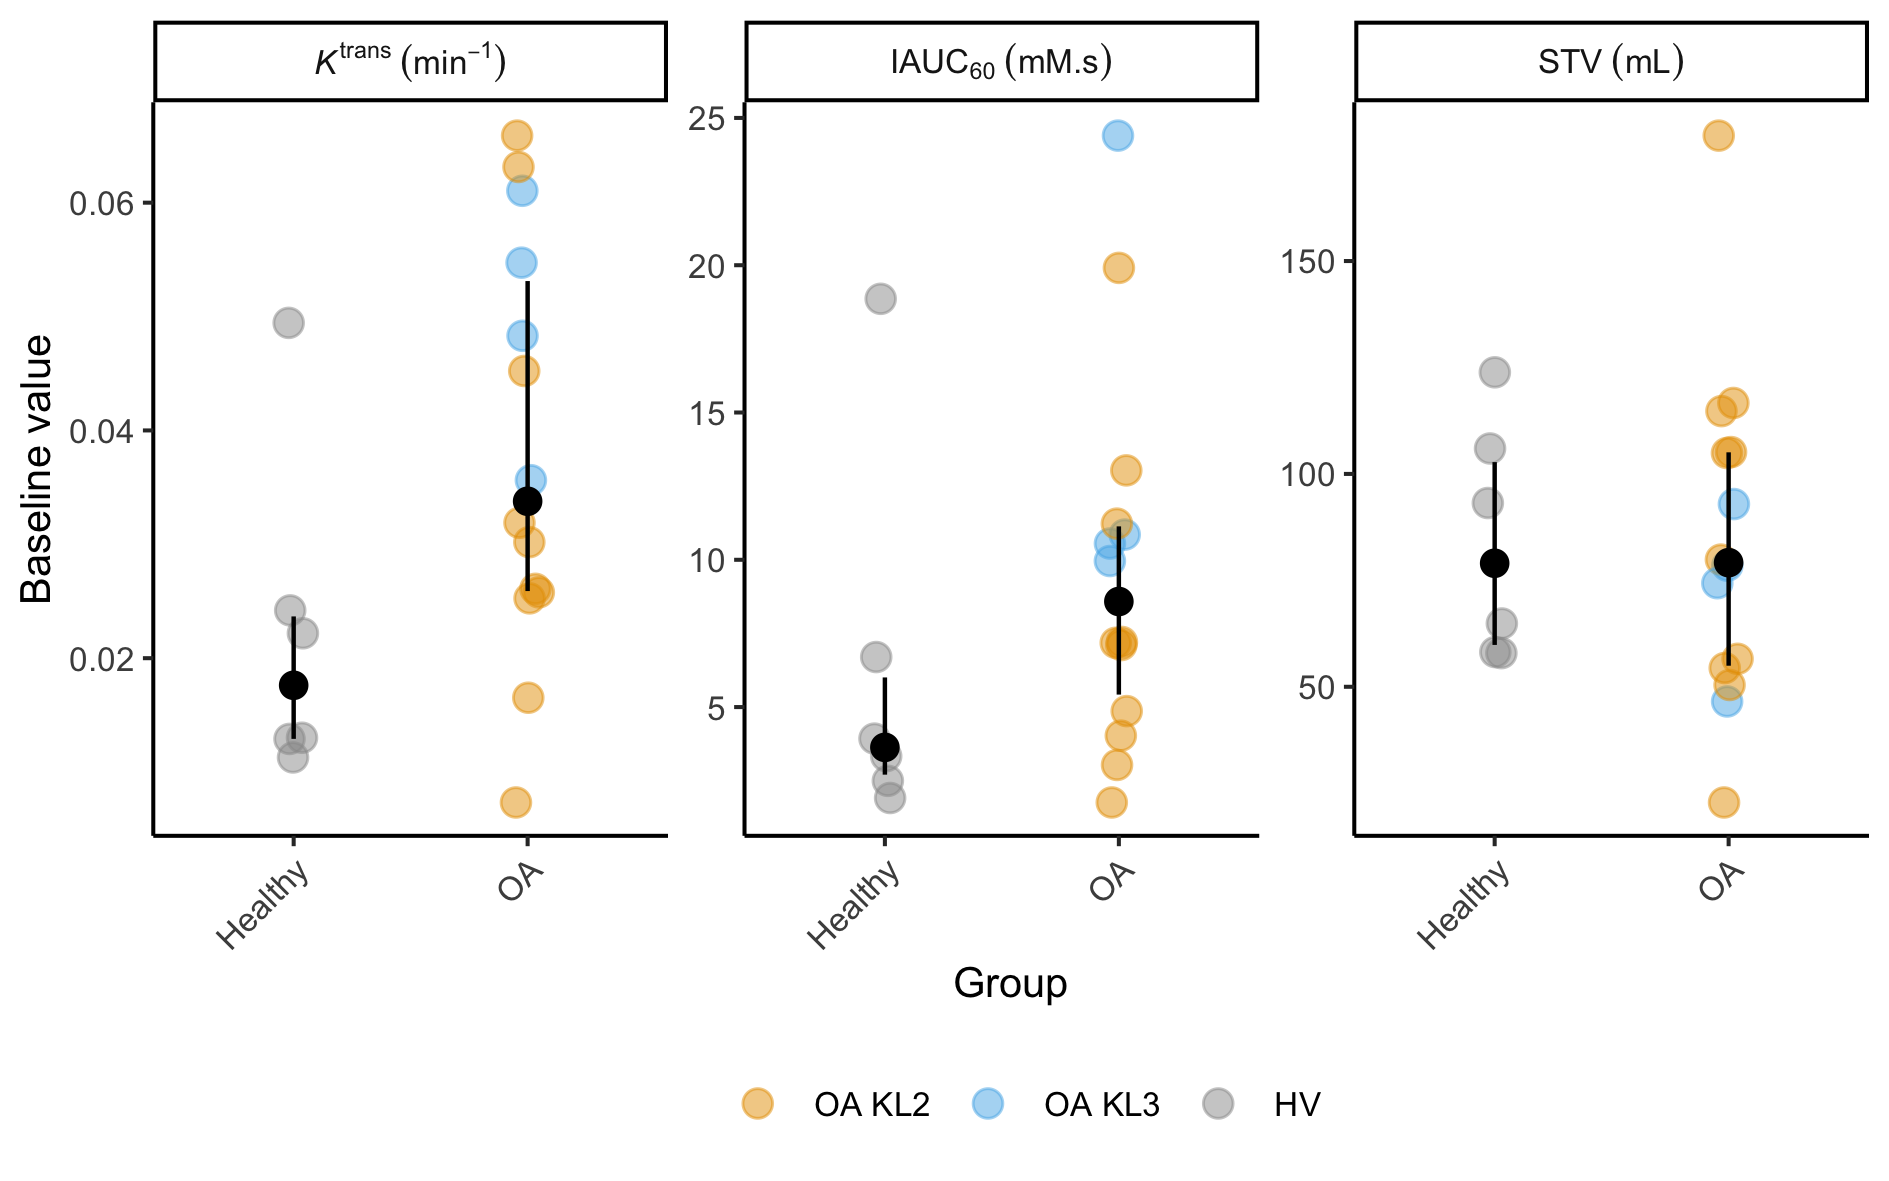
Figure 2: Baseline DCE-MR biomarker values for each participant. Black dots are median values, with interquartile range error bars. Note outlier HV value for Ktrans and IAUC60 — this participant had attended karate practice the night before the scan, and had a history of gout elsewhere (never having clinically affected the knee). Possible reasons for this value are (a) the effect of intensive exercise, (b) the effects of subclinical crystal arthropathy or (c) part of normal variation. This outlier HV value was included in effect size calculations.
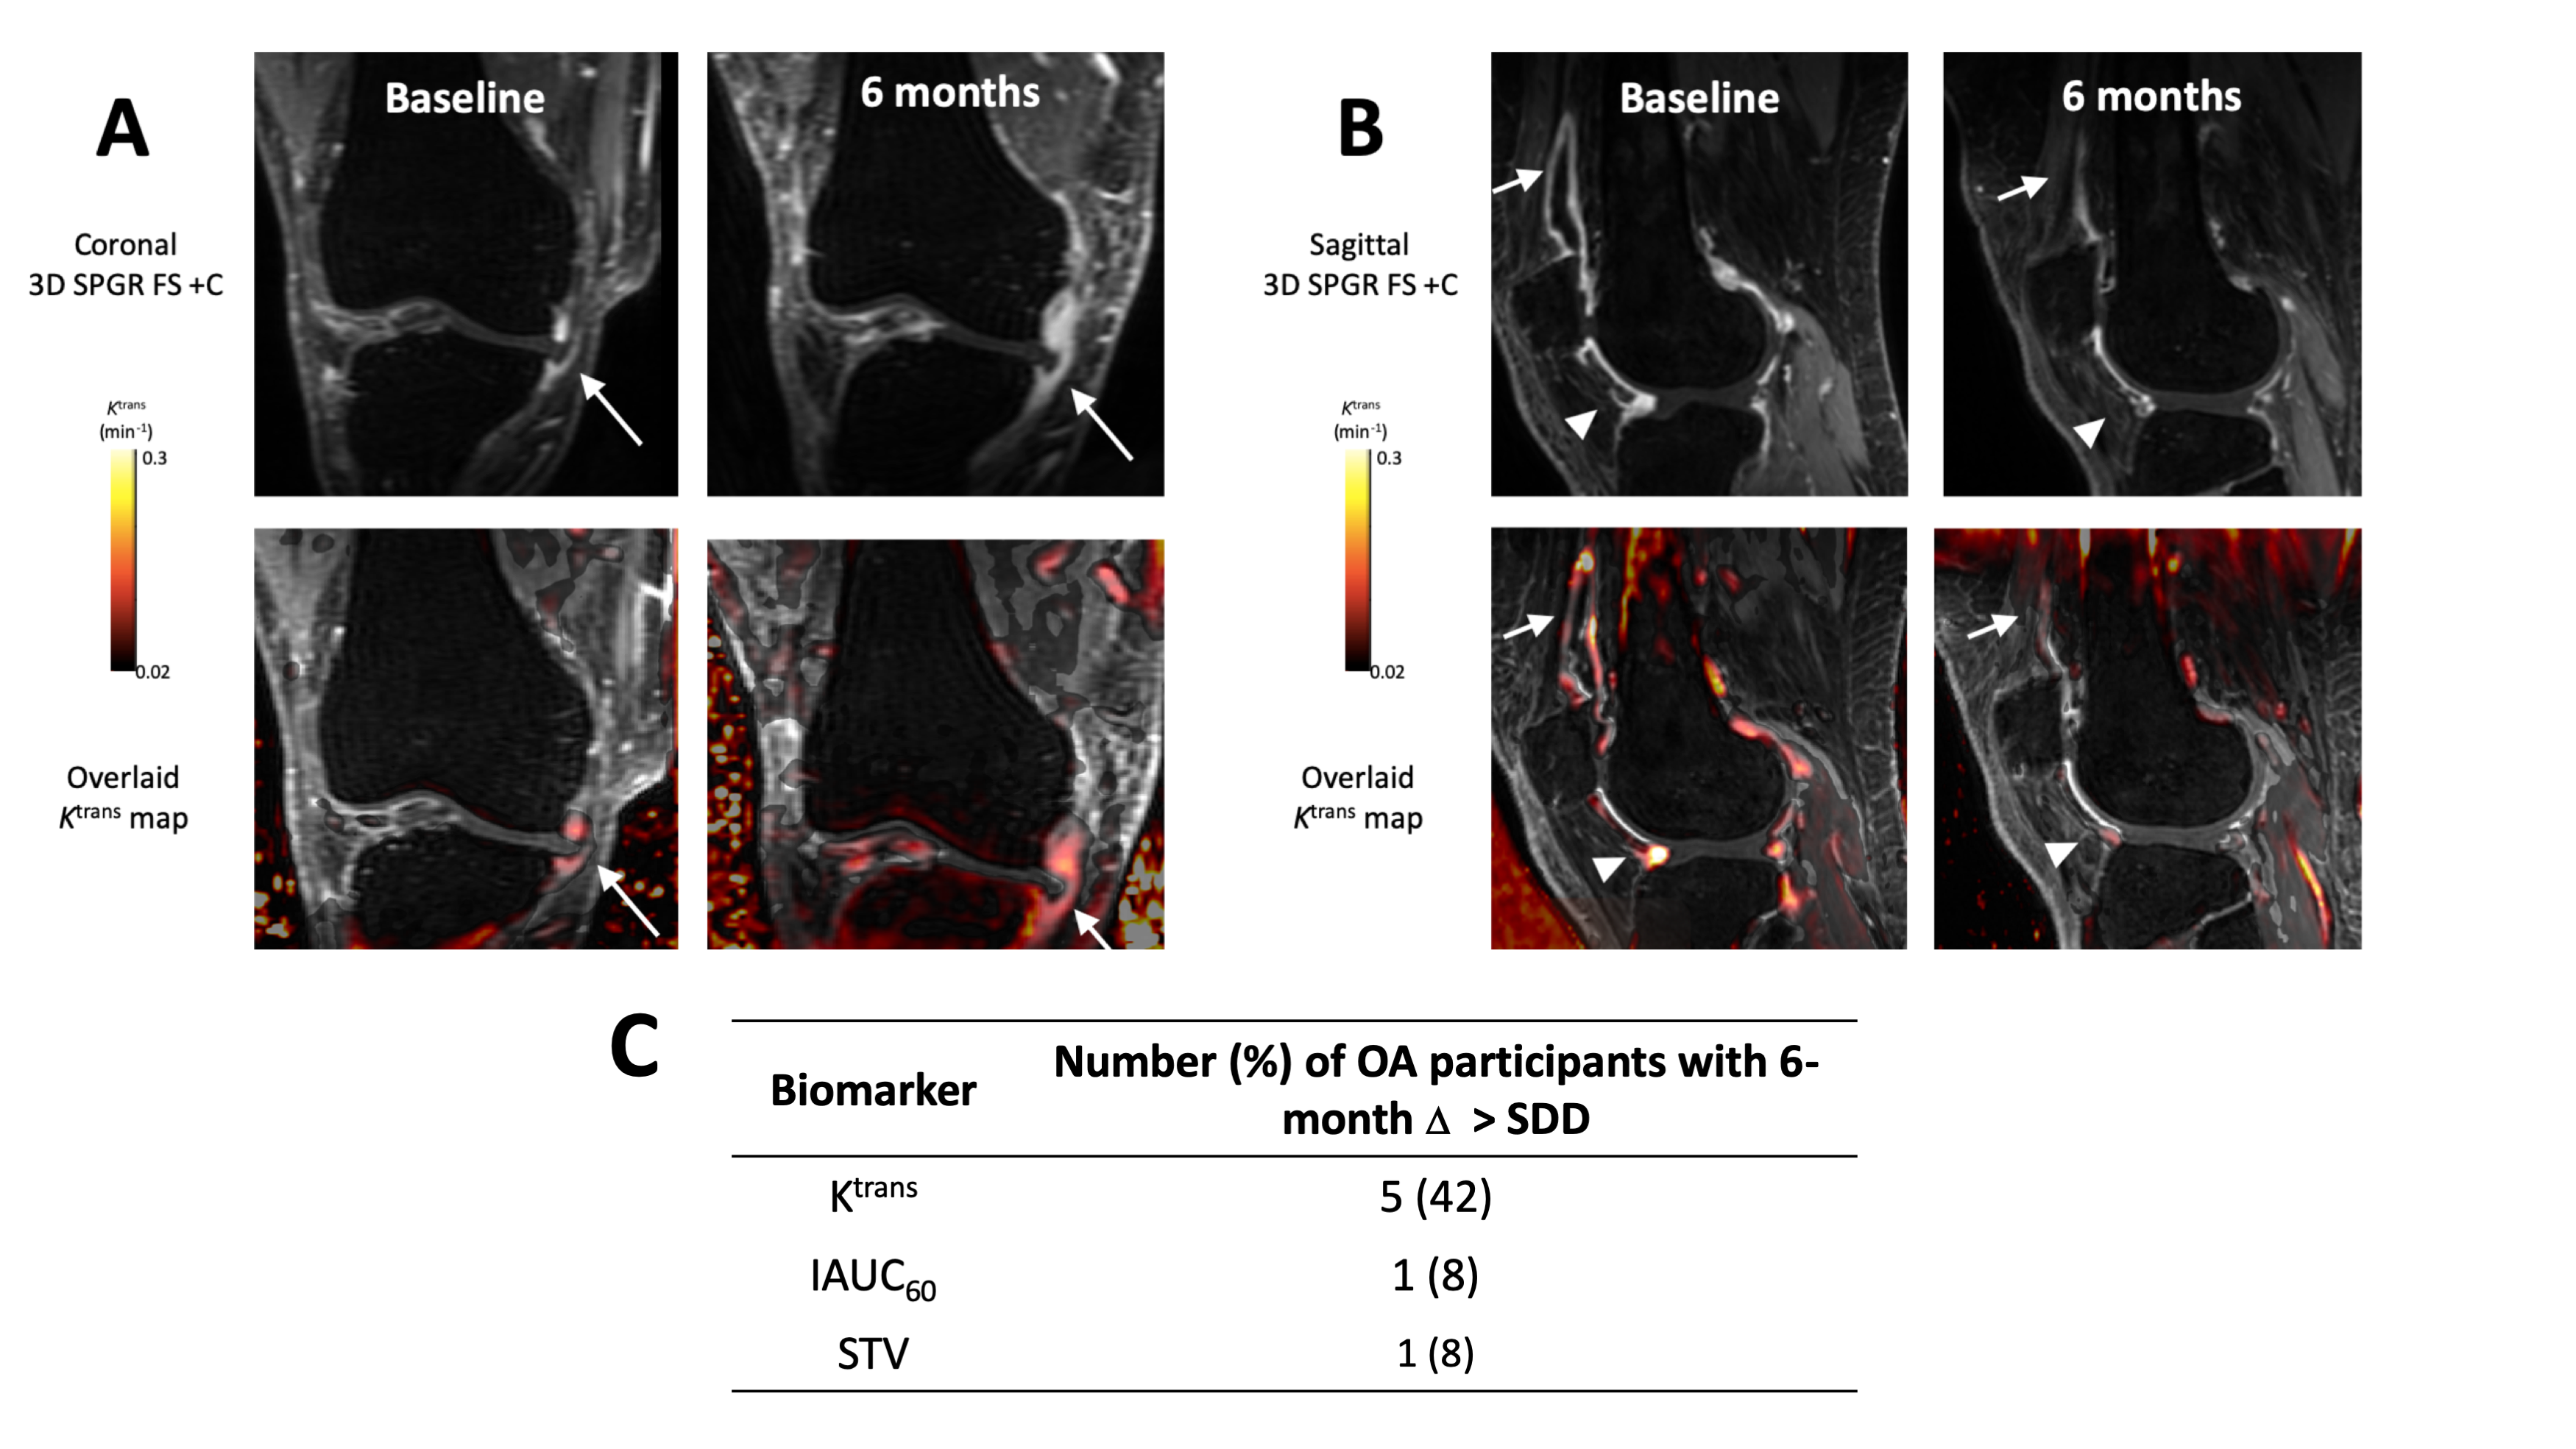
Figure 3: Example post-contrast 3D FS SPGR images overlaid with Ktrans data from participants with significant increases (A) and decreases (B) in Ktrans at 6 months. In (A), note extruded medial meniscus with surrounding synovitis (white arrow). At 6 months, the synovitis has increased in amount and intensity. In (B), note distended suprapatellar pouch (white arrow) and synovitis adjacent to anterior horn of lateral meniscus (white arrowhead) at baseline, with reduction at 6 months. (C) Number of OA participants with 6-month changes greater than the SDD for each DCE-MRI biomarker.