2693
PSEUDO-CT IMAGE GENERATION FROM MULTIPLE ECHO TIME 7 TESLA MR DATA VIA GAUSSIAN MIXTURE MODELLING1University of Queensland, Brisbane, Australia
Synopsis
With the increasing introduction of new PET-MR systems, MRI-based methods for pseudo-CT image generation for PET attenuation correction have to be made widely applicable. Existing methods requiring prior anatomical information for estimating CT values form MR signals have been shown to perform poorly, especially in patients. Ultrashort echo time (UTE) MR data has shown some promise, as it is sensitive to tissue classes captured in CT images. We applied existing MR-based methods and a new Gaussian mixture model approach relying on multi-echo MR magnitude and phase data for pseudo-CT image generation. The Gaussian mixture modelling method outperformed other methods investigated.
Introduction
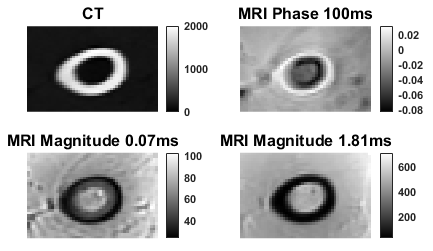
PET imaging requires attenuation correction (AC) to ensure accurate quantification of tracer uptake and the gold standard is to derive the AC maps from CT images [1]. However, the adoption of hybrid PET-MR systems requires the development of new MRI-based methods for generating CT images for PET attenuation correction [2]. Methods proposed in this regime could be classified as: template-based, atlas-based, segmentation-based and sequence-based approaches [3, 4]. The first three classes of methods have difficulty incorporating patient-specific anatomical variabilities and pathologies [2, 5-9]. The sequence-based methods rely on multiple types of sequences along with UTE sequences to visualize regions having very short relaxation times and is able to differentiate bone from air without additional anatomical information [2, 10-14]. Tissues produce distinctive set of multi-echo MR complex signals depending on the proton density and relaxation times associated with the tissue under study [15] (see Figure 1). As such, we examined the utility of Gaussian mixture modelling (GMM) applied to gradient recalled echo (GRE) MR magnitude, ultrashort echo time MR phase and complex images, to produce pseudo-CT images.Methods
A lamb leg, vacuum packed and at room temperature, was used in the study. The CT data was acquired using a Siemens Biograph Horizon PET-CT large bore instrument using the following parameters: 130 kVp, 100 mAs and 0.75mm slice thickness, 0.35mm in-plane resolution and 512 x 512 x 276 acquisition matrix.Multi-echo 3D GRE-MR flow-compensated data was collected using a whole-body 7T MRI research scanner (Siemens Healthcare, Erlangen, Germany) equipped with a 32-channel head coil (Nova Medical, Wilmington, USA). The following data acquisitions parameters were set: TE = 1.81ms, TR = 25ms, flip angle = 13o, voxel size = 1mm x 1 mm x 1mm and matrix size = 182 x 210 x 160. We acquired PETRA (i.e. pointwise encoding time reduction with radial acquisition) data using a work-in-progress sequence with the following parameters: TE = 0.07 and 0.1ms, TR = 1.99ms, flip angle = 2o, voxel size = 1mm x 1mm x 1mm and matrix size = 288 x 288 x 288. The combined phase image was generated using the virtual reference coil method [16]. Images of tissue phase were calculated from combined phase images using V-SHARP implemented in STI Suite [17, 18]. All scripts were implemented in MATLAB® (MathWorks Inc., MA, USA).
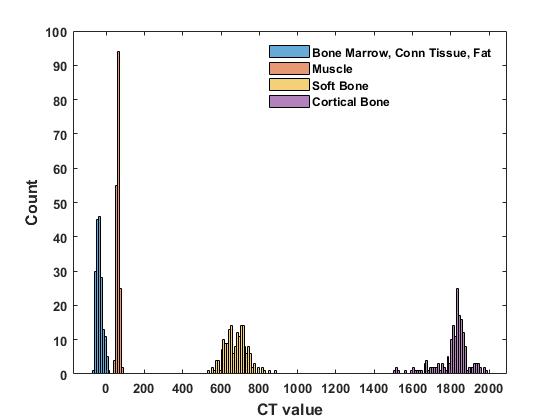
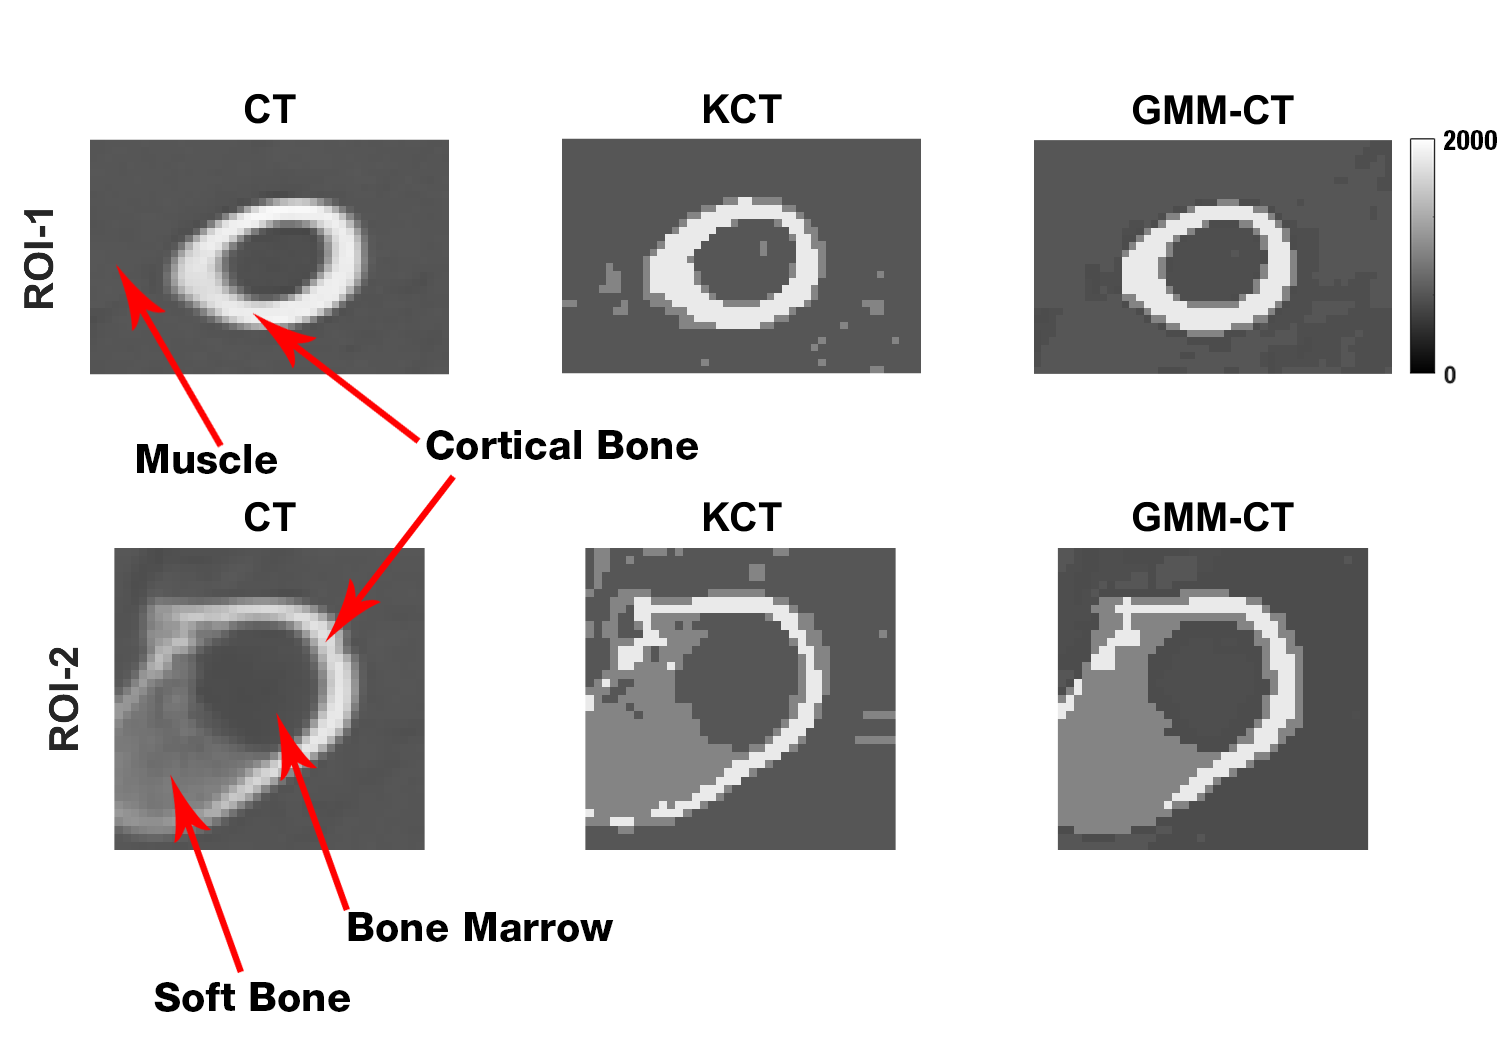
The tissue types were classified into four classes in the ascending order of their average CT (Hounsfield units - HU) values derived from the CT image (Figure 2):
- Class 1: Bone marrow, connective tissue and fat (-40 HU)
- Class 2: Muscle (63 HU)
- Class 3: Soft bone (603 HU)
- Class 4: Cortical bone (1797 HU)
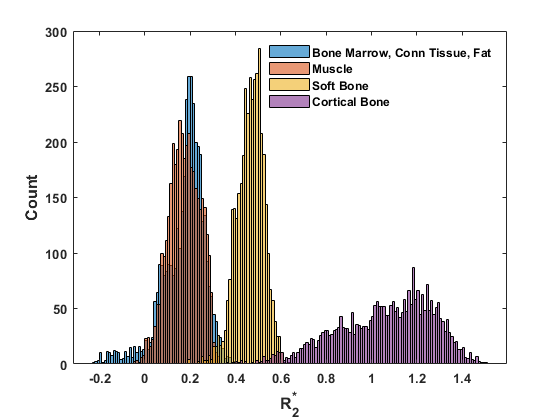
Keereman et al. proposed discrimination of different tissue types based on the parameter defined as [13, 14, 19]:
$$R^{*}_{2}=\frac{ln(M_{1})- ln(M_{2})}{T_{E2}-T_{E1}}$$
where,$$$M_{1}$$$ and $$$M_{2}$$$ are magnitude image intensities at echo times $$$T_{E1}$$$ (0.07ms) and $$$T_{E2}$$$ (1.81ms), respectively. The following mappings were used to produce a 3-class pseudo-CT image (from now on referred to as KCT):
$$KCT = 63, R^{*}_{2}<0.36(Soft\ tissue)\\\quad \quad \quad \quad \; \; \: = 603, 0.6>R^{*}_{2}>0.36(Soft \ bone)\\\quad \quad \quad \; \; \: = 1797, R^{*}_{2}>0.6(Cortical\ bone)\\$$
GMM-CT Generation
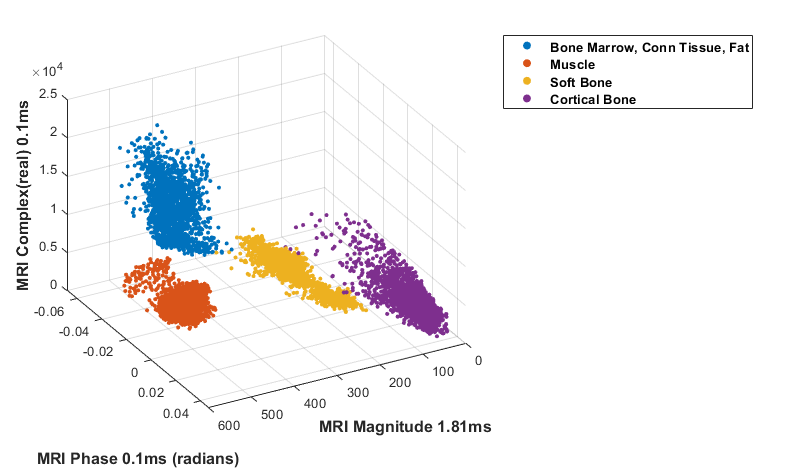
Distributions of PETRA (0.1ms) phase and complex (0.1ms, real) and GRE (1.81ms) magnitude values for tissue classes were expressed as:
$$P_{np}(p)=\frac{\sum_{j=1}^Ns_{j}G_{(\mu_{j},\sigma_{j})}(p)}{\sum_{j=1}^Ns_{j}}$$
where $$$P_{np}$$$ defines the Gaussian mixture corresponding with the phase $$$(p)$$$ value distribution of tissue class $$$n$$$ , $$$G$$$ represents a probability density function of the standard normal distribution with mean $$$\mu$$$ and standard deviation $$$\sigma$$$ , and $$$s_{j}$$$ are scalar weights. Similar expressions $$$P_{nr} $$$ and $$$P_{nm}$$$ were defined for the distribution of PETRA real part $$$(r)$$$ and GRE magnitude $$$(m)$$$ values. The probability map for each tissue class $$$n$$$ for voxel located at $$$(x,y,z)$$$ was calculated as
$$PM_{n}(x,y,z)=P_{np}(p_{(x,y,z)})*P_{nr}(r_{(x,y,z)})*P_{nm}(m_{(x,y,z)})$$
To produce the pseudo-CT image (hereon GMM-CT), voxel at location $$$(x,y,z)$$$ was assigned the average CT value of the tissue class having the highest $$$PM(x,y,z)$$$ value.
Results
Multi-echo MR complex signals and values (Figures 3 and 4) for four tissue classes were studied. A pseudo-CT image generation method using four tissue class GMM of multi-echo MR complex signals was proposed and its performance was compared to that of based method. Figure 5 shows CT, KCT and GMM-CT images for two distinct regions in the lamb leg. The mean error between CT (i.e. ground truth) and KCT values was 67 HU and between CT and GMM-CT was 45 HU. As for assigning the tissue class to a voxel, KCT was 93.2% accurate, which in the case of GMM-CT increased to 99.8% accuracy.Discussion
Our proposed method uses three stochastic variables per tissue class, which is much less than the 16 variables per class proposed by Johanssen et al [12]. Keereman et al demonstrated the performance of KCT using a three and four class approach on human lungs, and soft bone was not considered. In comparison to KCT, GMM-CT images were more accurate in identifying soft bone. The results suggest GMM-CT is potentially applicable on human data.Conclusion
We have demonstrated proof-of-concept of utilizing ultra-high field MR magnitude and phase images for pseudo-CT image production with potential wide application in PET-MR systems.Acknowledgements
No acknowledgement found.References
[1] P. E. Kinahan, B. H. Hasegawa, and T. Beyer, "X-ray-based attenuation correction for positron emission tomography/computed tomography scanners," in Seminars in nuclear medicine, 2003, pp. 166-179.
[2] G. Wagenknecht, H.-J. Kaiser, F. M. Mottaghy, and H. Herzog, "MRI for attenuation correction in PET: methods and challenges," Magnetic resonance materials in physics, biology and medicine, vol. 26, pp. 99-113, 2013.
[3] H. Zaidi, M. L. Montandon, and D. O. Slosman, "Magnetic resonance imaging‐guided attenuation and scatter corrections in three‐dimensional brain positron emission tomography," Medical physics, vol. 30, pp. 937-948, 2003.
[4] A. Martinez-Möller, M. Souvatzoglou, G. Delso, R. A. Bundschuh, C. Chefd'hotel, S. I. Ziegler, et al., "Tissue classification as a potential approach for attenuation correction in whole-body PET/MRI: evaluation with PET/CT data," Journal of nuclear medicine, vol. 50, pp. 520-526, 2009.
[5] E. R. Kops and H. Herzog, "Alternative methods for attenuation correction for PET images in MR-PET scanners," in Nuclear Science Symposium Conference Record, 2007. NSS'07. IEEE, 2007, pp. 4327-4330.
[6] E. R. Kops and H. Herzog, "Template based attenuation correction for PET in MR-PET scanners," in Nuclear Science Symposium Conference Record, 2008. NSS'08. IEEE, 2008, pp. 3786-3789.
[7] I. Bezrukov, F. Mantlik, H. Schmidt, B. Schölkopf, and B. J. Pichler, "MR-based PET attenuation correction for PET/MR imaging," in Seminars in nuclear medicine, 2013, pp. 45-59.
[8] M. Hofmann, I. Bezrukov, F. Mantlik, P. Aschoff, F. Steinke, T. Beyer, et al., "MRI-based attenuation correction for whole-body PET/MRI: quantitative evaluation of segmentation-and atlas-based methods," Journal of Nuclear Medicine, vol. 52, pp. 1392-1399, 2011.
[9] M. Hofmann, B. Pichler, B. Schölkopf, and T. Beyer, "Towards quantitative PET/MRI: a review of MR-based attenuation correction techniques," European journal of nuclear medicine and molecular imaging, vol. 36, pp. 93-104, 2009.
[10] Y. Berker, J. Franke, A. Salomon, M. Palmowski, H. C. Donker, Y. Temur, et al., "MRI-based attenuation correction for hybrid PET/MRI systems: a 4-class tissue segmentation technique using a combined ultrashort-echo-time/Dixon MRI sequence," Journal of nuclear medicine, vol. 53, pp. 796-804, 2012.
[11] C. Catana, A. van der Kouwe, T. Benner, C. J. Michel, M. Hamm, M. Fenchel, et al., "Toward implementing an MRI-based PET attenuation-correction method for neurologic studies on the MR-PET brain prototype," Journal of Nuclear Medicine, vol. 51, pp. 1431-1438, 2010.
[12] A. Johansson, M. Karlsson, and T. Nyholm, "CT substitute derived from MRI sequences with ultrashort echo time," Medical physics, vol. 38, pp. 2708-2714, 2011.
[13] V. Keereman, Y. Fierens, T. Broux, Y. De Deene, M. Lonneux, and S. Vandenberghe, "MRI-based attenuation correction for PET/MRI using ultrashort echo time sequences," Journal of nuclear medicine, vol. 51, pp. 812-818, 2010.
[14] V. Keereman, S. Vandenberghe, Y. De Deene, R. Luypaert, T. Broux, and I. Lemahieu, "MR-based attenuation correction for PET using an Ultrashort Echo Time (UTE) sequence," in Nuclear Science Symposium Conference Record, 2008. NSS'08. IEEE, 2008, pp. 4656-4661.
[15] M. Hofmann, F. Steinke, V. Scheel, G. Charpiat, J. Farquhar, P. Aschoff, et al., "MRI-based attenuation correction for PET/MRI: a novel approach combining pattern recognition and atlas registration," Journal of nuclear medicine, vol. 49, pp. 1875-1883, 2008.
[16] D. L. Parker, A. Payne, N. Todd, and J. R. Hadley, "Phase reconstruction from multiple coil data using a virtual reference coil," Magnetic Resonance in Medicine, vol. 72, pp. 563-569, 2014.
[17] S. M. Smith, M. Jenkinson, M. W. Woolrich, C. F. Beckmann, T. E. Behrens, H. Johansen-Berg, et al., "Advances in functional and structural MR image analysis and implementation as FSL," Neuroimage, vol. 23, pp. S208-S219, 2004.
[18] W. Li, A. V. Avram, B. Wu, X. Xiao, and C. Liu, "Integrated Laplacian‐based phase unwrapping and background phase removal for quantitative susceptibility mapping," NMR in Biomedicine, vol. 27, pp. 219-227, 2014.
[19] V. Keereman, C. Vanhove, and S. Vandenberghe, "MRI‐Based Attenuation Correction for Emission Tomography using Ultrashort Echo Time Sequences," eMagRes, 2007.
Figures