2688
Ideal Weighting Parameter for Non-Contrast Detection of Synovitis Using Diffusion-Weighted DESS1Radiology, Stanford University, Stanford, CA, United States, 2Department of Radiology, University of Cambridge, Cambridge, United Kingdom, 3Department of Mechanical Engineering, University of Saskatchewan, Saskatoon, SK, Canada
Synopsis
Non-contrast diffusion-weighted double echo steady state (DESS) imaging has been proposed as an alternative to T1-weighted contrast-enhanced MRI for the evaluation of synovitis. We investigated various weighting values (β) for hybrid image creation from the weighted difference between echos of the DESS sequence in order to null joint fluid and enhance visualization of the synovium. We found that the extended phase graph (EPG) model provided the best β for low diffusion weighted DESS and fluid ROI mean suppression (FRMS) provided the best β for high diffusion DESS. Both methods showed potential for non-contrast evaluation of synovitis for routine knee scanning.
Introduction
Synovitis, inflammation of the synovial membrane surrounding synovial fluid, is a common finding in osteoarthritis. Synovitis is typically assessed using T1-weighted contrast-enhanced MRI (DCE), but it is not commonly included in clinical imaging due to cost, imaging time, and potential toxicity. Non-contrast diffusion-weighted imaging using a modified double echo steady state (DESS) sequence has been proposed as an alternative for the assessment of synovitis1,2. This method uses a weighting parameter (β) to null joint fluid through a linear combination of the two DESS echoes. This study aims to determine the ideal β value to null joint fluid and enhance visualization of the synovium using diffusion-weighted DESS.Methods
We scanned both knees of ten osteoarthritic patients on a 3T MRI scanner using two modified quantitative DESS (qDESS) sequences. The first sequence contained a high diffusion gradient (DESS High) of 20 cycles/pixel (slice encode direction) while the second contained a low diffusion gradient (DESS Low) of 2 cycles/pixel (slice encode direction). Scan parameters for both scans are included in Table 1. Six β values were then chosen in order to get a wide range of values; Table 2 gives these values, and the methods for determining them are described below. The first β was determined by the Extended Phase Graph (EPG) signal model3,4, using the following values based on previous estimates of synovial fluid2: T1 = 3620 ms; T2 = 767 ms; ADC = 2.6 μm2/ms2. The second β was labeled fluid ROI mean suppression (FRMS), and was determined by creating an ROI in the joint fluid and choosing a β that would null the average value of the fluid to zero according to the following equation: $$${\beta}=\frac{average\: ROI \: signal \:echo\: 1}{average\: ROI\: signal\: echo\: 2}$$$. The third was an average of values found using the EPG and FRMS models (EPG/FRMS Average). The fourth, fifth, and sixth values were chosen by multiplying the β from the EPG model by 0.75, 0.50, and 0.25, respectively, to get a wider range of values. The first and second qDESS echoes were then recombined in MATLAB to make a hybrid image for each β value using linear combination according to the following equation, also described in Figure 1: $$${Echo\: 1}- {\beta}\cdot{Echo\: 2}$$$.Hybrid images were randomized, blinded and then read by 2 radiologists, one who evaluated all 10 subjects and one who evaluated a subset of 3 subjects. Radiologists scored each hybrid image set on a scale from 1 to 5 [Figure 2]; 1 indicating synovial thickening was not distinguishable from joint fluid, 3 indicating synovial thickening was somewhat distinguishable from joint fluid, and 5 indicated synovial thickening was distinguishable from joint fluid.
Results
Figure 3 shows representative hybrid images created for one subject and a reference DCE image. The β values given by the EPG model were 2.8 for DESS High and 1.15 for DESS Low. The mean DESS Low FRMS β value was very similar to the EPG model and showed low variance, at 1.17 ± 0.04. In contrast, the mean DESS High FRMS β value was far from the EPG model and showed higher variance, at 4.14 ± 1.26. Figure 2 shows the mean and standard deviations of radiologist image scores for DESS High and DESS Low hybrid images. DESS Low hybrid images created using EPG, FRMS and EPG/FRMS Average β values showed similar scores (p=1.0) and were significantly higher than the other three β values (p<0.01). For DESS High, hybrid images created using FRMS and EPG/FRMS Average β values showed statistically higher ratings than EPG * 0.75, EPG * 0.50, and EPG * 0.25 (p<0.01) but not EPG (p=1.0).Discussion
Non-contrast qDESS hybrid images created with β values using the EPG model, FRMS, and EPG/FRMS Average were scored favorably by radiologists. This demonstrates the potential for utilizing these techniques for evaluation of synovitis without contrast in routine knee scans. Ideally, the EPG model would be used, as it does not require manual segmentation of a fluid ROI to create hybrid images. Results from the DESS Low scans indicate that the EPG model can be used, as it scored statistically equivalent to FRMS and EPG/FRMS Average, and is also very close in value to the FRMS β as shown in the results. Results from the DESS High scans are less clear, as FRMS and EPG/FRMS Average scored higher than EPG but their use would be less automated or would require new methodology for robust application. We are currently working to compare the diagnostic accuracy and confidence of these images against acquired clinical-standard T1-weighted contrast-enhanced images for assessment of synovitis.Conclusion
Hybrid images using a weighted difference between echos of the DESS sequence showed favorable contrast for evaluation of synovitis. Our results found that the EPG model provided an optimal β value for DESS Low hybrid images while the FRMS method was best for DESS High hybrid images. Both methods showed potential for non-contrast evaluation of synovitis for routine knee scanning.Acknowledgements
This work was funded by grant support from GE Healthcare and NIH grants R01-EB002524-14, NIH K24-AR062068-07, NIH R01-AR063643-05, and NIH R00-EB022634References
1. Fan AP, Fong G, Sveinsson B, et al. Automated, non-contrast MRI for detection of synovitis using diffusion-weighted DESS. Osteoarthritis and Cartilage. 2015;23:A240-A241. doi:10.1016/j.joca.2015.02.447
2. McWalter EJ, Sveinsson B, Oei EH, Robinson WH, Genovese MC, Gold GE, Hargreaves, BA. Non-contrast diffusion-weighted MRI for detection of synovitis using DESS. International Society for Magnetic Resonance in Medicine; 2014; Milan, Italy
3. B.Sveinsson, A.S.Chaudhari, G.E.Gold, B.A.Hargreaves. A simple analytic method for estimating T2 in the knee from DESS. Magnetic Resonance Imaging. 2017;38:63-70. doi:10.1016/j.mri.2016.12.018
4. Matthias Weigel. Extended phase graphs: Dephasing, RF pulses, and echoes ‐ pure and simple. Journal of Magnetic Resonance Imaging. 2015; 41:266-295. doi:10.1002/jmri.24619
Figures
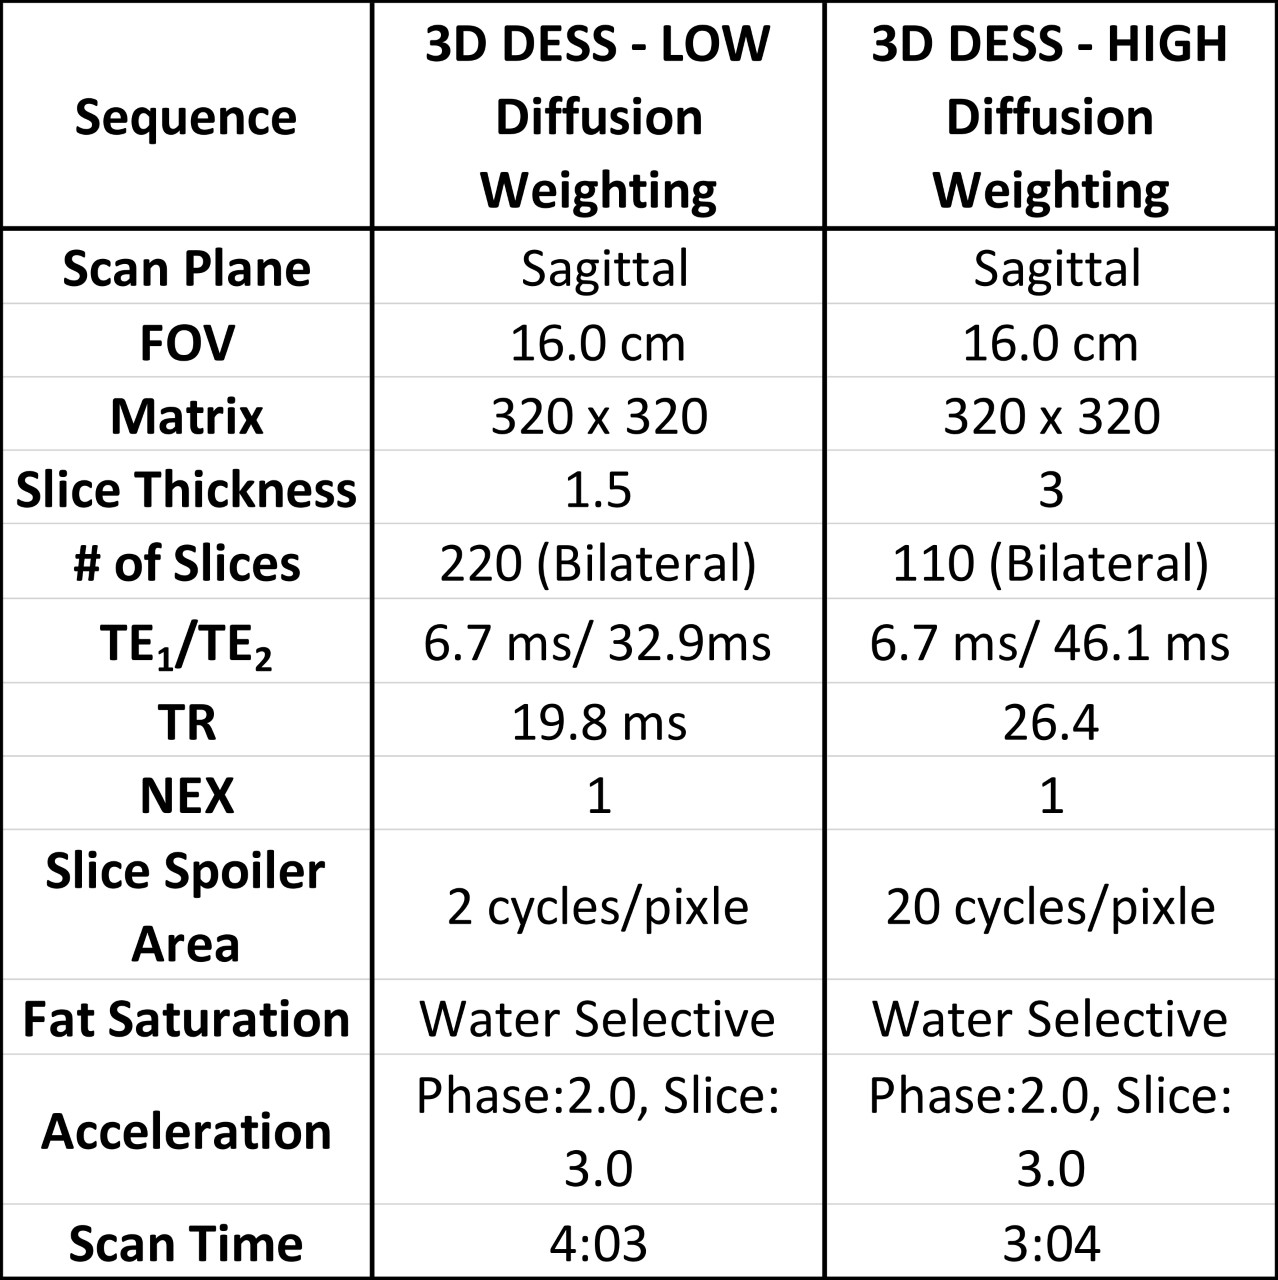
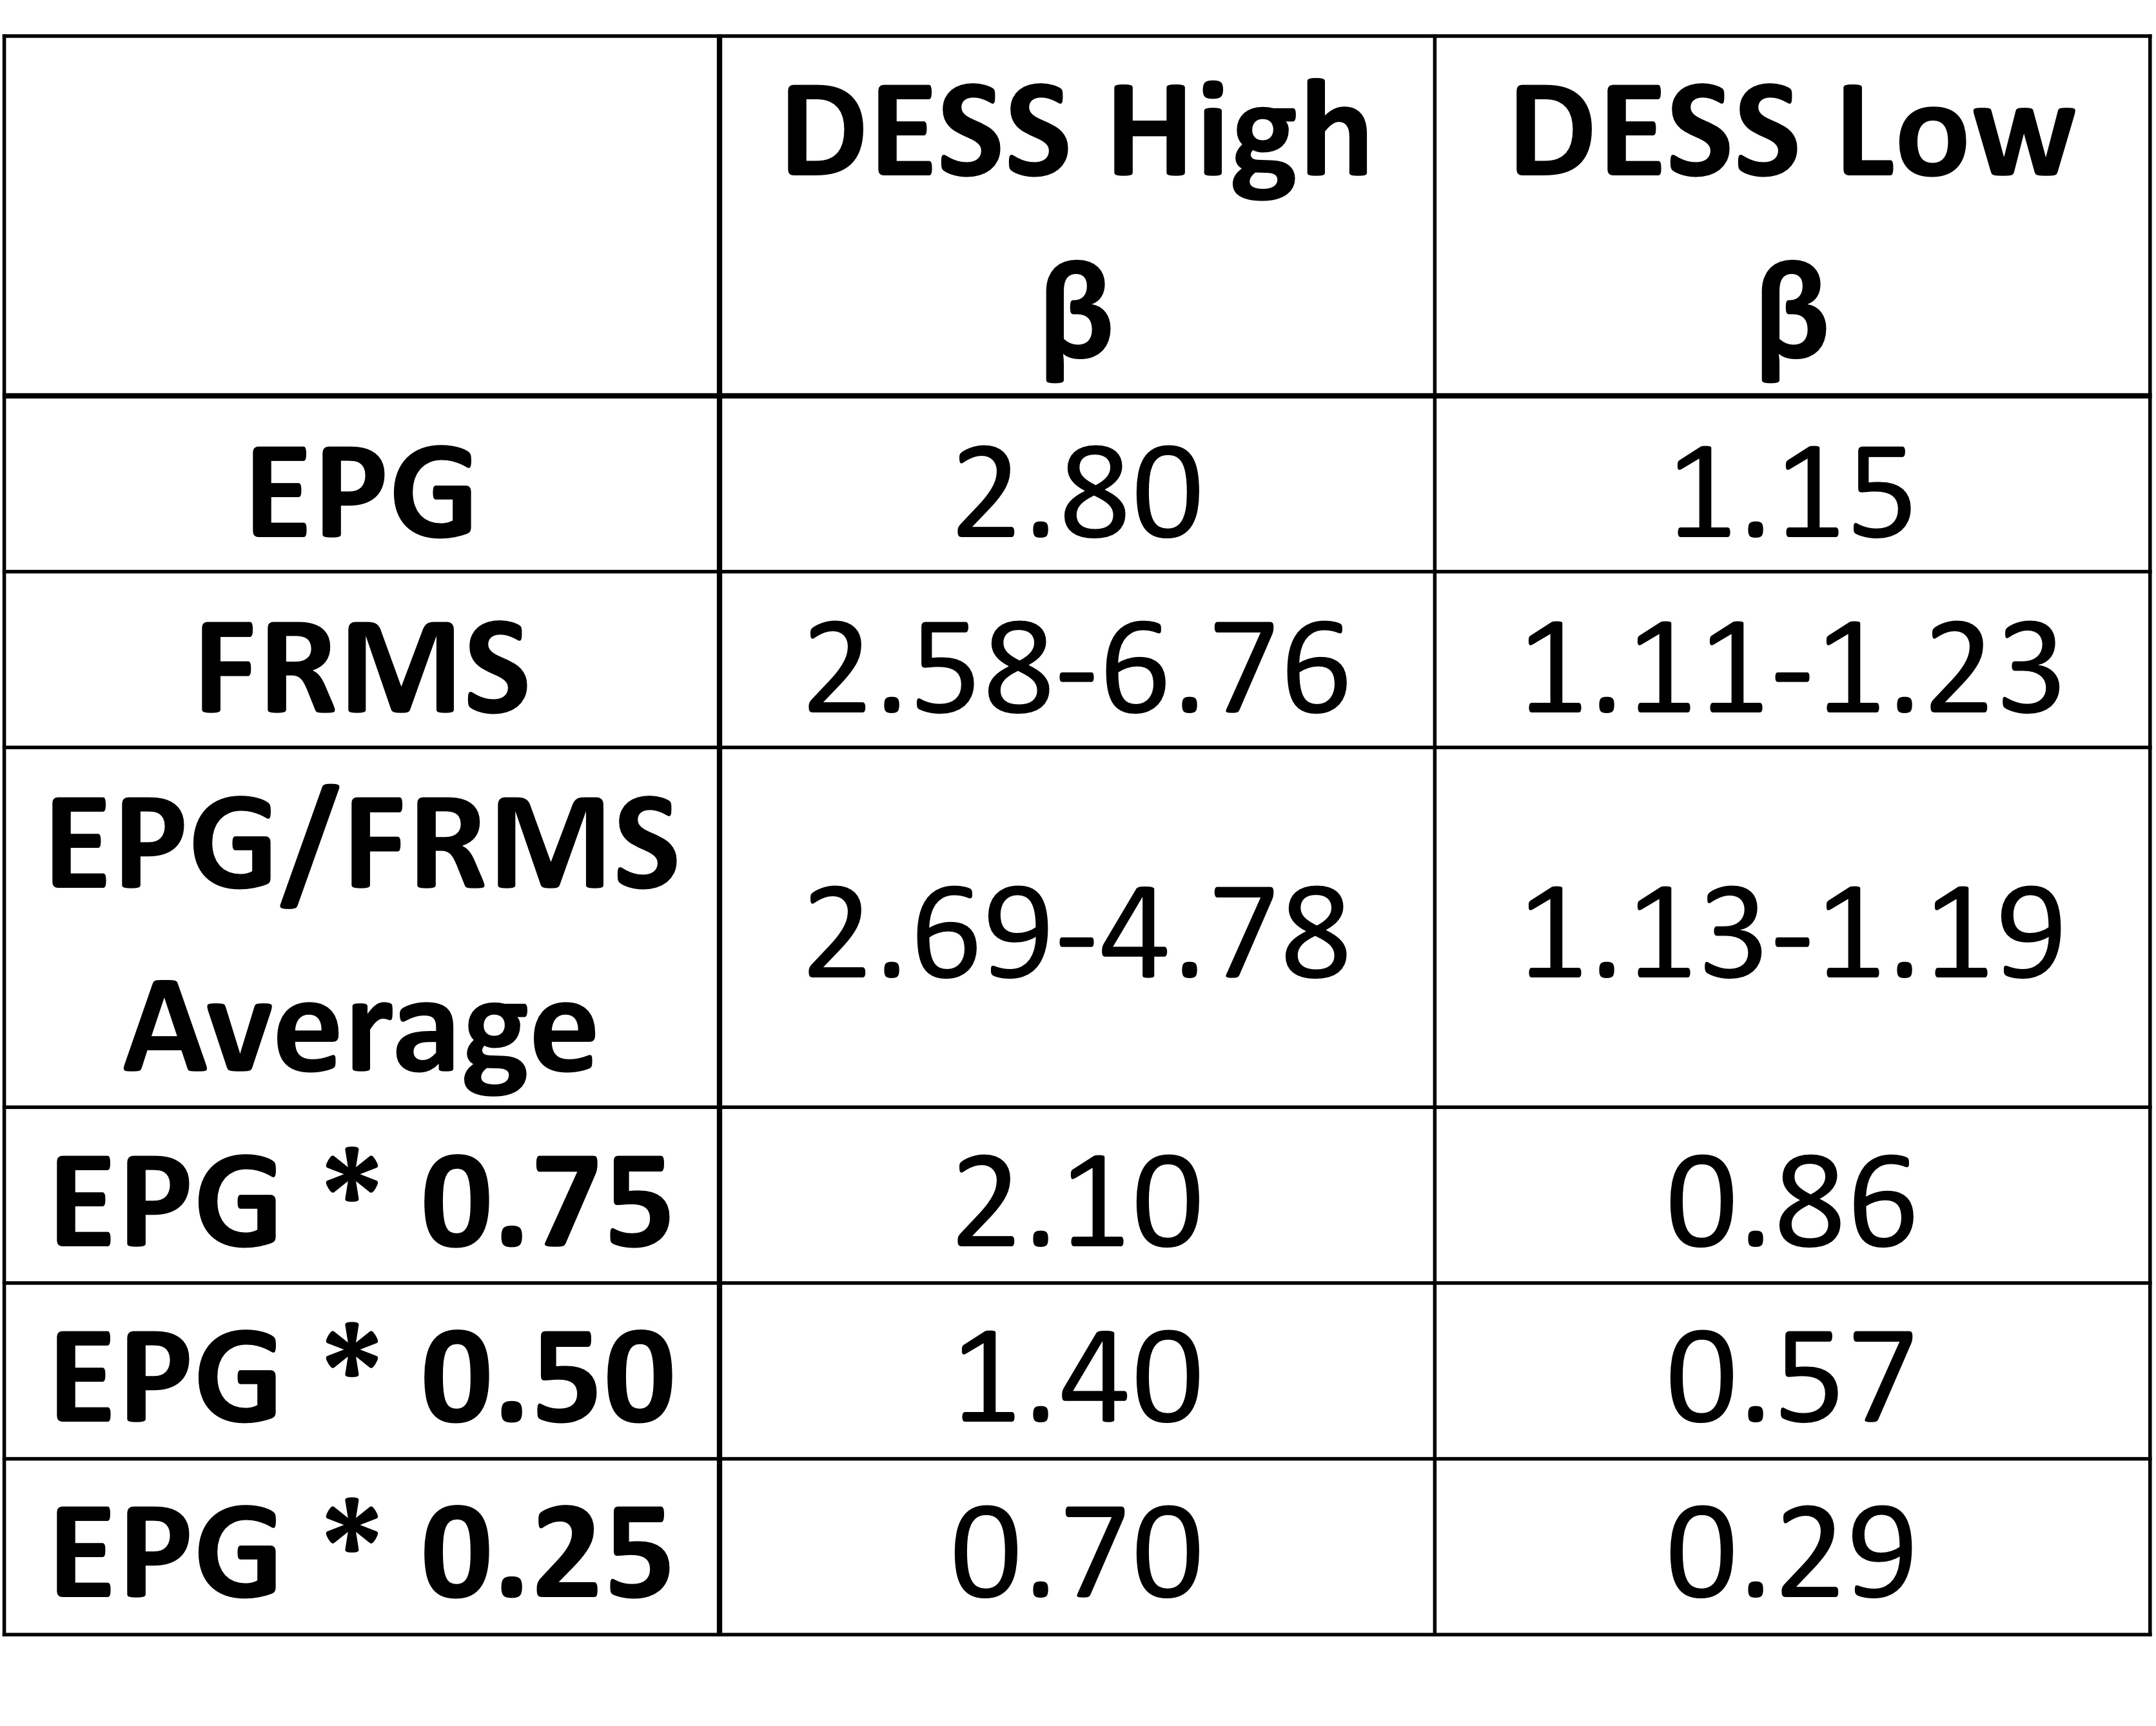
Table 2. β values for high and low diffusion scans. A range is given for the FRMS and average EPG/FRMS, as they vary between subjects, while all others remain constant.
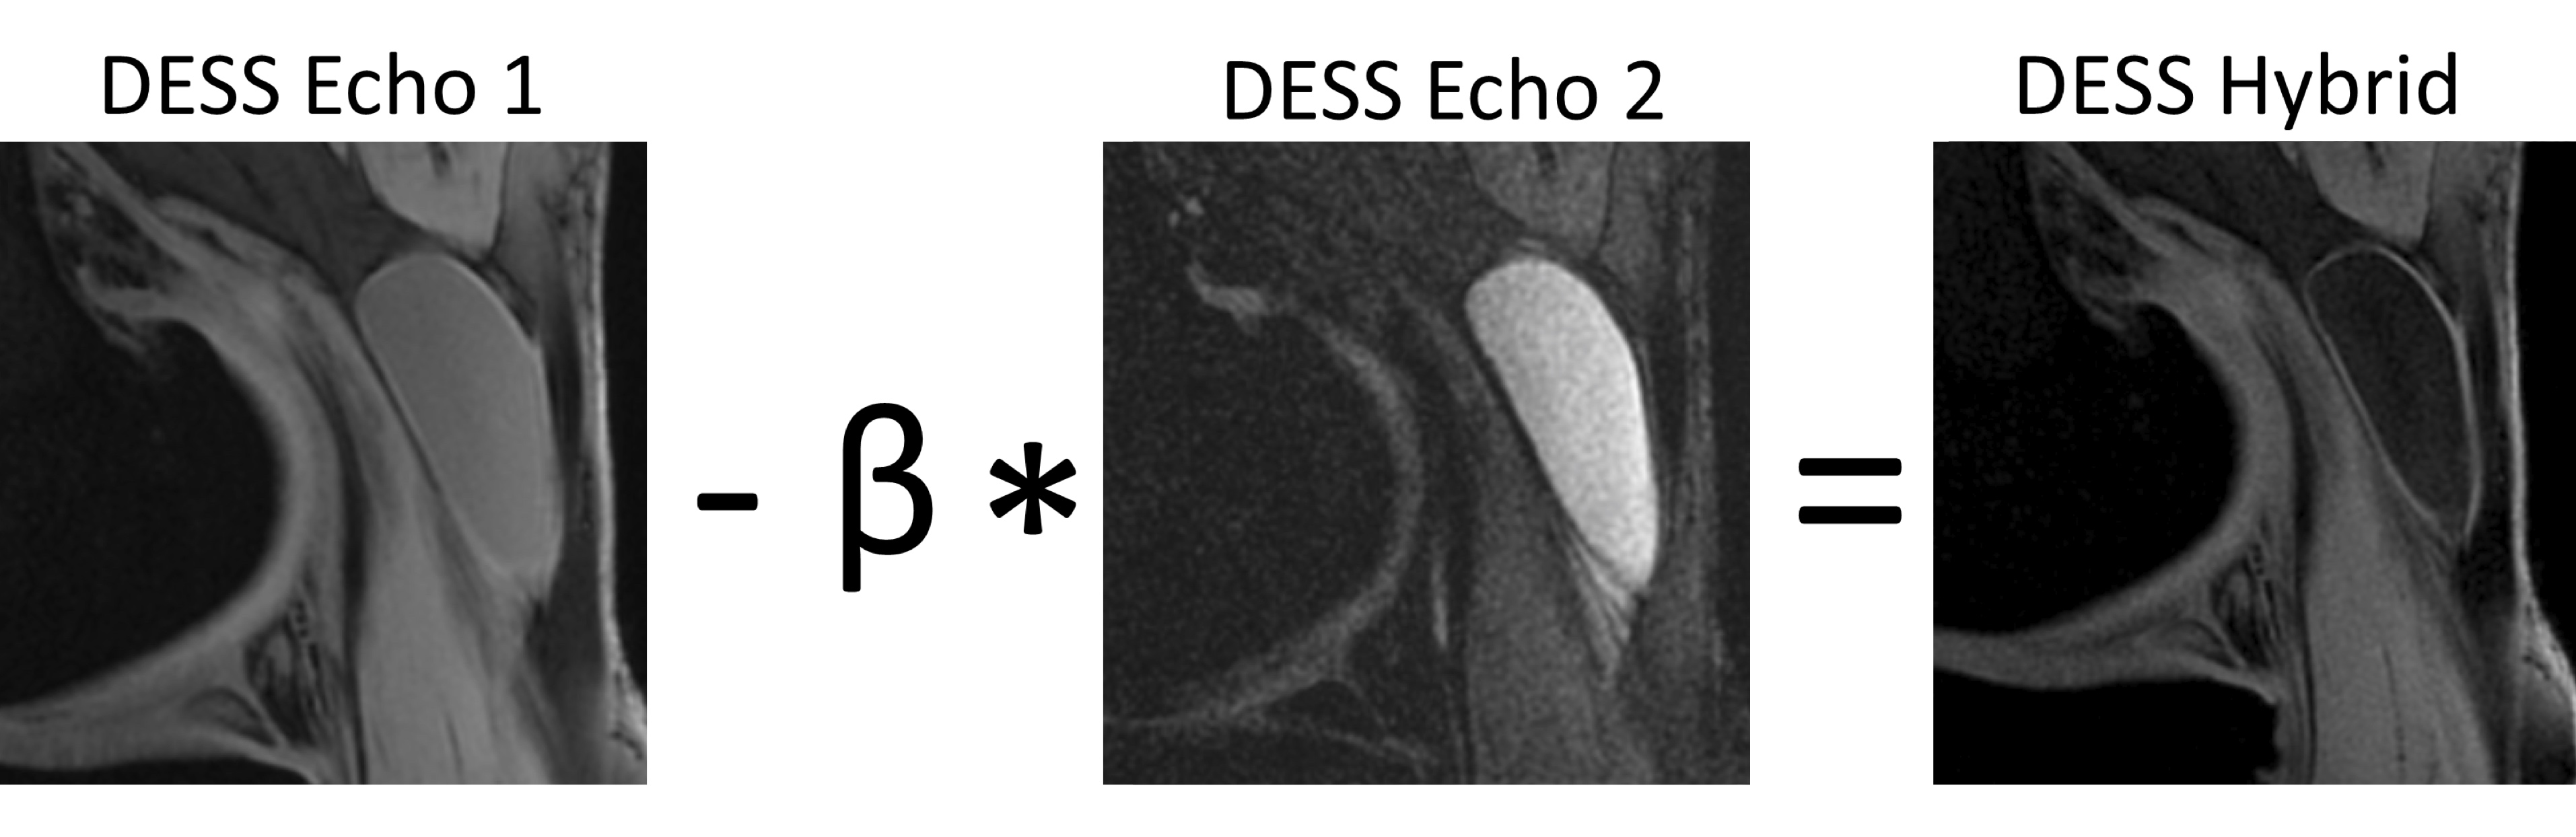
Figure 1: Equation used to create hybrid images. The second DESS echo was multiplied by the chosen β value and then subtracted from the first DESS echo, suppressing fluid.
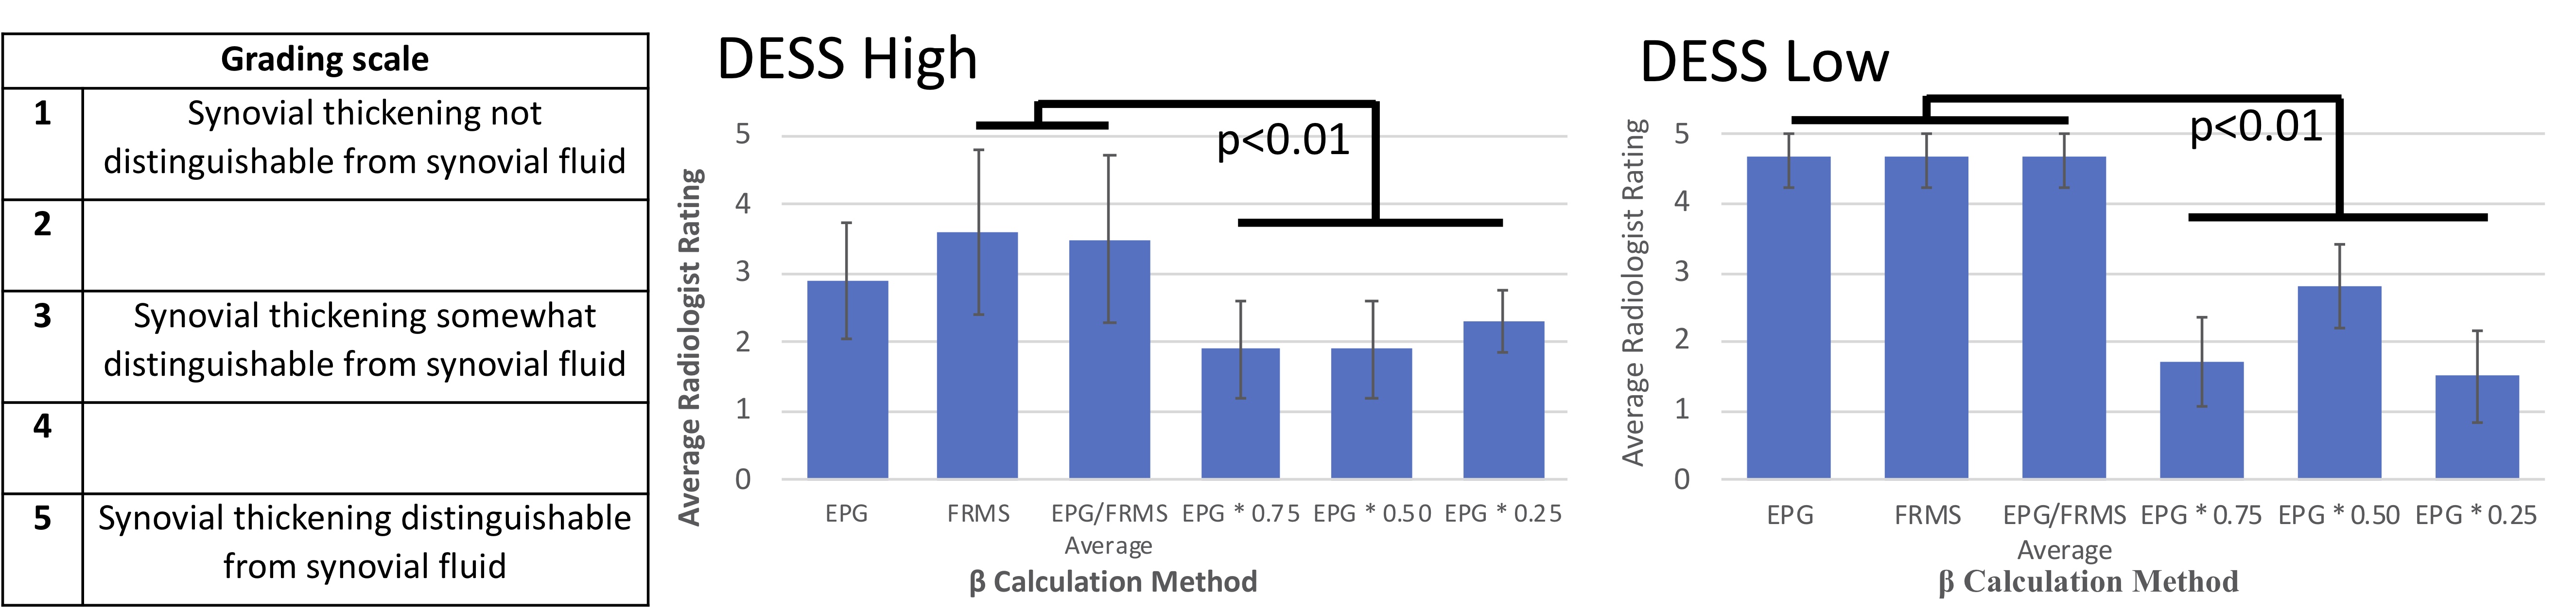
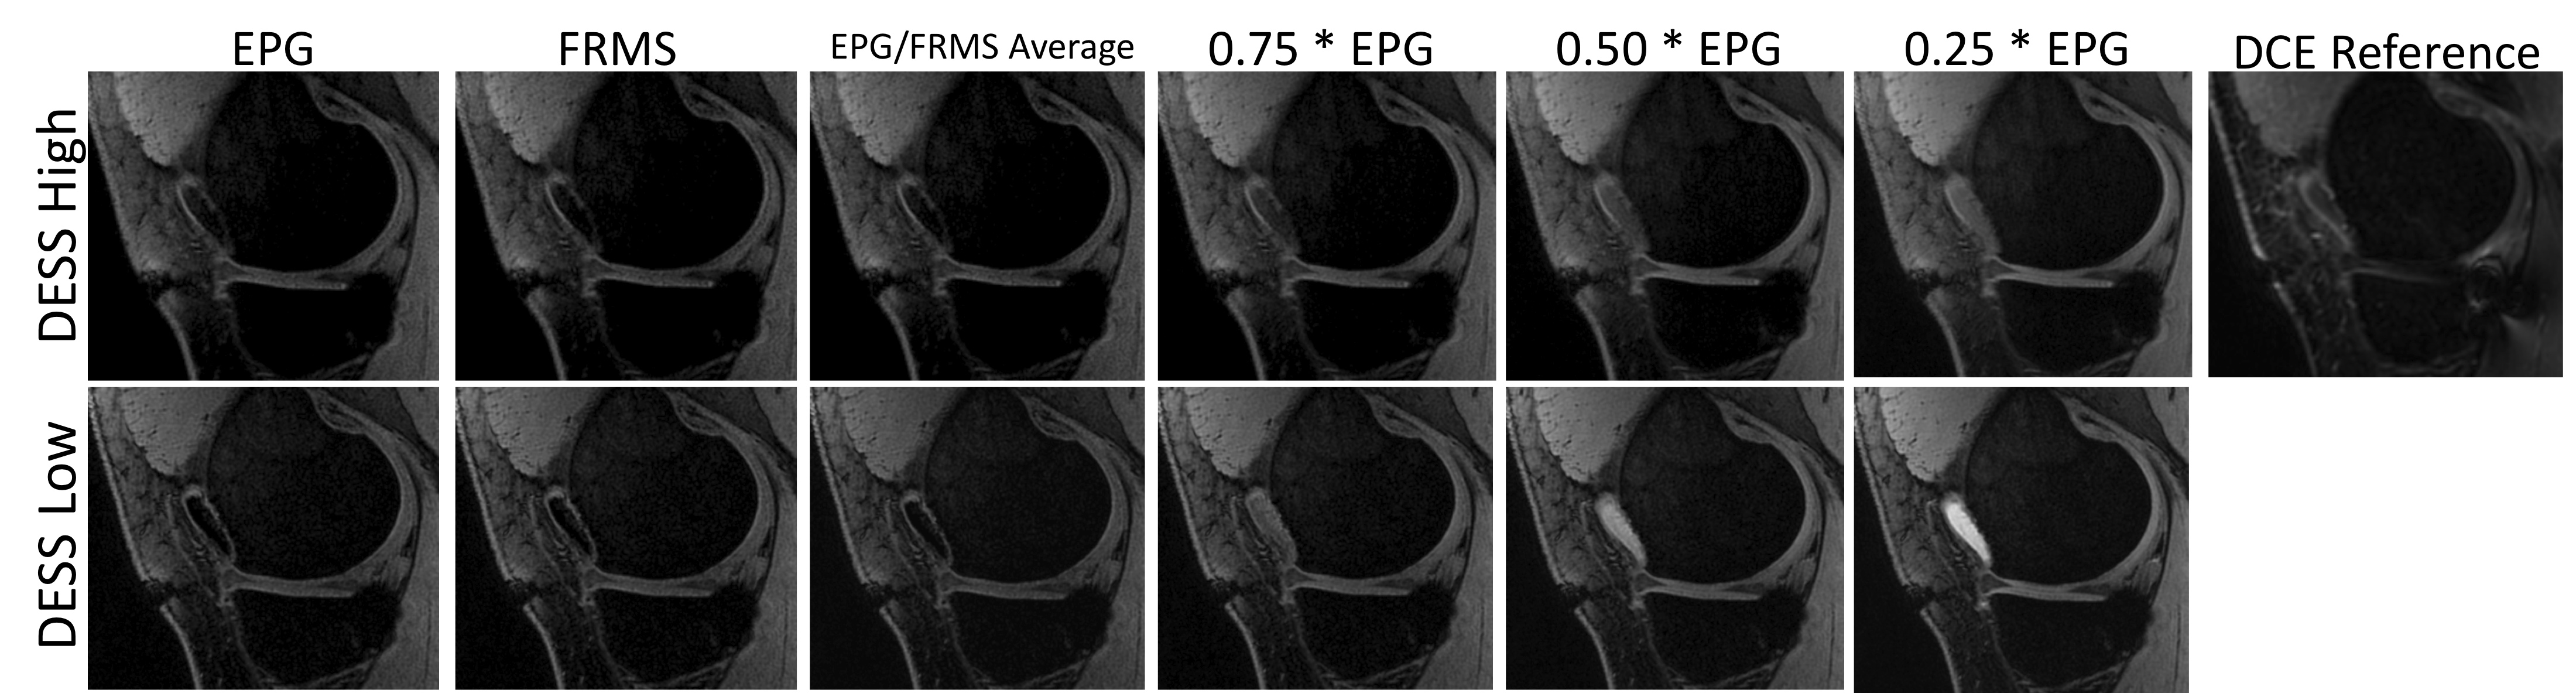
Figure 3. High and low diffusion hybrid images created from one subject with all 6 β values, as well as a reference DCE image. Higher β values show greater fluid suppression than lower values, allowing for easier distinction between the synovium and joint fluid.