2685
T2 Analysis of the Entire Osteoarthritis Initiative Dataset (N=25,729)1Department of Radiology and Biomedical Imaging, University of California, San Francisco, San Francisco, CA, United States, 2Department of Epidemiology and Biostatistics, University of California, San Francisco, San Francisco, CA, United States, 3Center of Digital Health Innovation (CDHI), University of California, San Francisco, San Francisco, CA, United States
Synopsis
Cartilage T2 relaxometry values are previously shown to be correlated to incidence OA, however prognostic ability of T2 is not yet established. In this study, an automatic deep learning method is built using 3921 manually segmented images and T2 was evaluated on entire Osteoarthritis Initiative Dataset (N=25,729). The proposed automatic T2 quantification was shown to be interchangeable with human process and significant association between elevated T2 and future incidence of OA was observed. The results of this study prove the prognostic ability of this compositional MRI technique on the larger sample ever analyzed.
Introduction
Osteoarthritis (OA) is a multifactorial disease that causes joint degeneration, affects 27 million U.S. adults 1,2 and often leads to severe disability3. The etiopathogenesis of OA is characterized by changes in the cartilage extra cellular matrix detectable using T2 mapping technique4. While, widely used in research, the clinical translation of T2 mapping is hampered by the time-consuming manual or semi-automatic cartilage segmentation process, typically used for the analysis. Due to the lack of a well-established fully automatic method, there is limited information on relationships between T2 values and OA risk factors such as age and body weight indexes in larger populations as well as the relationships with symptomatic and radiographic OA. In this study we aim: (i) to build a reliable deep learning model for automatic T2 assessment (ii) to perform a comprehensive analysis of the average T2 values of the 25,729 MRI studies from the entire Osteoarthritis Initiative Dataset (OAI), (iii) to analyze the risk of OA incidence based on changes in T2 values 2 and 4 years in advance.Methods:
Using 3921 manually segmented cases, a model for automatic knee cartilage segmentation was built and evaluated. MRI T2 mapping sequence was a sagittal 2D multi-slice multi-echo (MSME) spin-echo sequence with TR=2700 ms, TEs =10/20/30/40/50/60/70 ms, pixel spacing= [0.313×0.446], slice thickness=3.0. The dataset was randomly split into train, validation and test subsets (65:20:15). The difference between the proportion of male versus female subjects as well as the proportions of subjects with different KL grades were evaluated using a Cochran proportion test. One-way ANOVA was performed to find out if the average age and BMI were different among the data splits. Table 1 reports details on the data splits and demographic and clinical factors splits. V-net5 3D convolutional architecture, optimized with dice loss function, was used for segmentation. The optimized model was then used to segment five cartilage compartments [lateral femur (LF), lateral tibia (LT), medial femur (MT), medial tibia (MT) and Patella (PAT)] on the entire OAI dataset composed of longitudinal acquisitions of 4,796 unique patients over 8 years of follow-up, 25,729 MRI studies in total. T2 relaxation times were calculated at each voxel by fitting an exponential curve to multi-echo signals. Cross-sectional relationships between T2 values, OA risk factors as age, gender BMI, radiographic OA and pain presence were analyzed in the entire OAI dataset. We also explored the relationship of T2 and future incidence of radiographic OA in control subjects. The analysis was done by using the study samples that exhibited faster progression (KL=0,1 at time of imaging and KL>1, 2 years later) and slower progression (KL=0,1 at time of imaging and KL>1, 4 years later).Results:
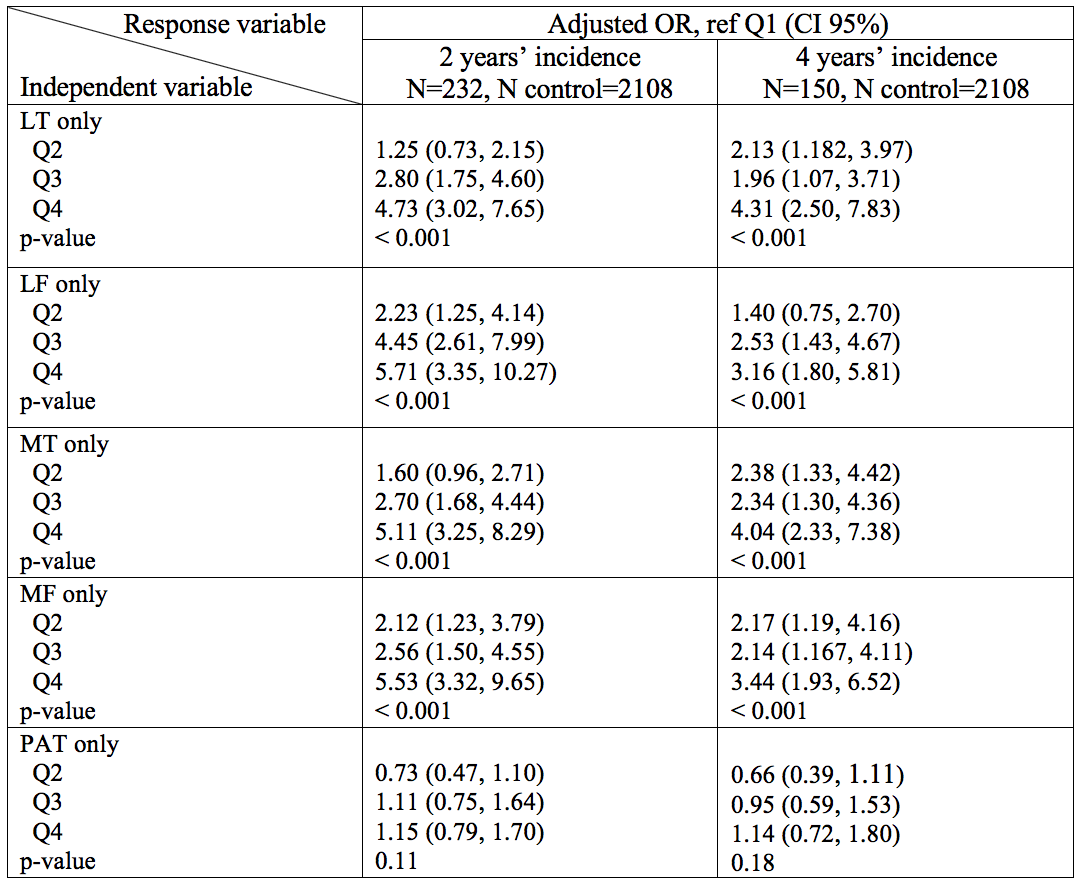
Figure 1 provides an example of automatic vs manual segmentation. Test dice ranged between 0.66 (PAT) to 0.79 (MT). Figure 3 shows the correlation and Bland-Altman plots of errors of automatic segmentation in terms of T2 average calculation. Strong correlations and no biases were observed between manual and automatic method. Our analysis of the entire OAI dataset showed a strong association between the average T values of the LF, MT and MF compartments with age, BMI and sex (Table 2a). T2 values obtained from the PAT compartment showed significant associations with age (coeff=0.07, p=<0.001, CI=(0.06, 0.08)) and BMI (coeff=0.03, p=<0.001, CI=(0.01, 0.04)) and weak associations with sex (coeff=-0.10, p=0.20, CI=(-0.26, 0.05)). Also, females had significantly higher T2 values for all compartments except for MT (Table 2a). Among the five compartments, MF shows the strongest relationship with KOOS pain scores (coeff=-0.35, p=<0.001, CI=(-0.44,-0.25)). While KL is a grade indicative of tibiofemoral OA, stronger association with PAT compartment (coeff =-0.04, p=0.002, CI=(-0.10, 0.02)) and weaker association with LT and MT (Table 2b) were observed. The results of multi-variate logistic regression models showed strong associations between T2 values and future incident radiographic OA among all compartments except for the PAT (Table 3). Odds ratios suggested increasing chances of OA development with increase in T2 values. Patients in the highest 25% quartile for LF (OR=5.71, CI=(3.35, 10.27), p-value=<0.001) , MT (OR=5.11, CI=(3.25, 8.29), p-value=<0.001), and MF (OR=5.53, CI=(3.32, 9.65), p-value=<0.001) had notably higher chance of development of OA after 2 years. The odds ratios were lower for 4 years OA incidence prediction with wider confidence intervals which signals less certainty.Discussion and Conclusion:
In this study we developed a reliable automatic method to evaluate T2 relaxation time measurements and we extracted T2 values from the entire OAI dataset. We tested, for the first time, in a large cohort the hypothesis that T2 values are positively associated with pain and the results show significant relationships for LF, MT and MF when modeling for the whole cohort of subjects. Our model shows significant associations between pain and T2 for MF, LF and LT. Additionally, our model shows that when controlled for other risk factors, high T2 could be an early indication of OA incidence. In conclusion, this study brings new important insights on the role of T2 as a quantitative biomarker for OA as it proves a strong relationship between elevated T2 and future OA incidence in the largest cohort ever analysis.Acknowledgements
This project was supported by R00AR070902 (VP), R61AR073552 (SM/VP) from the National Institute of Arthritis and Musculoskeletal and Skin Diseases, National Institutes of Health, (NIH-NIAMS).References
1. Neogi, T., The epidemiology and impact of pain in osteoarthritis. Osteoarthritis Cartilage, 2013. 21(9): p. 1145-53.
2. Lawrence, R.C., et al., Estimates of the prevalence of arthritis and other rheumatic conditions in the United States. Part II. Arthritis Rheum, 2008. 58(1): p. 26-35.
3. Deshpande, B.R., et al., Number of Persons With Symptomatic Knee Osteoarthritis in the US: Impact of Race and Ethnicity, Age, Sex, and Obesity. Arthritis Care Res (Hoboken), 2016. 68(12): p. 1743-1750.
4. Xia, Y., Magic-angle effect in magnetic resonance imaging of articular cartilage - A review. Investigative Radiology, 2000. 35(10): p. 602-621.
5. Milletari, F., N. Navab, and S.A. Ahmadi, V-Net: Fully Convolutional Neural Networks for Volumetric Medical Image Segmentation. Proceedings of 2016 Fourth International Conference on 3d Vision (3dv), 2016: p. 565-571.
Figures
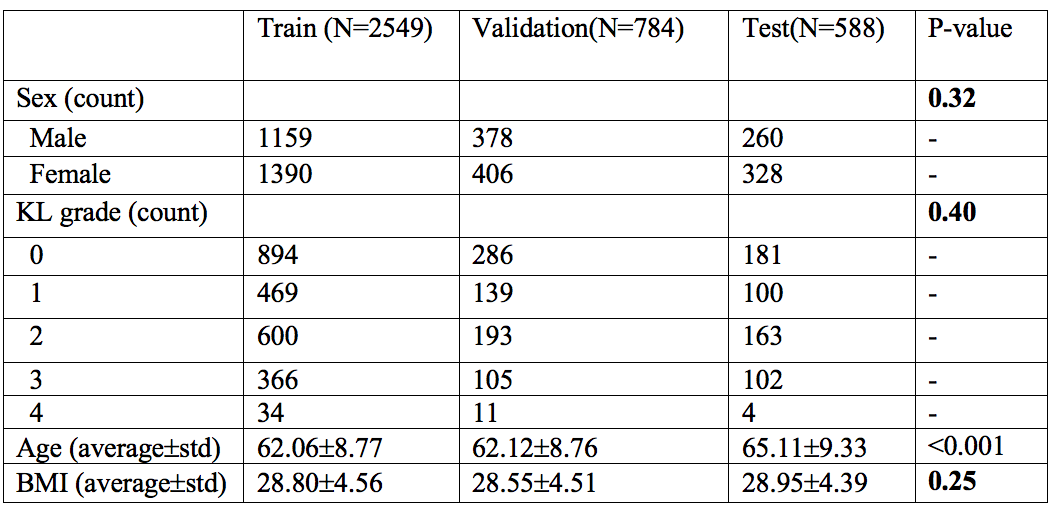
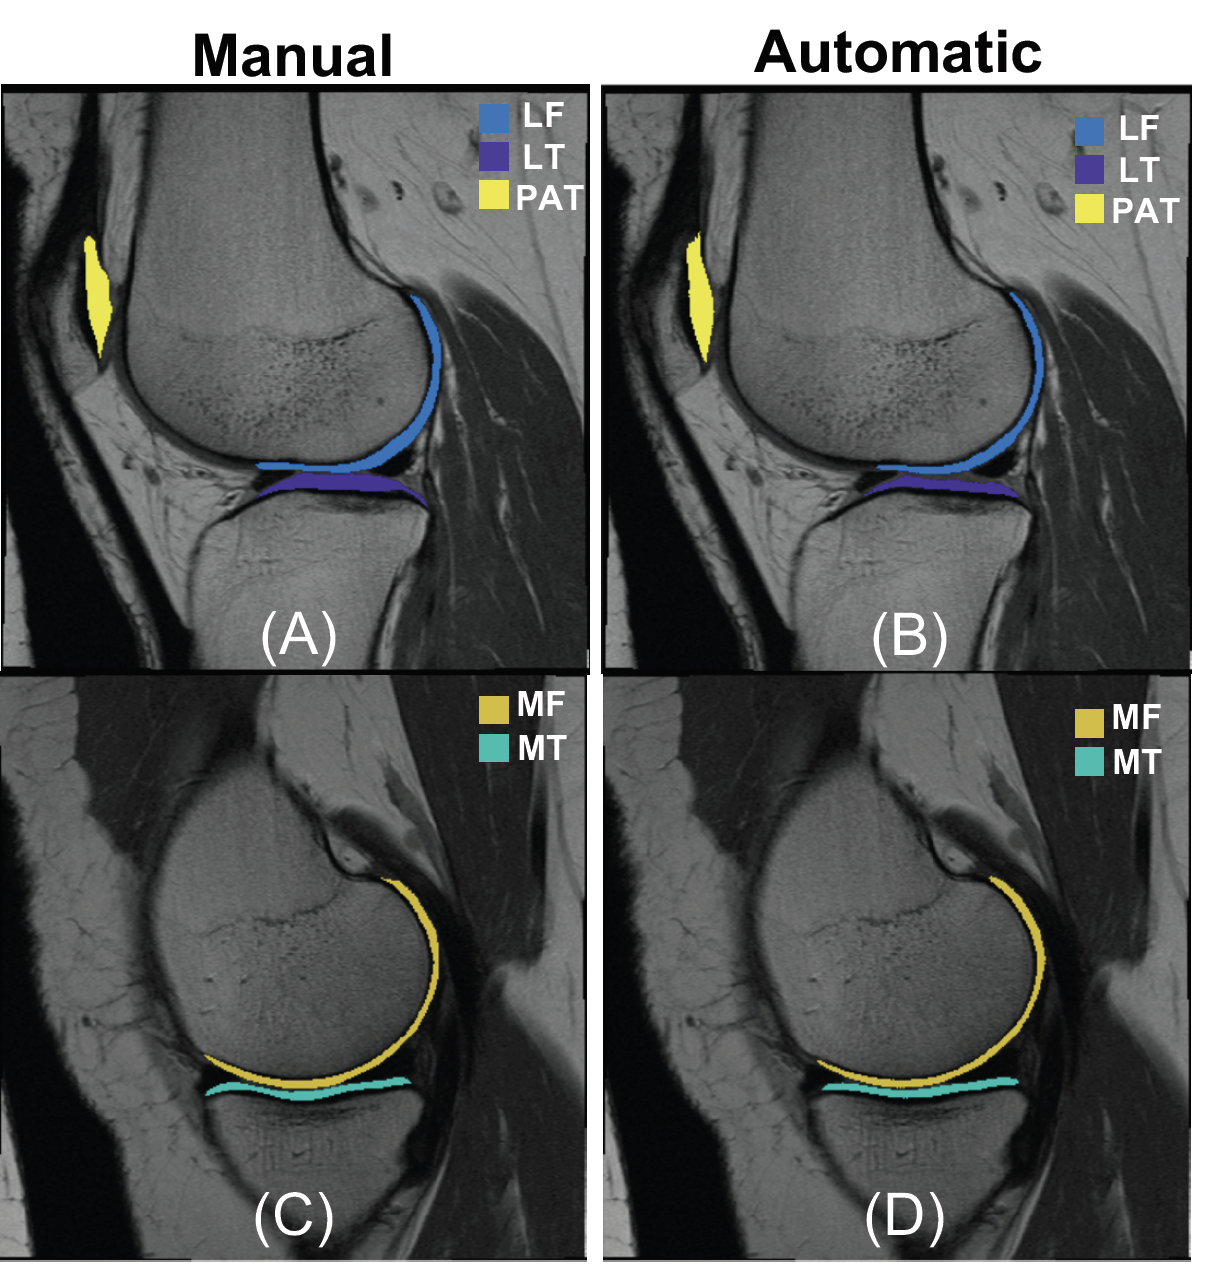
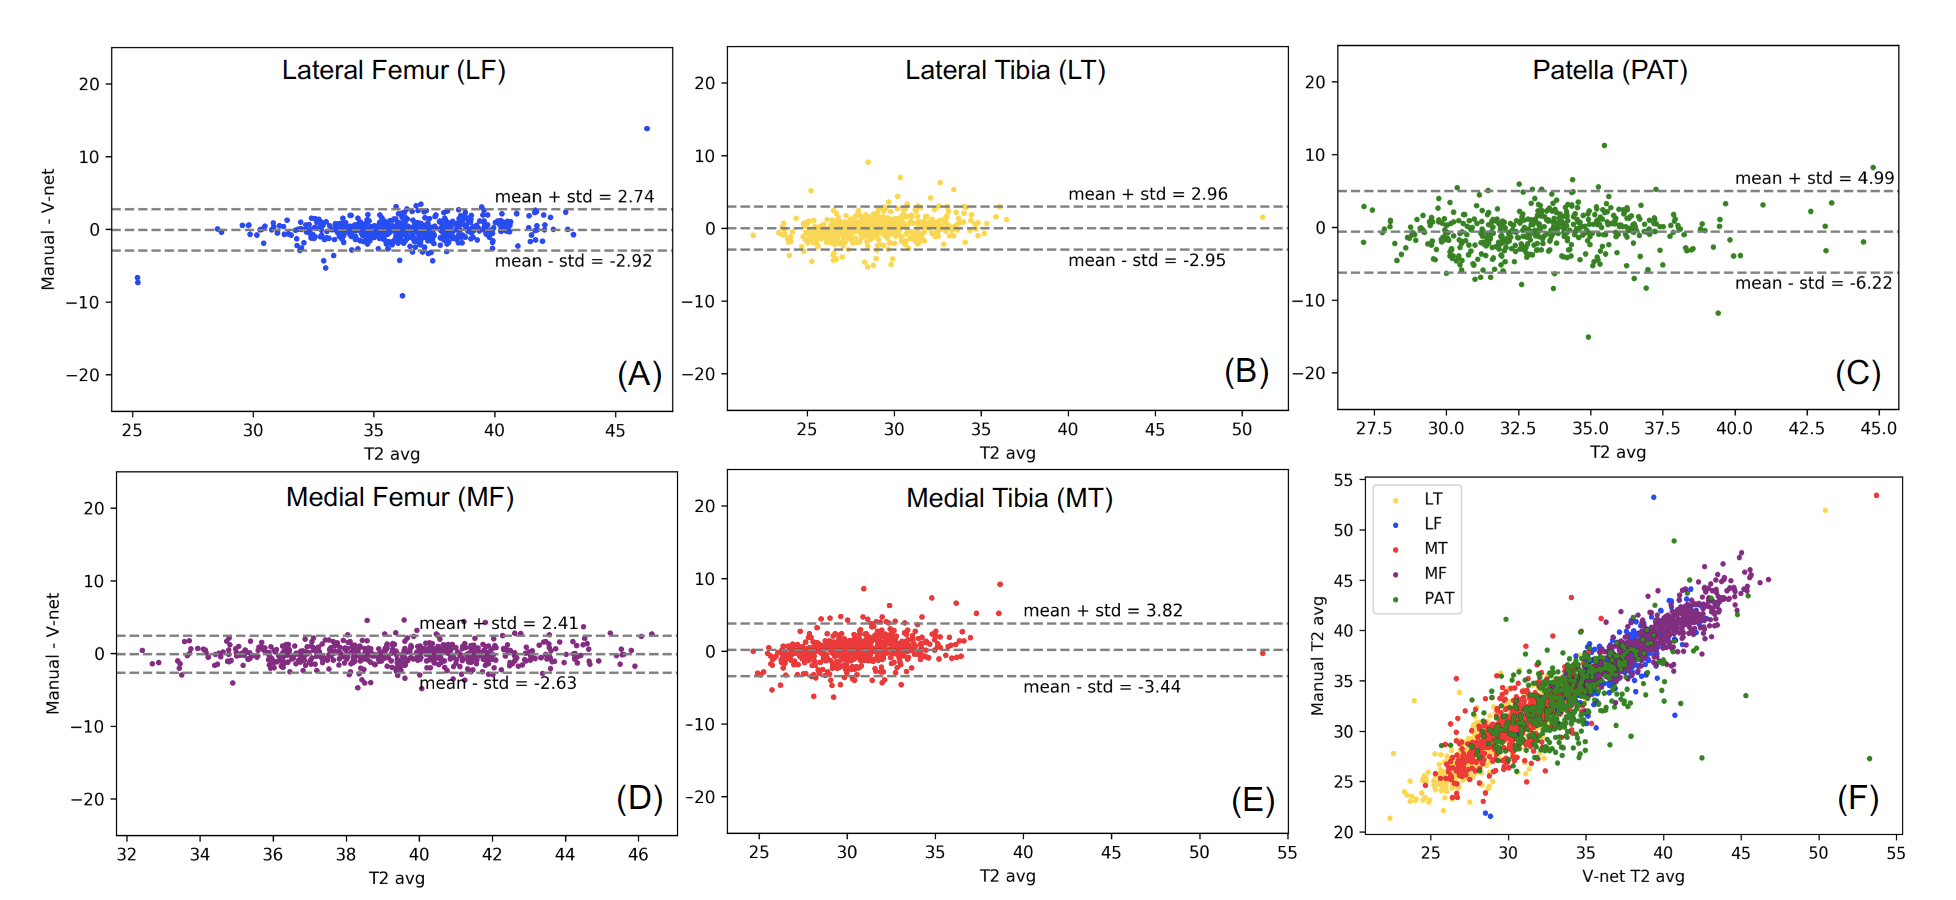
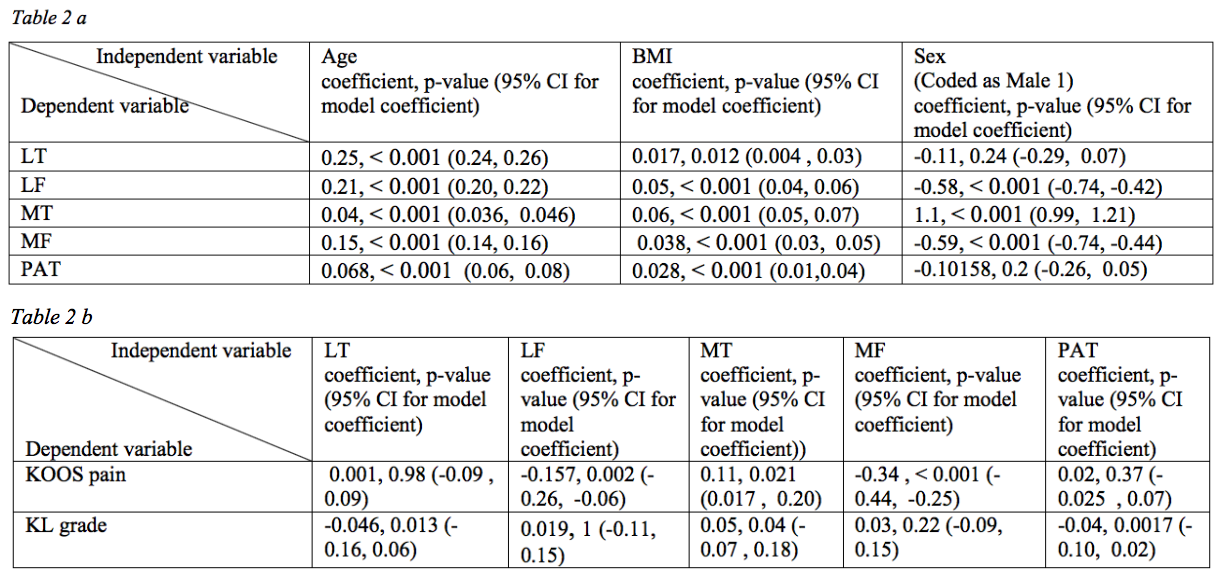
Table 2 a: Results of regression model for finding association between T2 and demographic features. The p-value of feature significance is calculated using likelihood ratio test.
Table 2 b: Regression analysis results for the mixed effect models. P-values are derived from likelihood ratio tests of the full model against model without the variable of interest.